
302 lines
11 KiB
Markdown
302 lines
11 KiB
Markdown
|
||
> Name
|
||
|
||
MACD-Stochastics波段震荡突破策略MACD-Stochastics-Range-Breakout-Strategy
|
||
|
||
> Author
|
||
|
||
ChaoZhang
|
||
|
||
> Strategy Description
|
||
|
||
|
||
[trans]
|
||
|
||
## 概述
|
||
|
||
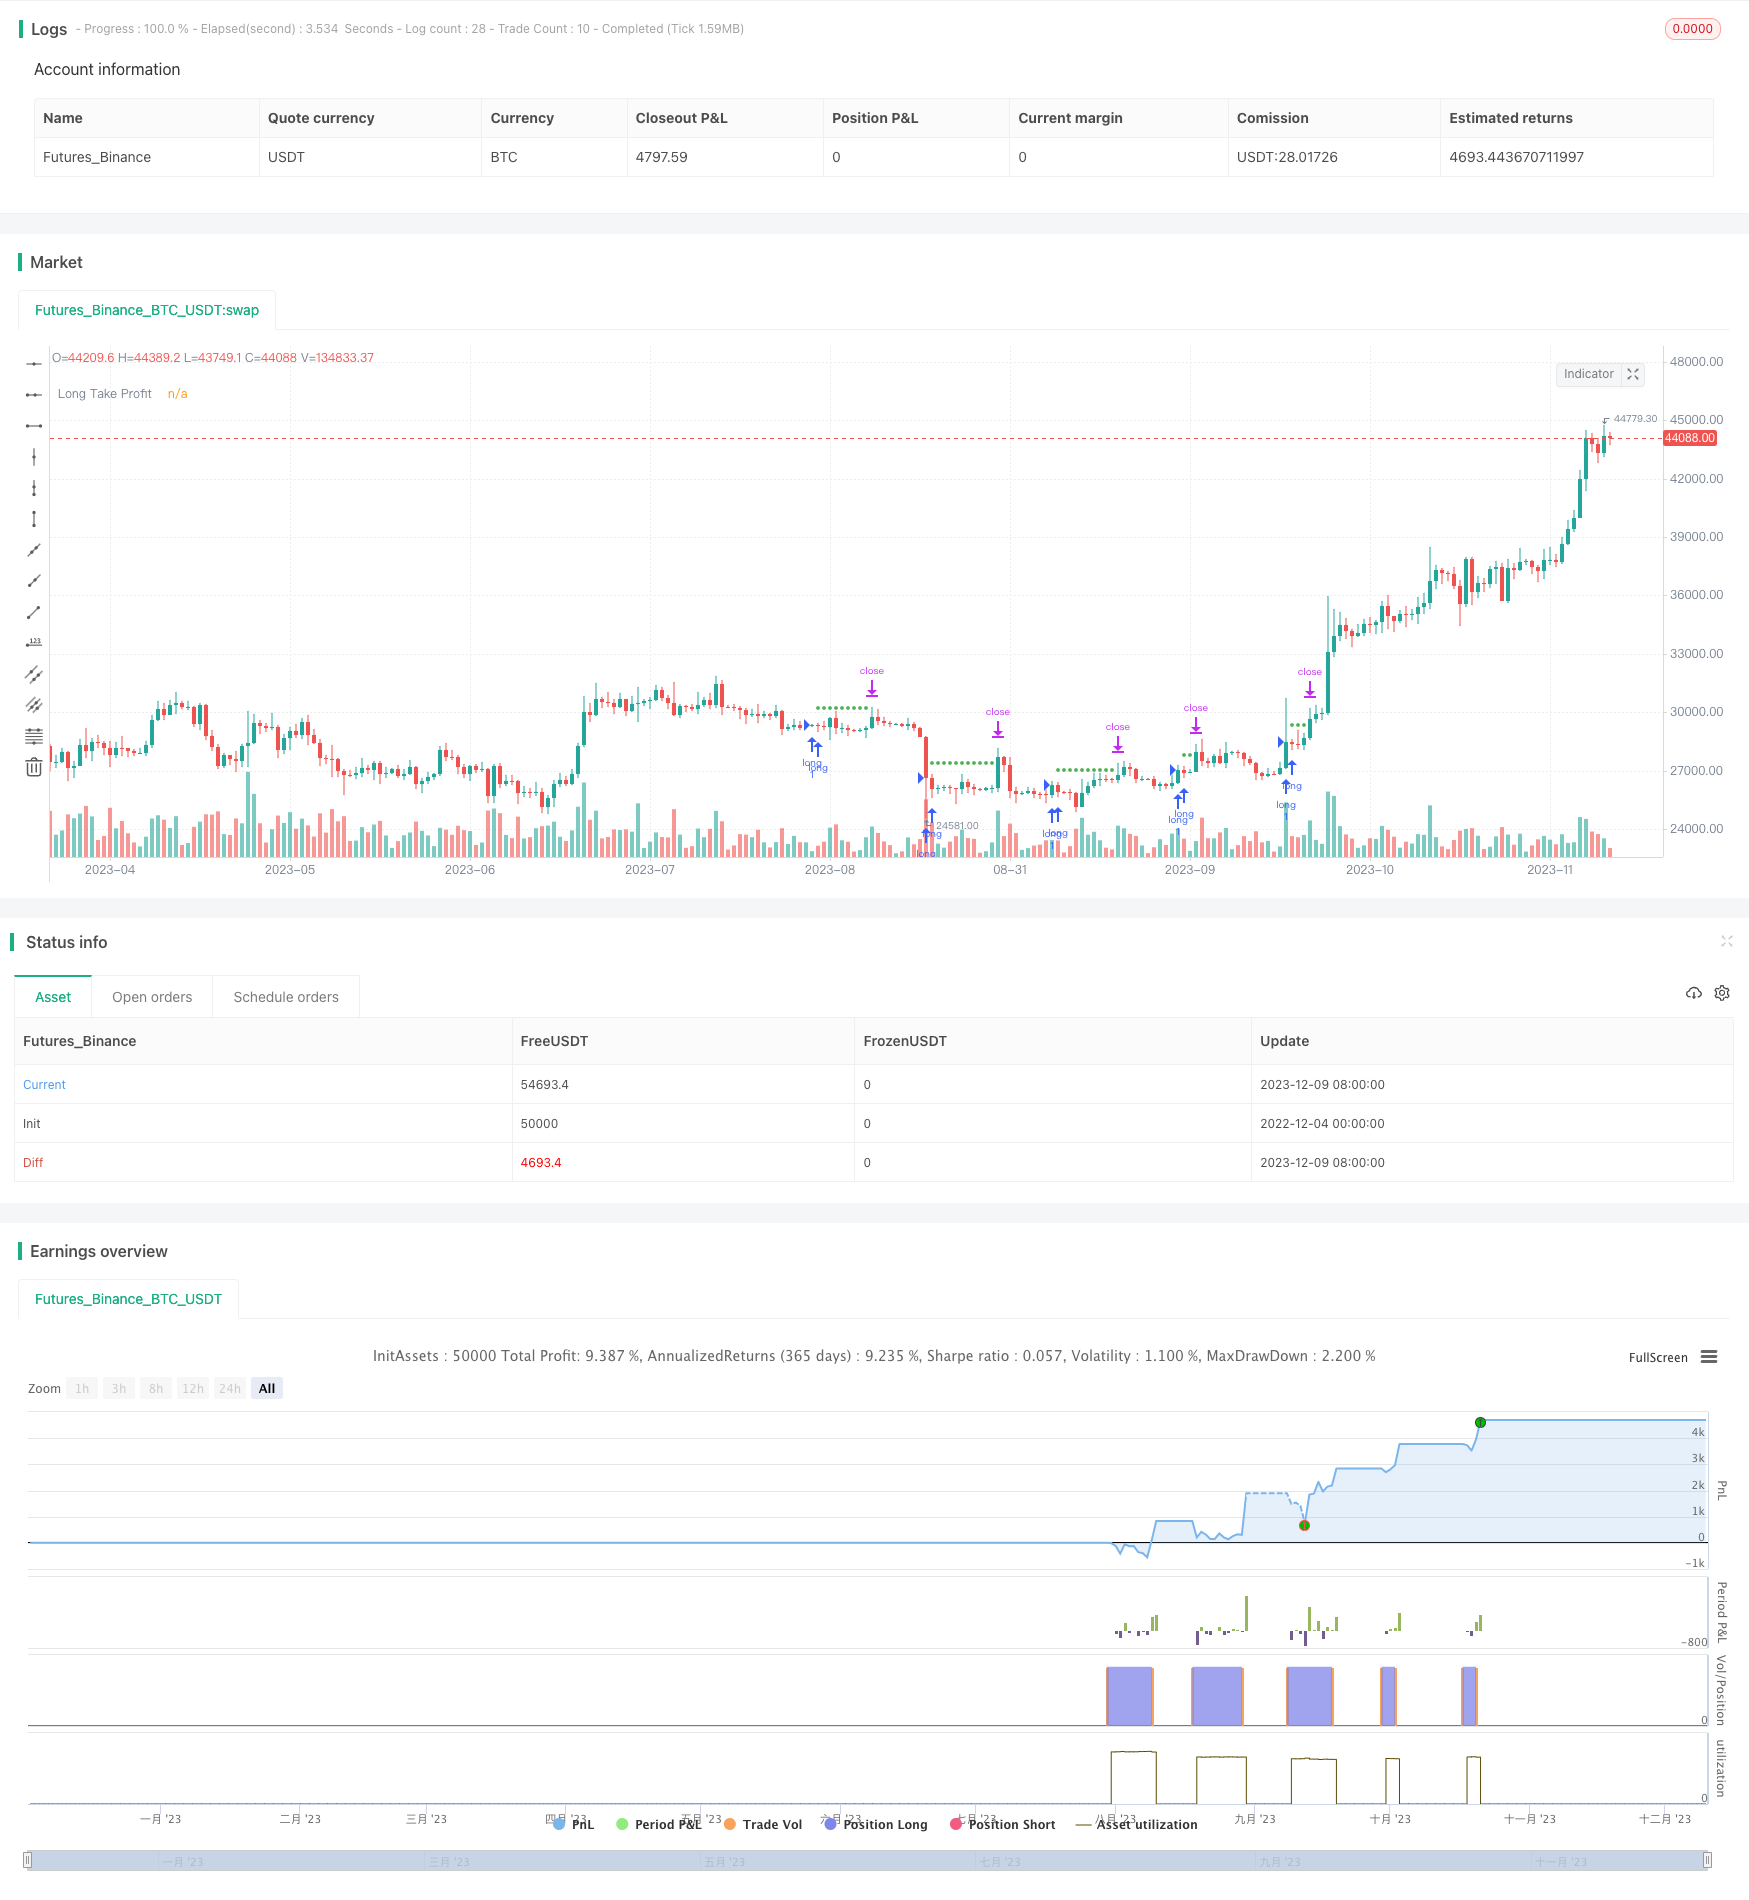
MACD Stochastics波段震荡突破策略(MACD Stochastics Oscillation Breakout Strategy)是一个结合MACD指标和Stochastics指标的量化交易策略。该策略试图识别股票价格的趋势方向,并在价格从震荡区间突破时进入仓位。
|
||
|
||
在进入仓位时,该策略同时考虑MACD和Stochastics两个指标的信号,以提高 Entries的质量。另外,该策略预设了止损点和止盈点,可以有效控制风险。
|
||
|
||
## 策略原理
|
||
|
||
MACD Stochastics波段震荡突破策略主要基于以下原理:
|
||
|
||
1. MACD指标可以有效识别股票价格趋势的方向和力度
|
||
2. Stochastics指标可以识别股票是否处于超买或超卖状态
|
||
3. 当股票价格长时间震荡时,很可能会突破之前的价格区间,产生较大方向性行情
|
||
4. 结合MACD和Stochastics指标的信号,可以在股票突破波段震荡区间时及时入场,提高 Entries质量
|
||
|
||
具体来说,该策略以MACD指标的DIFF线和DEA线交叉作为判断价格趋势方向的信号。当DIFF向上突破DEA时生成多头信号,反之生成空头信号。
|
||
|
||
同时,Stochastics的K线在超买超卖区域(默认30和70)附近与D线发生向上或向下交叉也会产生交易信号。
|
||
|
||
当MACD指标和Stochastics指标同时给出同向信号时,该策略会选择入场。此时股票价格很可能会产生较大的突破。
|
||
|
||
入场后,策略会设置理性的止损点和止盈点。合理止损可以有效控制单笔损失,止盈可以锁定盈利。
|
||
|
||
|
||
## 优势分析
|
||
|
||
MACD Stochastics波段震荡突破策略具有以下优势:
|
||
|
||
1. 多指标组合,提高信号质量
|
||
|
||
该策略同时利用MACD和Stochastics两个指标,可以过滤掉一些假信号,提高Entries质量。
|
||
|
||
2. 抓住突破行情,顺势而为
|
||
|
||
策略专门设计来抓住股价长时间震荡后的突破行情。这类行情幅度通常较大。
|
||
|
||
3. 优化止损止盈机制,有效控制风险
|
||
|
||
策略内置了止损止盈设定,可以合理控制单笔损失,并及时锁定盈利。
|
||
|
||
## 风险分析
|
||
|
||
尽管 MACD Stochastics波段震荡突破策略进行了慎重设计,仍然存在一定的风险:
|
||
|
||
1. 错失入场时机
|
||
|
||
股票价格突破前可能出现一定假突破情况。如果入场时机选择不当可能会使这次进入变成错过最佳入场点。
|
||
|
||
2. 突破失败
|
||
|
||
尽管突破前做了充分准备,但仍然存在突破失败的可能性。这种情况下会产生损失。
|
||
|
||
3. 参数优化不当
|
||
|
||
策略的参数设置会对结果产生很大影响。如果参数设置不当,会大打折扣。
|
||
|
||
针对以上风险,可以通过以下方式进行优化:
|
||
|
||
1. 组合其他指标过滤信号
|
||
|
||
2. 人工干预确保突破立场
|
||
|
||
3. 多组参数优化测试
|
||
|
||
## 优化方向
|
||
|
||
MACD Stochastics波段震荡突破策略仍有进一步优化的空间:
|
||
|
||
1. 优化 MACD 参数,找到最佳参数组合
|
||
|
||
2. 优化 Stochastics 参数,找到最佳参数组合
|
||
|
||
3. 增加其他指标组合,例如 KDJ、BOLL 等,进一步提升 Entries 质量
|
||
|
||
4. 测试不同持仓时间,优化止盈止损策略
|
||
|
||
5. 测试不同交易标的参数差异性
|
||
|
||
6. 增加机器学习算法,自动优化参数
|
||
|
||
## 总结
|
||
|
||
MACD Stochastics波段震荡突破策略综合运用 MACD 和 Stochastics 两个指标,在波段震荡突破时高质量入场,顺势而为。同时辅以止损止盈策略有效控制风险。该策略抓住股票价格的短期趋势行情,具有一定的交易优势。但也还有参数优化和技术指标组合方面的探索空间,有待于进一步优化。
|
||
|
||
||
|
||
|
||
|
||
## Overview
|
||
|
||
The MACD Stochastics Range Breakout Strategy combines the MACD and Stochastics indicators into a quantitative trading strategy. It attempts to identify the trend direction of stock prices and take positions when prices break out of ranging zones.
|
||
|
||
When taking positions, this strategy considers the signals from both MACD and Stochastics to improve the quality of entries. Also, preset stop loss and take profit points can effectively control risks.
|
||
|
||
## Strategy Logic
|
||
|
||
The MACD Stochastics Range Breakout Strategy is mainly based on the following principles:
|
||
|
||
1. MACD indicator can effectively identify the direction and momentum of price trends
|
||
2. Stochastics indicator can spot overbought or oversold conditions of a stock
|
||
3. When stock price has been ranging for a period of time, a significant directional move after breaking previous range is likely to happen
|
||
4. Combining the signals from MACD and Stochastics on range breakouts allows timely entries and improves quality
|
||
|
||
Specifically, the strategy uses the MACDDIFF line crossing over DEA line to determine bullish or bearish trend signals. When DIFF crosses over DEA upwards, it generates a bullish signal and vice versa.
|
||
|
||
Meanwhile, crosses between Stochastics’s K line and D line around overbought/oversold areas (default 30 and 70) also produce trade signals.
|
||
|
||
When MACD and Stochastics give aligned signals, the strategy will take a position. At this point, a major price move is likely.
|
||
|
||
After entering, stop loss and take profit points are set to rationally control single trade loss and lock in profits.
|
||
|
||
|
||
## Strengths
|
||
|
||
The MACD Stochastics Range Breakout Strategy has the following strengths:
|
||
|
||
1. Combining indicators improves signal quality
|
||
|
||
Utilizing both MACD and Stochastics filters out some fake signals and allows better entry quality.
|
||
|
||
2. Capturing breakout moves and trend trading
|
||
|
||
The strategy specializes in catching significant breakout moves after ranging. These moves tend to be huge.
|
||
|
||
3. Optimized stop loss/take profit mechanism effectively controls risks
|
||
|
||
Built-in stop loss/take profit logic reasonably limits single trade loss and timely locks in gains.
|
||
|
||
|
||
## Risks
|
||
|
||
Despite careful design, MACD Stochastics Range Breakout Strategy has some inherent risks:
|
||
|
||
1. Missing perfect entry timing
|
||
|
||
False breakouts are common before valid breakouts happen. Suboptimal entry timing may result in missed best entry price.
|
||
|
||
2. Failed breakout
|
||
|
||
While adequate preparations are made prior to entries, failed breakouts are still possible, leading to losses.
|
||
|
||
3. Improper parameter optimization
|
||
|
||
Inappropriate parameter settings severely undermine strategy performance.
|
||
|
||
|
||
To address the above risks, the following optimizations can be adopted:
|
||
|
||
1. Adding other indicators to filter signals
|
||
|
||
2. Manual intervention to ensure valid breakout
|
||
|
||
3. Rigorous multi-set parameter optimization tests
|
||
|
||
|
||
## Optimization Directions
|
||
|
||
There remains room for further optimization of the MACD Stochastics Range Breakout Strategy:
|
||
|
||
1. Optimize MACD parameters to find best combination
|
||
|
||
2. Optimize Stochastics parameters to find best combination
|
||
|
||
3. Incorporate other indicators like KDJ, BOLL to improve entry quality
|
||
|
||
4. Test different holding periods, optimize stop loss/take profit
|
||
|
||
5. Test cross-asset parameter differences
|
||
|
||
6. Introduce machine learning algorithms for automated parameter optimization
|
||
|
||
|
||
## Conclusion
|
||
|
||
The MACD Stochastics Range Breakout Strategy capitalizes on range breakouts by entering based on aligned signals from both MACD and Stochastics. The stop loss/take profit mechanism further controls risks. It aims to capture short-term trends but still leaves room for parameter tuning and more indicator combinations for better performance.
|
||
|
||
[/trans]
|
||
|
||
> Strategy Arguments
|
||
|
||
|
||
|
||
|Argument|Default|Description|
|
||
|----|----|----|
|
||
|v_input_1|180|Fast Length|
|
||
|v_input_2|390|Slow Length|
|
||
|v_input_3_close|0|Source: close|high|low|open|hl2|hlc3|hlcc4|ohlc4|
|
||
|v_input_int_1|135|Signal Smoothing|
|
||
|v_input_string_1|0|Oscillator MA Type: EMA|SMA|
|
||
|v_input_string_2|0|Signal Line MA Type: EMA|SMA|
|
||
|v_input_int_2|14|%K Length|
|
||
|v_input_int_3|true|%K Smoothing|
|
||
|v_input_int_4|3|%D Smoothing|
|
||
|v_input_float_1|3|Long Take Profit (%)|
|
||
|v_input_float_2|3|Short Take Profit (%)|
|
||
|
||
|
||
> Source (PineScript)
|
||
|
||
``` javascript
|
||
/*backtest
|
||
start: 2022-12-04 00:00:00
|
||
end: 2023-12-10 00:00:00
|
||
period: 1d
|
||
basePeriod: 1h
|
||
exchanges: [{"eid":"Futures_Binance","currency":"BTC_USDT"}]
|
||
*/
|
||
|
||
//@version=5
|
||
strategy(title="macd stoch strategy", shorttitle="benzo MACD stoch",overlay=true)
|
||
// Getting inputs
|
||
fast_length = input(title = "Fast Length", defval = 180)
|
||
slow_length = input(title = "Slow Length", defval = 390)
|
||
src = input(title = "Source", defval = close)
|
||
signal_length = input.int(title = "Signal Smoothing", minval = 1, maxval = 500, defval = 135)
|
||
sma_source = input.string(title = "Oscillator MA Type", defval = "EMA", options = ["SMA", "EMA"])
|
||
sma_signal = input.string(title = "Signal Line MA Type", defval = "EMA", options = ["SMA", "EMA"])
|
||
// Calculating
|
||
fast_ma = sma_source == "SMA" ? ta.sma(src, fast_length) : ta.ema(src, fast_length)
|
||
slow_ma = sma_source == "SMA" ? ta.sma(src, slow_length) : ta.ema(src, slow_length)
|
||
macd = fast_ma - slow_ma
|
||
signal = sma_signal == "SMA" ? ta.sma(macd, signal_length) : ta.ema(macd, signal_length)
|
||
hist = macd - signal
|
||
|
||
// hline(0, "Zero Line", color = color.new(#787B86, 50))
|
||
// plot(hist, title = "Histogram", style = plot.style_columns, color = (hist >= 0 ? (hist[1] < hist ? #26A69A : #B2DFDB) : (hist[1] < hist ? #FFCDD2 : #FF5252)))
|
||
// plot(macd, title = "MACD", color = #2962FF)
|
||
|
||
// plot(signal, title = "Signal", color = #FF6D00)
|
||
|
||
periodK = input.int(14, title="%K Length", minval=1)
|
||
smoothK = input.int(1, title="%K Smoothing", minval=1)
|
||
periodD = input.int(3, title="%D Smoothing", minval=1)
|
||
k = ta.sma(ta.stoch(close, high, low, periodK), smoothK)
|
||
d = ta.sma(k, periodD)
|
||
// plot(k, title="%K", color=#2962FF)
|
||
// plot(d, title="%D", color=#FF6D00)
|
||
// h0 = hline(80, "Upper Band", color=#787B86)
|
||
// hline(50, "Middle Band", color=color.new(#787B86, 50))
|
||
// h1 = hline(20, "Lower Band", color=#787B86)
|
||
// fill(h0, h1, color=color.rgb(33, 150, 243, 90), title="Background")
|
||
|
||
|
||
// Make inputs that set the take profit % (optional)
|
||
longProfitPerc = input.float(3, title="Long Take Profit (%)", minval=0.0, step=0.1) * 0.01
|
||
|
||
shortProfitPerc = input.float(3, title="Short Take Profit (%)",minval=0.0, step=0.1) * 0.01
|
||
|
||
// Calculate trading conditions
|
||
enterLong = macd>signal and ta.crossover(k,30)
|
||
enterShort = macd<signal and ta.crossunder(k,70)
|
||
|
||
// Figure out take profit price
|
||
longExitPrice = strategy.position_avg_price * (1 + longProfitPerc)
|
||
shortExitPrice = strategy.position_avg_price * (1 - shortProfitPerc)
|
||
|
||
// Plot take profit values for confirmation
|
||
plot(strategy.position_size > 0 ? longExitPrice : na,
|
||
color=color.green, style=plot.style_circles,
|
||
linewidth=3, title="Long Take Profit")
|
||
|
||
plot(strategy.position_size < 0 ? shortExitPrice : na,
|
||
color=color.red, style=plot.style_circles,
|
||
linewidth=3, title="Short Take Profit")
|
||
|
||
// Submit entry orders
|
||
if enterLong
|
||
strategy.entry("long", strategy.long)
|
||
|
||
if enterShort
|
||
strategy.entry("short", strategy.short)
|
||
|
||
// STEP 3:
|
||
// Submit exit orders based on take profit price
|
||
if strategy.position_size > 0
|
||
strategy.exit("long TP", limit=longExitPrice)
|
||
|
||
if strategy.position_size < 0
|
||
strategy.exit("short TP", limit=shortExitPrice)
|
||
```
|
||
|
||
> Detail
|
||
|
||
https://www.fmz.com/strategy/434960
|
||
|
||
> Last Modified
|
||
|
||
2023-12-11 11:48:27
|