
188 lines
8.5 KiB
Markdown
188 lines
8.5 KiB
Markdown
|
|
> Name
|
|
|
|
震荡突破布林带T3均线策略Bollinger-Band-T3-Moving-Average-Strategy
|
|
|
|
> Author
|
|
|
|
ChaoZhang
|
|
|
|
> Strategy Description
|
|
|
|
|
|
|
|
[trans]
|
|
|
|
|
|
## 概述
|
|
|
|
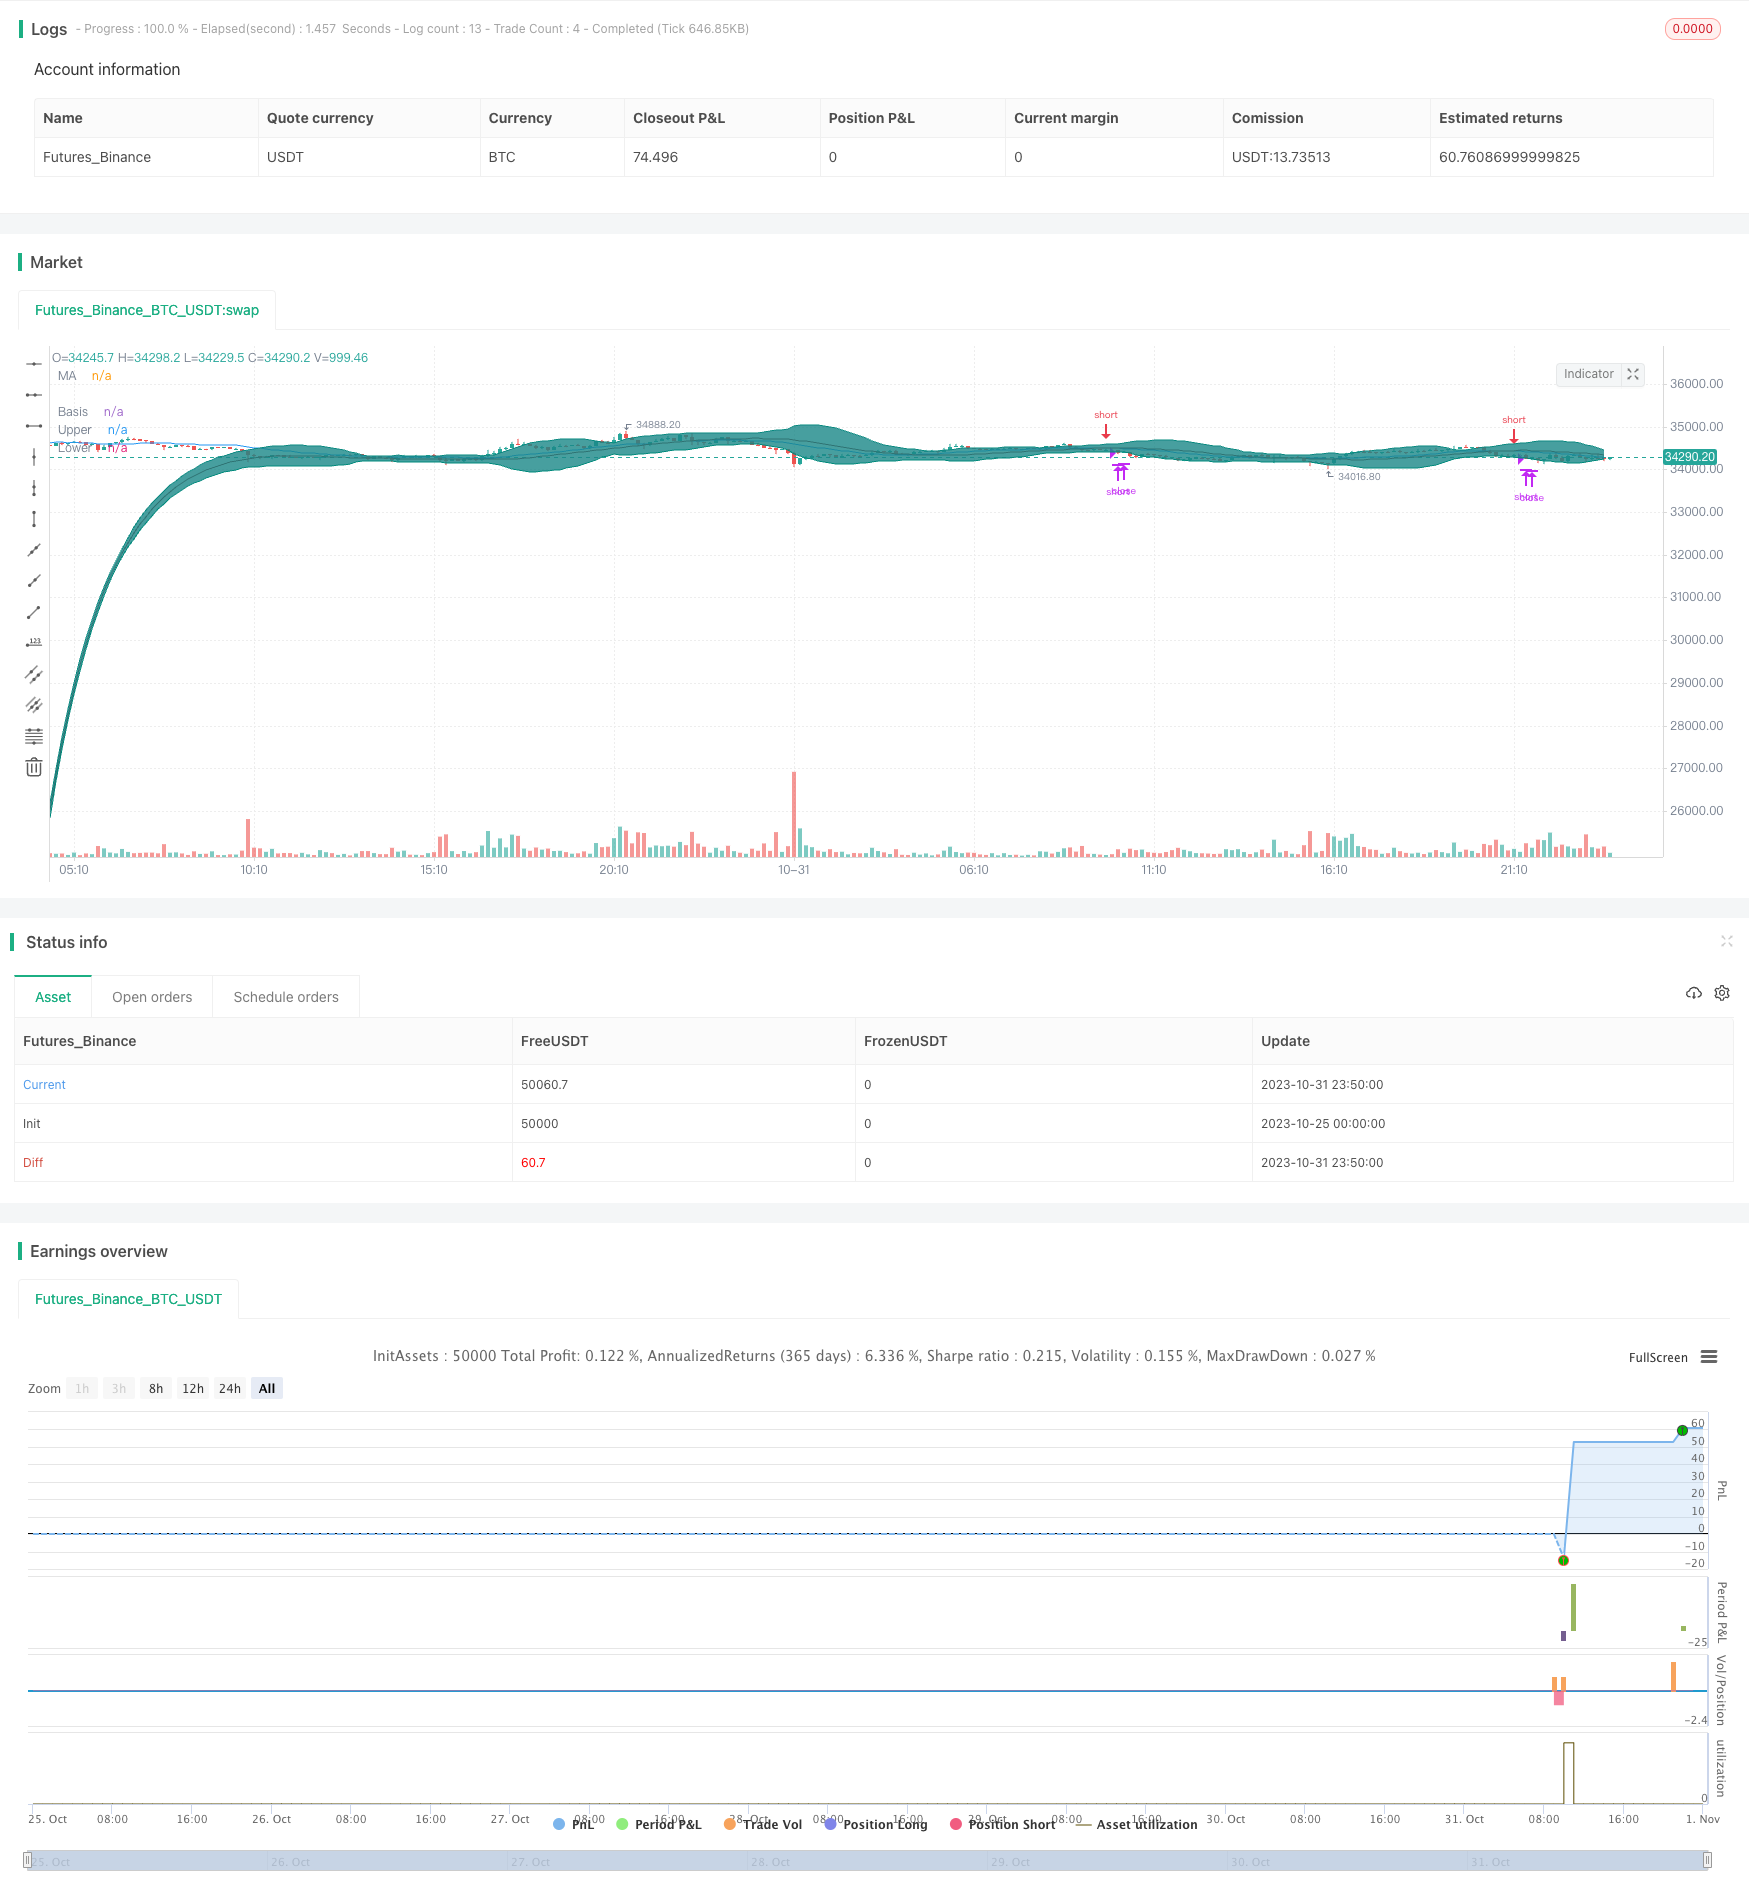
该策略充分利用均线的趋势判断功能和布林带的超买超卖判定,辅以T3平滑均线过滤震荡,实现在趋势发生转折的时候及时判断形态并进入场内,在震荡区间利用布林带识别超买超卖区域来进行反向操作,实现超短线交易。
|
|
|
|
## 策略原理
|
|
|
|
该策略主要利用三组均线来识别趋势和进行交易信号判断。首先是T3均线,通过多次指数平滑起到滤波作用,可以有效过滤价格震荡,判断趋势方向。其次是中期均线,这里采用了长度为20的SMA均线,来判断中期趋势方向。最后是快慢均线,分别取长度50和200的T3均线,快线大于慢线表明处于上升趋势,否则为下降趋势。
|
|
|
|
交易信号的判断是,当中期均线发生金叉时结合上升趋势去做多,当中期均线发生死叉时结合下降趋势去做空。此外,还利用布林带上下轨进行情况判断,如果价格突破上轨会考虑止盈,如果下破下轨会考虑止损。
|
|
|
|
具体来说,做多的条件是中期均线上穿中期T3均线,且快线大于慢线,做多后如果价格突破布林带上轨或者中期均线下穿T3均线就考虑止盈;做空的条件是中期均线下穿T3均线,且快线小于慢线,做空后如果价格跌破布林带下轨或者中期均线上穿T3均线就考虑止损。
|
|
|
|
## 策略优势
|
|
|
|
- 利用多组均线充分发挥各自的优势,T3平滑去噪,中期SMA判断趋势,快慢均线判断长期趋势
|
|
- 布林带上下轨判断超买超卖区域,降低亏损风险
|
|
- 交易信号组合严格,可有效过滤震荡误导
|
|
|
|
## 策略风险
|
|
|
|
- T3均线参数设置不当可能无法有效滤波,也会造成滞后
|
|
- 布林带参数设置不当,可能导致上下轨无效
|
|
- 均线周期选择不当,可能判断错误趋势方向
|
|
- 突破上下轨止盈止损点设置不精确,可能止盈过早或止损过晚
|
|
|
|
优化方法:
|
|
- 调整T3均线参数,取得平滑去噪和滞后平衡
|
|
- 调整布林带参数,使上下轨包裹正常波动范围
|
|
- 测试不同周期均线参数,找到适合品种的周期参数
|
|
- 根据回测结果优化止盈止损点
|
|
|
|
## 策略优化方向
|
|
|
|
- 增加趋势强弱判断,如ADX,避免趋势转折被套
|
|
- 增加波动率指标,根据市场波动调整参数
|
|
- 增加移动止损,追踪止损让利润更多流出
|
|
- 可以考虑breakout策略,突破上下轨之后再追踪止损
|
|
|
|
## 总结
|
|
|
|
该策略整体来说,利用均线系统性地判断趋势,利用布林带识别超买超卖区域,可在趋势发生转折时及时判断形态进入场内,并且能够有效控制风险。但需要注意参数调整与优化,才能真正发挥策略的效果。如果进一步结合趋势强度指标、波动率指标,以及移动止损技术进行优化,可以使策略更具弹性与智能。
|
|
|
|
||
|
|
|
|
## Overview
|
|
|
|
This strategy makes full use of the trend judgment of moving averages and overbought/oversold judgment of Bollinger Bands. With the smoothing of T3 moving average, it can identify the trend reversal timely and enter the market. In the oscillation zone, it uses the Bollinger Bands to identify overbought/oversold areas for counter trend trading. So it realizes ultra short-term trading.
|
|
|
|
## Strategy Logic
|
|
|
|
The strategy mainly uses three groups of moving averages to identify the trend and generate trading signals. First is the T3 moving average, which can filter price fluctuations through exponential smoothing and judge the trend direction. Second is the middle-term moving average, here uses 20-period SMA to determine the middle-term trend. Last is the fast and slow moving averages, 50-period and 200-period T3 moving averages respectively. When fast line is greater than slow line, it indicates an upward trend, otherwise downward trend.
|
|
|
|
The trading signals are generated when the middle-term SMA crosses over the middle-term T3 upward combining with an upward trend, go long. When the middle-term SMA crosses below the middle-term T3 downward combining with a downward trend, go short. In addition, the Bollinger Bands can be used for profit taking and stop loss. If price breaks through the upper band, consider taking profit. If price breaks through the lower band, consider stop loss.
|
|
|
|
Specifically, the long condition is middle SMA crosses over middle T3 upward, and fast MA is greater than slow MA. If price breaks through the upper Bollinger band or middle SMA crosses below T3, consider taking profit. The short condition is middle SMA crosses below middle T3 downward, and fast MA is less than slow MA. If price breaks through the lower Bollinger band or middle SMA crosses above T3, consider stop loss.
|
|
|
|
## Advantages
|
|
|
|
- Fully utilize the advantages of multiple moving averages, T3 for smoothing, middle SMA for trend, fast and slow MAs for long-term trend
|
|
- Bollinger Bands upper and lower bands judge overbought/oversold levels, reduce loss risk
|
|
- Strict trading signals combination, avoid misleading by fluctuations
|
|
|
|
## Risks
|
|
|
|
- Improper T3 parameters may fail to smooth or cause lagging
|
|
- Improper Bollinger Bands parameters may cause invalid bands
|
|
- Wrong moving average periods lead to wrong trend direction
|
|
- Inaccurate breakout points for profit taking and stop loss, may exit too early or too late
|
|
|
|
Improvements:
|
|
- Adjust T3 parameters for balancing smoothing and lagging
|
|
- Adjust Bollinger Bands parameters to cover normal fluctuation range
|
|
- Test different moving average periods to find suitable ones for the asset
|
|
- Optimize take profit and stop loss points based on backtest results
|
|
|
|
## Optimization Directions
|
|
|
|
- Add trend strength indicator like ADX to avoid reverse at trend turning points
|
|
- Add volatility indicator to adjust parameters based on market volatility
|
|
- Add trailing stop loss to allow more profits to run out
|
|
- Consider breakout strategy, trailing stop loss after breaking bands
|
|
|
|
## Summary
|
|
|
|
In summary, this strategy uses moving averages systematically to determine the trend, and identifies overbought/oversold levels with Bollinger Bands. It can enter the market timely at trend reversals, and also effectively controls risks. But parameters tuning and optimization are important for the strategy to truly perform well. Further combining with trend strength, volatility, and trailing stop loss can make the strategy more robust and intelligent.
|
|
|
|
[/trans]
|
|
|
|
> Strategy Arguments
|
|
|
|
|
|
|
|
|Argument|Default|Description|
|
|
|----|----|----|
|
|
|v_input_1|20|length|
|
|
|v_input_2|2.5|StdDev|
|
|
|v_input_3|false|Offset|
|
|
|v_input_4|true|Stop Loss|
|
|
|
|
|
|
> Source (PineScript)
|
|
|
|
``` javascript
|
|
/*backtest
|
|
start: 2023-10-25 00:00:00
|
|
end: 2023-11-01 00:00:00
|
|
period: 10m
|
|
basePeriod: 1m
|
|
exchanges: [{"eid":"Futures_Binance","currency":"BTC_USDT"}]
|
|
*/
|
|
|
|
//@version=4
|
|
strategy(shorttitle="BB T3 Strategy", title="BB T3 Strategy", overlay=true)
|
|
|
|
//T3
|
|
b = 0.7
|
|
c1 = -b*b*b
|
|
c2 = 3*b*b+3*b*b*b
|
|
c3 = -6*b*b-3*b-3*b*b*b
|
|
c4 = 1+3*b+b*b*b+3*b*b
|
|
|
|
t3(len) => c1 * ema(ema(ema(ema(ema(ema(close, len), len), len), len), len), len) + c2 * ema(ema(ema(ema(ema(close, len), len), len), len), len) + c3 * ema(ema(ema(ema(close, len), len), len), len) + c4 * ema(ema(ema(close, len), len), len)
|
|
//T3 end
|
|
|
|
length = input(20, minval=1)
|
|
|
|
mult = input(2.5, minval=0.001, maxval=50, title="StdDev")
|
|
basis = t3(length)
|
|
basisDev = t3(length/10)
|
|
|
|
dev = mult * stdev(basisDev,length)
|
|
upper = basis + dev
|
|
lower = basis - dev
|
|
offset = input(0, "Offset", type = input.integer, minval = -500, maxval = 500)
|
|
plot(basis, "Basis", color=#872323, offset = offset)
|
|
p1 = plot(upper, "Upper", color=color.teal, offset = offset)
|
|
p2 = plot(lower, "Lower", color=color.teal, offset = offset)
|
|
fill(p1, p2, title = "Background", color=#198787, transp=95)
|
|
|
|
stoploss = input(true, "Stop Loss")
|
|
|
|
basisSma = sma(close, length)
|
|
p3 = plot(basisSma, color=color.blue, title="MA", offset=offset)
|
|
|
|
fastT3 = t3(50)
|
|
slowT3 = t3(200)
|
|
|
|
crossUp = crossover(basisSma, basis)
|
|
crossDown = crossunder(basisSma, basis)
|
|
bollBounce = crossover(close, upper)
|
|
bollReject = crossunder(close, lower)
|
|
underBasis = crossunder(close, basis)
|
|
overBasis = crossover(close, basis)
|
|
|
|
trendUp = fastT3 > slowT3
|
|
trendDown = fastT3 < slowT3
|
|
|
|
strategy.entry("long", strategy.long, when=(trendUp and crossUp), stop=(stoploss ? high+syminfo.mintick : na))
|
|
strategy.close("long", when=(bollBounce or crossDown or underBasis))
|
|
strategy.entry("short", strategy.short, when=(trendDown and crossDown), stop=(stoploss ? low-syminfo.mintick : na))
|
|
strategy.close("short", when=(bollReject or crossUp or overBasis))
|
|
|
|
```
|
|
|
|
> Detail
|
|
|
|
https://www.fmz.com/strategy/430869
|
|
|
|
> Last Modified
|
|
|
|
2023-11-02 15:45:31
|