
16 KiB
Name
趋势跟踪双EMA-Williams指标策略Dual-EMA-Williams-Indicator-Trend-Tracking-Strategy
Author
ChaoZhang
Strategy Description
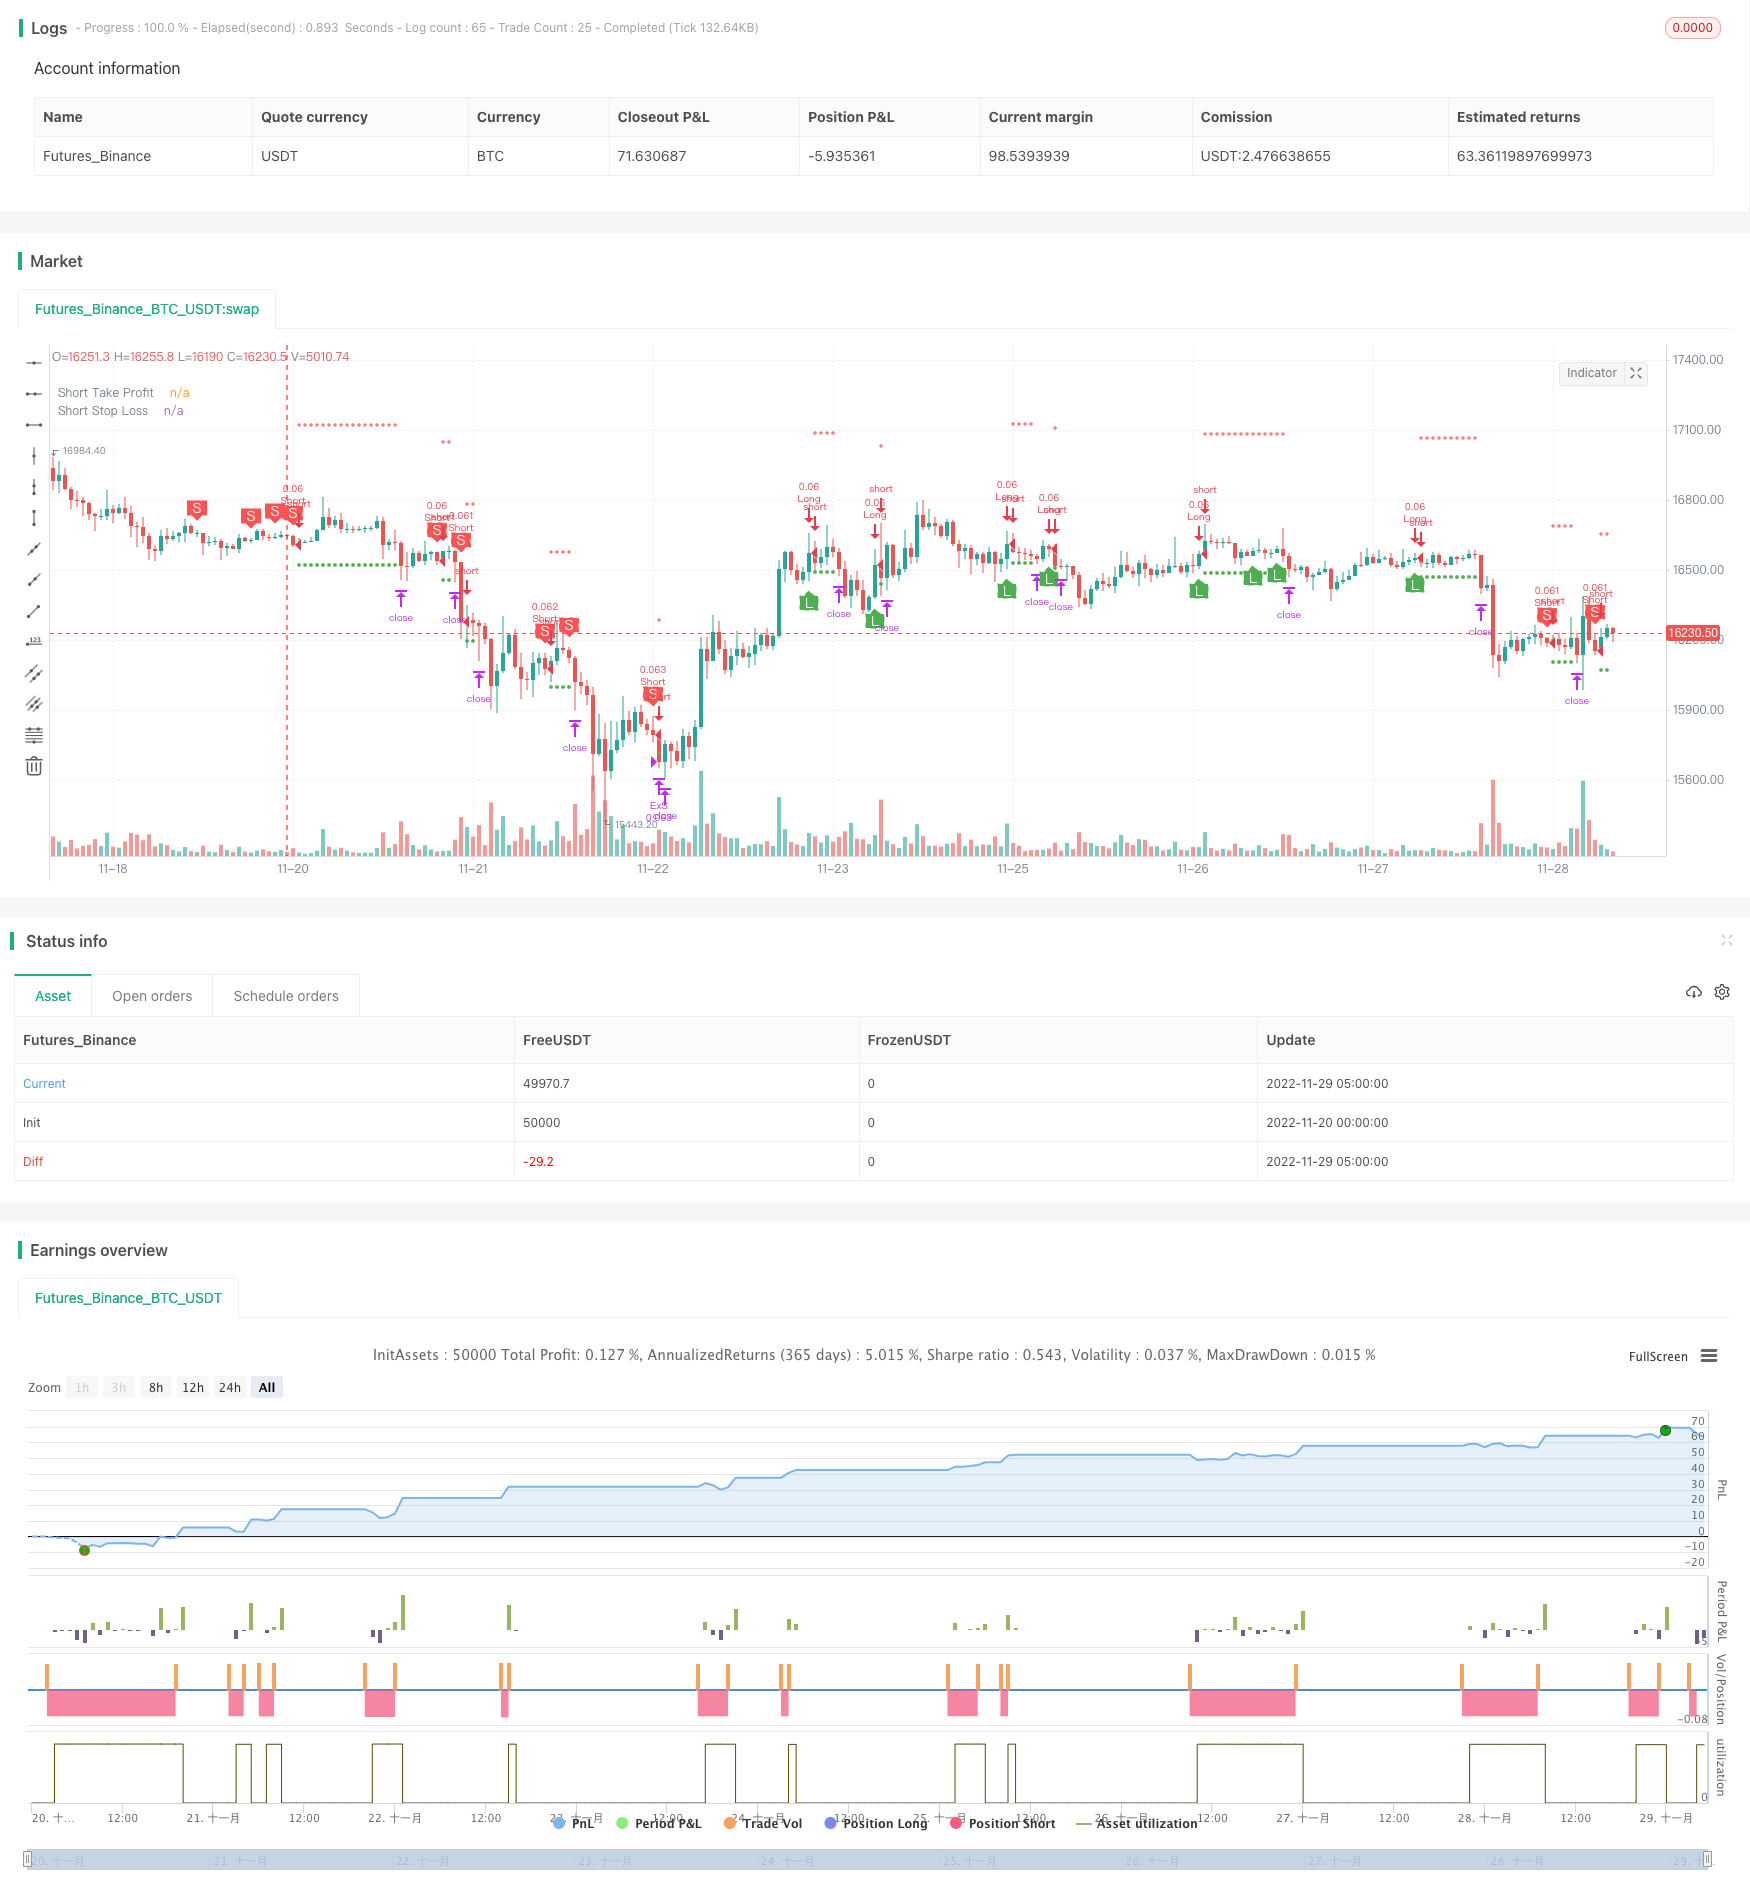 [trans]
概述
该策略结合双EMA指标和Williams指标来识别趋势方向,在趋势较强时进行追踪。其基本思路是:
- 使用双EMA组合过滤除最强劲的趋势
- Williams指标确认当前处于超买超卖区域
- 结合RSI指标避免追高杀跌
原理
该策略运用双EMA指标中的短期EMA和长期EMA。当短期EMA向上穿越长期EMA时产生买入信号,短期EMA向下穿越长期EMA时产生卖出信号,利用双EMA捕捉中长期趋势。
此外,该策略还结合Williams指标来识别反转情况。Williams指标通过判定周期高点和低点,判断价格是否处于超买或超卖状态。当Williams指标显示超买时,产生卖出信号;当显示超卖时,产生买入信号。
代码中具体判断逻辑为:
多头入场:短期EMA上穿中期EMA和长期EMA,且Williams指标显示超卖区域,并在超卖区域形成最低点,表示反转机会,此时产生买入信号。
空头入场:短期EMA下穿中期EMA和长期EMA,且Williams指标显示超买区,并在超卖区形成最高点,表示反转机会,此时产生卖出信号。
此外,策略中还引入RSI指标,进一步确认交易信号,避免盲目追涨杀跌。
优势
该策略最大优势在于利用双EMA过滤掉大量无效趋势,仅仅选择最强劲的中长期趋势进行跟踪,从而过滤噪音,减少无效交易。
此外,Williams指标的引入也具有非常好的效果。其一是能够识别反转机会,从而及时平仓;其二是能够进一步确认趋势信号的有效性。
双EMA和Willams的组合使用,使得该策略能够在中长期品种中获得不错的跟踪盈利,同时也能够识别反转并限制亏损。
风险
该策略主要风险在于难以识别趋势反转点。尽管引入Williams指标以及RSI指标来确保反转交易的有效性,但是反转交易的难度仍然较大,无法完全避免追涨杀跌的风险。
此外,双EMA组合本身也存在一定滞后性。当短期趋势和中长期趋势脱节时,也可能给策略带来一定的识别困难。
优化
该策略可以从以下几个方面进行优化:
-
测试更多EMA周期组合,寻找更佳参数
-
增加自适应退出机制,利用ATR、volatility index等指标判断趋势反转
-
增加机器学习元素,利用LSTM等进行趋势和反转预测
-
利用波浪理论等方法进一步完善反转交易规则
-
引入自适应仓位管理,根据市场情况调整仓位规模
总结
本策略成功结合双EMA和Williams指标捕捉中长期趋势,在大趋势中获取更高收益。同时,Williams指标的引入也使得策略能够识别反转情况,并及时止损。下一步,通过引入更多指标和模型进行优化,进一步增强策略的稳定性。
||
Overview
This strategy combines dual EMA indicators and Williams indicators to identify trend direction and track trends when they are strong. The basic idea is:
- Use dual EMA combos to filter out all but the strongest trends
- Williams indicator confirms current overbought/oversold zone
- Combine with RSI indicator to avoid chasing new highs and killing declines
Principles
This strategy utilizes short-term and long-term EMAs from the dual EMA indicator. When the short-term EMA crosses above the long-term EMA an entry signal is generated. When the short-term EMA crosses below the long-term EMA an exit signal is generated. It captures medium and long-term trends using the dual EMA.
In addition, the Williams Indicator is used to identify reversals. The Williams Indicator determines overbought or oversold by looking at periodic highs and lows. Sell signals are generated when overbought. Buy signals are generated when oversold.
The specific logic is:
Long entry: short-term EMA crosses above medium-term EMA and long-term EMA, Williams Indicator shows oversold zone and forms lowest point indicating reversal opportunity.
Short entry: short-term EMA crosses below medium-term EMA and long-term EMA, Williams Indicator shows overbought zone and forms highest point indicating reversal opportunity.
The RSI indicator is also introduced to further confirm trading signals and avoid chasing new highs and killing declines blindly.
Advantages
The biggest advantage of this strategy is using the dual EMA to filter out invalid trends and only track the strongest medium and long-term trends. This filters out noise and reduces invalid trades.
Introducing the Williams Indicator is also very effective. Firstly, it identifies reversal opportunities to close positions in time. Secondly, it further confirms the effectiveness of trend signals.
The combination of dual EMA and Williams allows this strategy to achieve good tracking profit in medium and long-term products, while also identifying reversals and limiting losses.
Risks
The main risk lies in the difficulty of identifying trend reversal points. Although Williams Indicator and RSI Indicator ensure effectiveness of reversal trades, the difficulty is still high and the risk of chasing new highs and killing declines cannot be completely avoided.
In addition, the dual EMA itself has some lag. When the short-term and medium & long-term trends decouple, some identification difficulty can occur.
Optimization
This strategy can be optimized in the following ways:
-
Test more EMA cycle combos to find better parameters
-
Increase adaptive exit mechanisms based on ATR, volatility index etc to judge reversals
-
Introduce machine learning with LSTM etc to predict trends and reversals
-
Improve reversal trading rules using Elliott Wave Theory etc
-
Introduce adaptive position sizing based on market conditions
Conclusion
This strategy successfully combines dual EMA and Williams Indicator to capture medium and long-term trends and achieve higher returns during major trends. Meanwhile, introducing Williams Indicator also allows the strategy to identify reversals and cut losses in time. Next step is to further enhance stability of strategy by introducing more indicators and models for optimization.
[/trans]
Strategy Arguments
| Argument | Default | Description |
|---|---|---|
| v_input_1 | 0 | (?Appearance)theme: dark |
| v_input_2 | false | Show Fractals |
| v_input_3 | false | Show EMAs |
| v_input_4 | 2 | (?Williams Fractals)Fractal Periods |
| v_input_5 | 20 | (?EMA)EMA Length A |
| v_input_6_close | 0 | EMA Source A: close |
| v_input_7 | false | EMA Offset A |
| v_input_8 | 50 | EMA Length B |
| v_input_9_close | 0 | EMA Source B: close |
| v_input_10 | false | EMA Offset B |
| v_input_11 | 100 | EMA Length C |
| v_input_12_close | 0 | EMA Source C: close |
| v_input_13 | false | EMA Offset C |
| v_input_14 | 14 | (?RSI)RSI Length |
| v_input_15_close | 0 | RSI Source: close |
| v_input_16 | true | (?Orders)Start Date |
| v_input_17 | true | Start Month |
| v_input_18 | 2018 | Start Year |
| v_input_19 | true | End Date |
| v_input_20 | 12 | End Month |
| v_input_21 | 2022 | End Year |
| v_input_22 | 0.5 | Long Take Profit (%) |
| v_input_23 | 0.5 | Short Take Profit (%) |
| v_input_24 | 3.1 | Long Stop Loss (%) |
| v_input_25 | 3.1 | Short Stop Loss (%) |
Source (PineScript)
/*backtest
start: 2022-11-20 00:00:00
end: 2022-11-29 05:20:00
period: 1h
basePeriod: 15m
exchanges: [{"eid":"Futures_Binance","currency":"BTC_USDT"}]
*/

// This source code is subject to the terms of the Mozilla Public License 2.0 at https://mozilla.org/MPL/2.0/
// © B_L_A_C_K_S_C_O_R_P_I_O_N
// v 1.1

//@version=4
strategy("vijkirti buy sell 99%", overlay=true, default_qty_type=strategy.cash, default_qty_value=1000, currency='USD')

// *************Appearance*************
theme = input(type=input.string, defval="dark", options=["light","dark"], group="Appearance")
show_fractals = input(false, "Show Fractals", group="Appearance")
show_ema = input(false, "Show EMAs", group="Appearance")

// *************colors*************
color_green = color.green
color_red = color.red
color_yellow = color.yellow
color_orange = color.orange
color_blue = color.blue
color_white = color.white

// *************WF*************
// Define "n" as the number of periods and keep a minimum value of 2 for error handling.
n = input(title="Fractal Periods", defval=2, minval=2, type=input.integer, group="Williams Fractals")

// UpFractal
bool upflagDownFrontier = true
bool upflagUpFrontier0 = true
bool upflagUpFrontier1 = true
bool upflagUpFrontier2 = true
bool upflagUpFrontier3 = true
bool upflagUpFrontier4 = true

for i = 1 to n
    upflagDownFrontier := upflagDownFrontier and (high[n-i] < high[n])
    upflagUpFrontier0 := upflagUpFrontier0 and (high[n+i] < high[n])
    upflagUpFrontier1 := upflagUpFrontier1 and (high[n+1] <= high[n] and high[n+i + 1] < high[n])
    upflagUpFrontier2 := upflagUpFrontier2 and (high[n+1] <= high[n] and high[n+2] <= high[n] and high[n+i + 2] < high[n])
    upflagUpFrontier3 := upflagUpFrontier3 and (high[n+1] <= high[n] and high[n+2] <= high[n] and high[n+3] <= high[n] and high[n+i + 3] < high[n])
    upflagUpFrontier4 := upflagUpFrontier4 and (high[n+1] <= high[n] and high[n+2] <= high[n] and high[n+3] <= high[n] and high[n+4] <= high[n] and high[n+i + 4] < high[n])
flagUpFrontier = upflagUpFrontier0 or upflagUpFrontier1 or upflagUpFrontier2 or upflagUpFrontier3 or upflagUpFrontier4

upFractal = (upflagDownFrontier and flagUpFrontier)

// downFractal
bool downflagDownFrontier = true
bool downflagUpFrontier0 = true
bool downflagUpFrontier1 = true
bool downflagUpFrontier2 = true
bool downflagUpFrontier3 = true
bool downflagUpFrontier4 = true

for i = 1 to n
    downflagDownFrontier := downflagDownFrontier and (low[n-i] > low[n])
    downflagUpFrontier0 := downflagUpFrontier0 and (low[n+i] > low[n])
    downflagUpFrontier1 := downflagUpFrontier1 and (low[n+1] >= low[n] and low[n+i + 1] > low[n])
    downflagUpFrontier2 := downflagUpFrontier2 and (low[n+1] >= low[n] and low[n+2] >= low[n] and low[n+i + 2] > low[n])
    downflagUpFrontier3 := downflagUpFrontier3 and (low[n+1] >= low[n] and low[n+2] >= low[n] and low[n+3] >= low[n] and low[n+i + 3] > low[n])
    downflagUpFrontier4 := downflagUpFrontier4 and (low[n+1] >= low[n] and low[n+2] >= low[n] and low[n+3] >= low[n] and low[n+4] >= low[n] and low[n+i + 4] > low[n])
flagDownFrontier = downflagUpFrontier0 or downflagUpFrontier1 or downflagUpFrontier2 or downflagUpFrontier3 or downflagUpFrontier4

downFractal = (downflagDownFrontier and flagDownFrontier)

plotshape(downFractal and show_fractals, style=shape.triangleup, location=location.belowbar, offset=-n, color=color_green)
plotshape(upFractal and show_fractals, style=shape.triangledown, location=location.abovebar, offset=-n, color=color_red)

// *************EMA*************
len_a = input(20, minval=1, title="EMA Length A", group="EMA")
src_a = input(close, title="EMA Source A", group="EMA")
offset_a = input(title="EMA Offset A", type=input.integer, defval=0, minval=-500, maxval=500, group="EMA")
out_a = ema(src_a, len_a)
plot(show_ema ? out_a : na, title="EMA A", color=color_green, offset=offset_a)

len_b = input(50, minval=1, title="EMA Length B", group="EMA")
src_b = input(close, title="EMA Source B", group="EMA")
offset_b = input(title="EMA Offset B", type=input.integer, defval=0, minval=-500, maxval=500, group="EMA")
out_b = ema(src_b, len_b)
ema_b_color = (theme == "dark") ? color_yellow : color_orange
plot(show_ema ? out_b : na, title="EMA B", color=ema_b_color, offset=offset_b)

len_c = input(100, minval=1, title="EMA Length C", group="EMA")
src_c = input(close, title="EMA Source C", group="EMA")
offset_c = input(title="EMA Offset C", type=input.integer, defval=0, minval=-500, maxval=500, group="EMA")
out_c = ema(src_c, len_c)
ema_c_color = (theme == "dark") ? color_white : color_blue
plot(show_ema ? out_c : na, title="EMA C", color=ema_c_color, offset=offset_c)

// *************RSI*************
rsi_len = input(14, minval=1, title="RSI Length", group="RSI")
rsi_src = input(close, "RSI Source", type = input.source, group="RSI")
up = rma(max(change(rsi_src), 0), rsi_len)
down = rma(-min(change(rsi_src), 0), rsi_len)
rsi = down == 0 ? 100 : up == 0 ? 0 : 100 - (100 / (1 + up / down))

// *************Calculation*************
long = (out_a > out_b) and (out_a > out_c) and downFractal and low[2] > out_c and rsi[2] < rsi
short = (out_a < out_b) and (out_a < out_c) and upFractal and high[2] < out_c and rsi[2] > rsi

plotshape(long, style=shape.labelup, color=color_green, location=location.belowbar, title="long label", text= "L", textcolor=color_white)
plotshape(short, style=shape.labeldown, color=color_red, location=location.abovebar, title="short label", text= "S", textcolor=color_white)

// *************End of Signals calculation*************

// Make input options that configure backtest date range
startDate = input(title="Start Date", type=input.integer,
     defval=1, minval=1, maxval=31, group="Orders")
startMonth = input(title="Start Month", type=input.integer,
     defval=1, minval=1, maxval=12, group="Orders")
startYear = input(title="Start Year", type=input.integer,
     defval=2018, minval=1800, maxval=2100, group="Orders")

endDate = input(title="End Date", type=input.integer,
     defval=1, minval=1, maxval=31, group="Orders")
endMonth = input(title="End Month", type=input.integer,
     defval=12, minval=1, maxval=12, group="Orders")
endYear = input(title="End Year", type=input.integer,
     defval=2022, minval=1800, maxval=2100, group="Orders")

// Look if the close time of the current bar
// falls inside the date range
inDateRange = (time >= timestamp(syminfo.timezone, startYear,
         startMonth, startDate, 0, 0)) and
     (time < timestamp(syminfo.timezone, endYear, endMonth, endDate, 0, 0))

// Make inputs that set the take profit % (optional)
longProfitPerc = input(title="Long Take Profit (%)",
     type=input.float, minval=0.0, step=0.1, defval=0.5, group="Orders") * 0.01

shortProfitPerc = input(title="Short Take Profit (%)",
     type=input.float, minval=0.0, step=0.1, defval=0.5, group="Orders") * 0.01

// Figure out take profit price
longExitPrice  = strategy.position_avg_price * (1 + longProfitPerc)
shortExitPrice = strategy.position_avg_price * (1 - shortProfitPerc)

// Plot take profit values for confirmation
plot(series=(strategy.position_size > 0) ? longExitPrice : na,
     color=color_green, style=plot.style_circles,
     linewidth=1, title="Long Take Profit")
plot(series=(strategy.position_size < 0) ? shortExitPrice : na,
     color=color_green, style=plot.style_circles,
     linewidth=1, title="Short Take Profit")

// Submit entry orders
if (inDateRange and long and strategy.opentrades == 0)
    strategy.entry(id="Long", long=true)

if (inDateRange and short and strategy.opentrades == 0)
    strategy.entry(id="Short", long=false)

// Set stop loss level with input options (optional)
longLossPerc = input(title="Long Stop Loss (%)",
     type=input.float, minval=0.0, step=0.1, defval=3.1, group="Orders") * 0.01

shortLossPerc = input(title="Short Stop Loss (%)",
     type=input.float, minval=0.0, step=0.1, defval=3.1, group="Orders") * 0.01

// Determine stop loss price
longStopPrice  = strategy.position_avg_price * (1 - longLossPerc)
shortStopPrice = strategy.position_avg_price * (1 + shortLossPerc)

// Plot stop loss values for confirmation
plot(series=(strategy.position_size > 0) ? longStopPrice : na,
     color=color_red, style=plot.style_cross,
     linewidth=1, title="Long Stop Loss")
plot(series=(strategy.position_size < 0) ? shortStopPrice : na,
     color=color_red, style=plot.style_cross,
     linewidth=1, title="Short Stop Loss")

// Submit exit orders based on calculated stop loss price
if (strategy.position_size > 0)
    strategy.exit(id="ExL",limit=longExitPrice, stop=longStopPrice)

if (strategy.position_size < 0)
    strategy.exit(id="ExS", limit=shortExitPrice, stop=shortStopPrice)

// Exit open market position when date range ends
if (not inDateRange)
    strategy.close_all()
Detail
https://www.fmz.com/strategy/432792
Last Modified
2023-11-21 15:16:21