
238 lines
12 KiB
Markdown
238 lines
12 KiB
Markdown
|
|
> Name
|
|
|
|
超趋势吞噬弹策略SuperTrend-Engulfing-Strategy
|
|
|
|
> Author
|
|
|
|
ChaoZhang
|
|
|
|
> Strategy Description
|
|
|
|
|
|
[trans]
|
|
|
|
### 概述
|
|
|
|
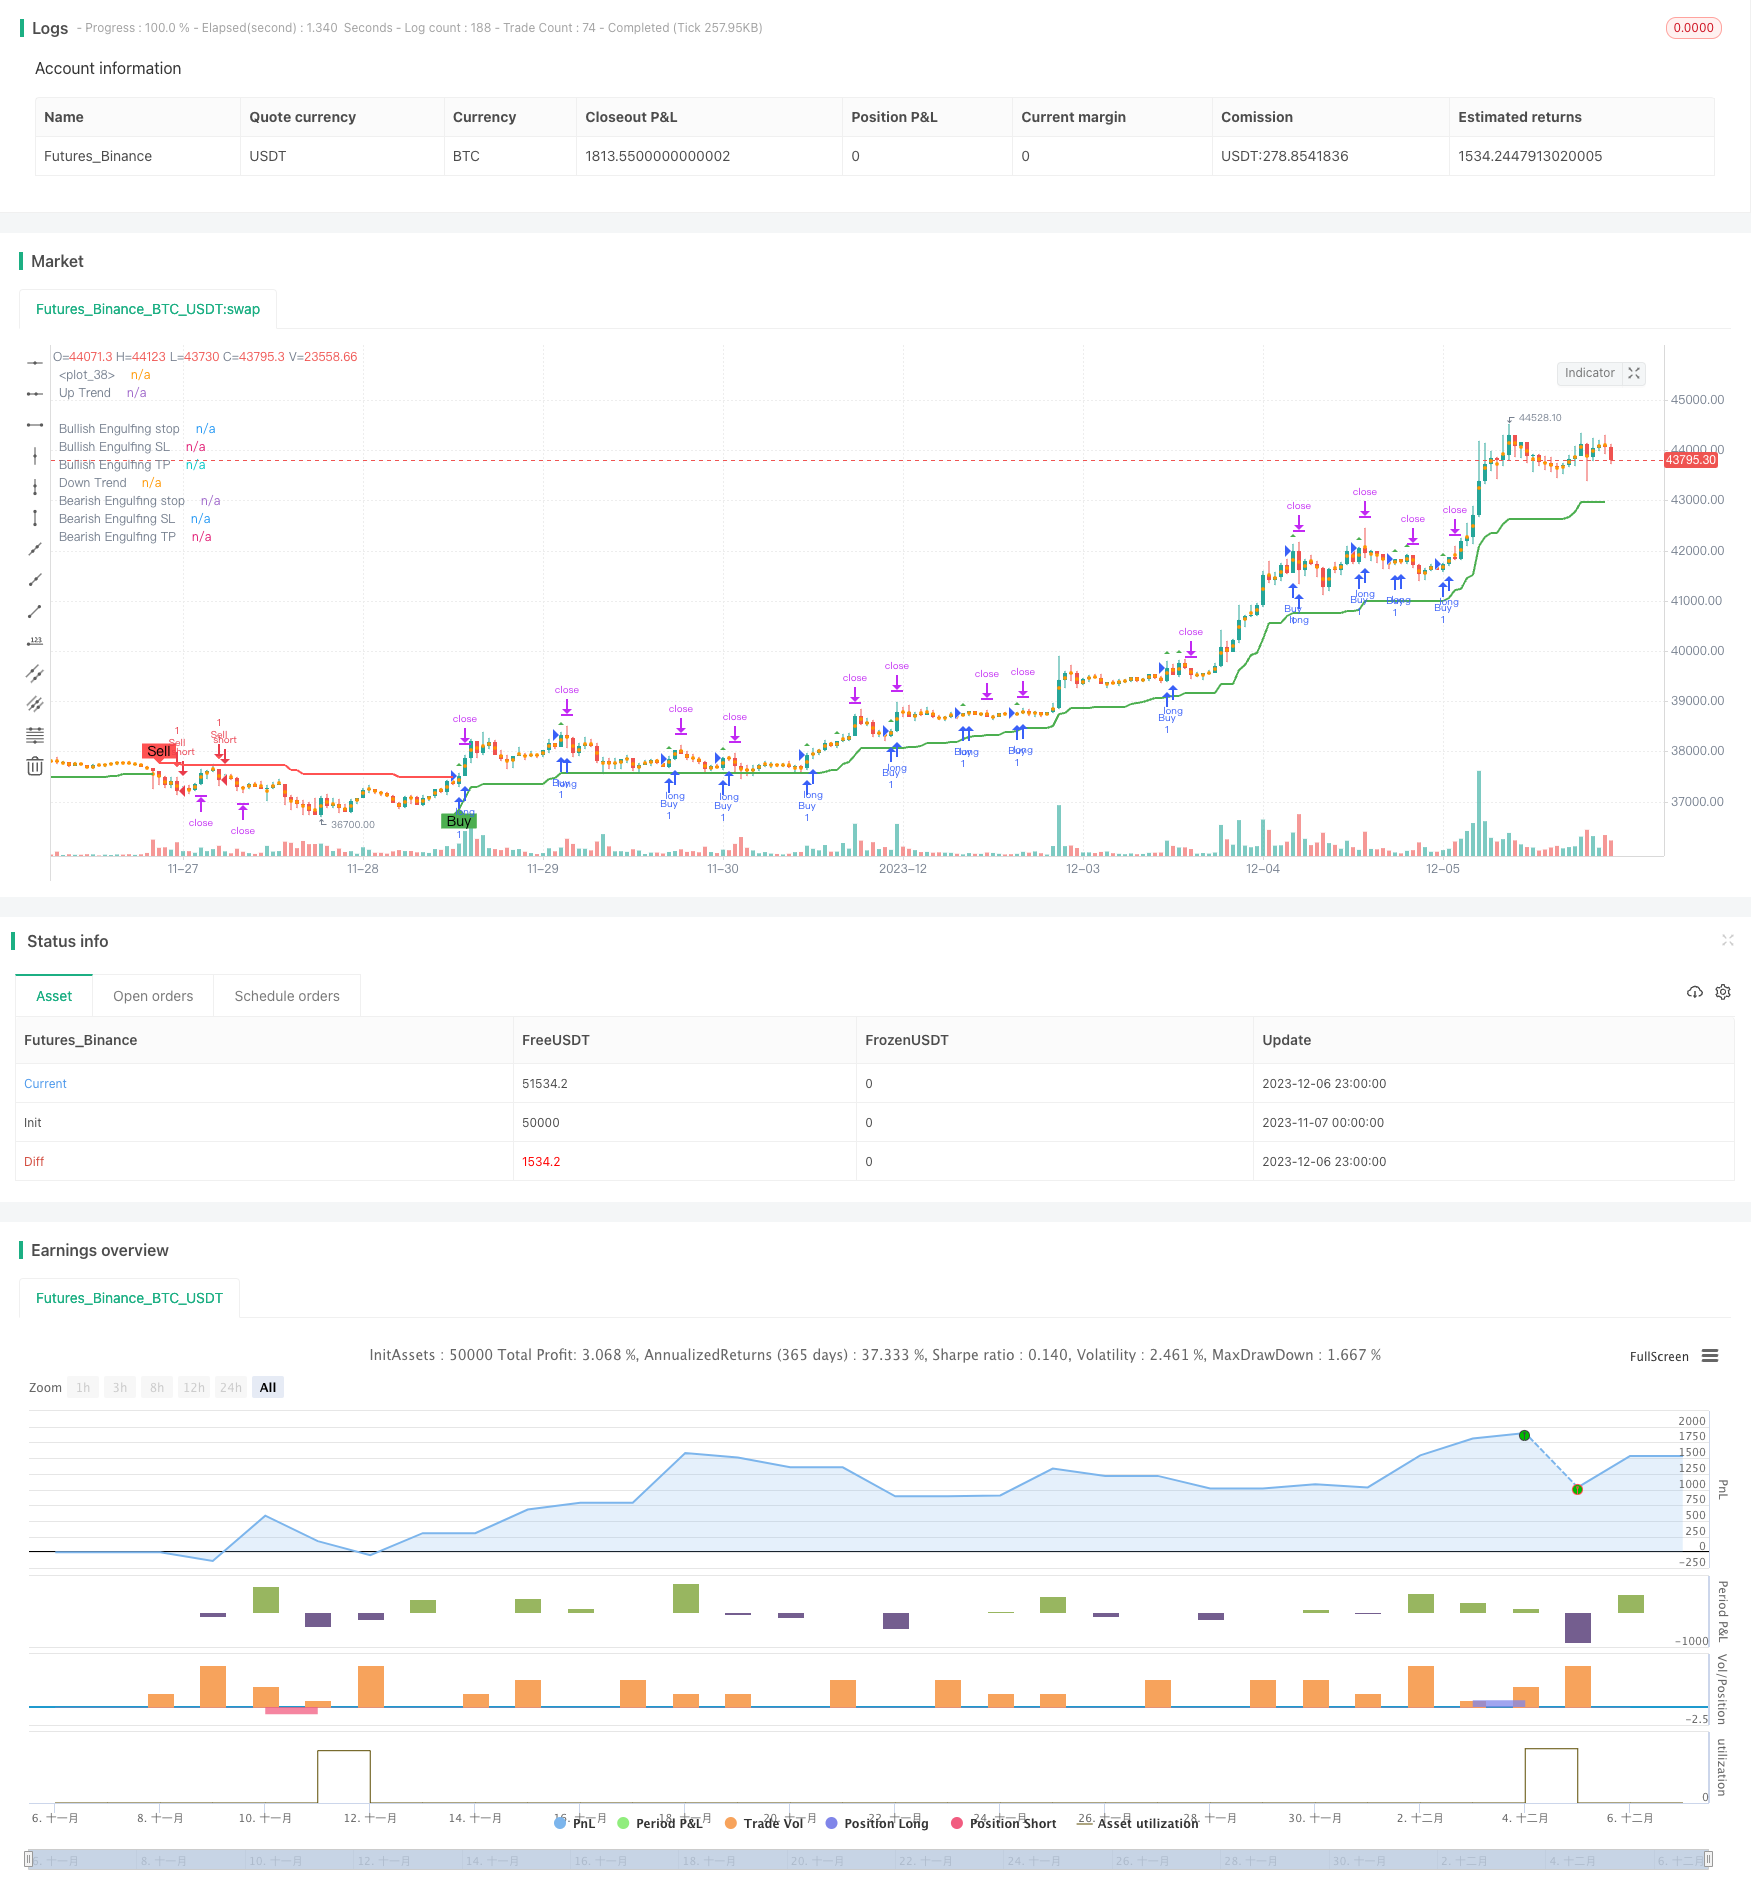
超趋势吞噬弹策略是一种趋势跟踪策略,它结合了平均真实波幅(ATR)、超趋势指标和吞噬形态来识别趋势方向,并在吞噬形态确认趋势的同时寻找具有优惠比率的入场机会。
|
|
|
|
### 策略原理
|
|
|
|
该策略首先利用ATR和超趋势指标判断CURRENT市场趋势方向。具体来说,当价格低于上轨时定义为下跌趋势,当价格高于下轨时定义为上升趋势。
|
|
|
|
在确认趋势方向的同时,策略还会判断K线是否形成吞噬形态。根据代码逻辑,在上升趋势中,前一根K线收盘价高于当前K线开盘价而当前K线收盘价又低于开盘价的情形会触发多头吞噬;在下跌趋势中,前一根K线收盘价低于当前K线开盘价而当前K线收盘价又高于开盘价的情形会触发空头吞噬。
|
|
|
|
当吞噬形态与趋势方向一致时,即会产生交易信号。此外,策略还会基于吞噬形态计算止损价位和止盈价位。进场后,如果价格触及止损或止盈价位,则会退出当前头寸。
|
|
|
|
### 优势分析
|
|
|
|
该策略结合趋势跟踪和形态识别的优点,可以在趋势行情中识别反转信号,从而在市场转折点捕捉较大行情。此外,止损机制也能有效控制亏损风险。
|
|
|
|
### 风险分析
|
|
|
|
该策略最大的风险在于吞噬形态可能是假破,从而产生错误信号。此外,止损和止盈设置也可能过于武断,无法实现盈亏平衡。建议优化参数组合并适当调整止损止盈位置。
|
|
|
|
### 优化方向
|
|
|
|
可以考虑实时优化ATR的参数以便更好地捕捉市场波动率的变化。此外,也可以研究其他指标识别趋势,进一步提高策略的稳定性。从止损止盈方面考虑,动态追踪也是一个可行的优化思路。
|
|
|
|
### 总结
|
|
|
|
超趋势吞噬弹策略整合趋势跟踪和形态识别的优势,对吞噬形态作为反转信号进行策略,可在市场转折点获得较高效益。但该策略也存在一定的假信号风险,需要进一步测试和优化以控制风险。
|
|
|
|
||
|
|
|
|
### Overview
|
|
|
|
The SuperTrend Engulfing strategy is a trend following strategy that combines Average True Range (ATR), SuperTrend indicator and engulfing patterns to identify trend direction and find good risk-reward ratio entry opportunities when engulfing patterns confirm the trend.
|
|
|
|
### Strategy Logic
|
|
|
|
The strategy first uses ATR and SuperTrend indicator to determine the CURRENT market trend direction. Specifically, a downtrend is defined when price is below the upper band, and an uptrend when price is above the lower band.
|
|
|
|
At the same time, the strategy also judges whether the K-line forms an engulfing pattern. According to the code logic, in an uptrend, if the previous bar's closing price is higher than the current bar's opening price, while the current bar's closing price is lower than the opening price, a bullish engulfing will be triggered. In a downtrend, if the previous bar's closing price is lower than the current bar's opening price, while the current bar's closing price is higher than the opening price, a bearish engulfing will be triggered.
|
|
|
|
When the engulfing pattern is consistent with the trend direction, a trading signal will be generated. In addition, the strategy will also calculate the stop loss and take profit levels based on the engulfing pattern. After entering the market, if the price touches the stop loss or take profit level, the current position will be exited.
|
|
|
|
### Advantage Analysis
|
|
|
|
The strategy combines the advantages of trend following and pattern recognition to identify reversal signals in trending markets, thus catching larger moves at turning points. Also, the stop loss mechanism can effectively control the risk of losses.
|
|
|
|
### Risk Analysis
|
|
|
|
The biggest risk of this strategy is that engulfing patterns may be fake breaks, thus generating wrong signals. In addition, stop loss and take profit settings could also be too arbitrary, failing to achieve balanced profits and losses. It is recommended to optimize parameter combinations and adjust stop loss and take profit levels appropriately.
|
|
|
|
### Optimization Directions
|
|
|
|
Consider optimizing ATR parameters in real time for better capturing changes in market volatility. Also, researching other indicators to identify trends can further improve the stability of the strategy. From the perspective of stop loss and take profit, dynamic trailing is also a feasible optimization direction.
|
|
|
|
### Summary
|
|
|
|
The SuperTrend Engulfing strategy integrates the advantages of trend following and pattern recognition, using engulfing patterns as reversal signals. It can obtain higher returns at market turning points. But the strategy also has certain risks of fake signals. Further testing and optimization are needed to control risks.
|
|
|
|
[/trans]
|
|
|
|
> Strategy Arguments
|
|
|
|
|
|
|
|
|Argument|Default|Description|
|
|
|----|----|----|
|
|
|v_input_int_1|10|ATR Period|
|
|
|v_input_1_hl2|0|Source: hl2|high|low|open|close|hlc3|hlcc4|ohlc4|
|
|
|v_input_float_1|3|ATR Multiplier|
|
|
|v_input_bool_1|true|Change ATR Calculation Method ?|
|
|
|v_input_bool_2|true|Show Buy/Sell Signals ?|
|
|
|v_input_bool_3|true|Highlighter On/Off ?|
|
|
|v_input_float_2|25|Boring Candle Threshold (%)|
|
|
|v_input_float_3|50|Engulfing Candle Threshold (%)|
|
|
|v_input_int_2|200|Stop Level (Pips)|
|
|
|
|
|
|
> Source (PineScript)
|
|
|
|
``` javascript
|
|
/*backtest
|
|
start: 2023-11-07 00:00:00
|
|
end: 2023-12-07 00:00:00
|
|
period: 1h
|
|
basePeriod: 15m
|
|
exchanges: [{"eid":"Futures_Binance","currency":"BTC_USDT"}]
|
|
*/
|
|
|
|
// This source code is subject to the terms of the Mozilla Public License 2.0 at https://mozilla.org/MPL/2.0/
|
|
// © Armanhammer
|
|
|
|
//@version=5
|
|
strategy("Engulfing with Trend", overlay=true)
|
|
|
|
Periods = input.int(title="ATR Period", defval=10)
|
|
src = input(hl2, title="Source")
|
|
Multiplier = input.float(title="ATR Multiplier", step=0.1, defval=3.0)
|
|
changeATR= input.bool(title="Change ATR Calculation Method ?", defval=true)
|
|
showsignals = input.bool(title="Show Buy/Sell Signals ?", defval=true)
|
|
highlighting = input.bool(title="Highlighter On/Off ?", defval=true)
|
|
|
|
atr2 = ta.sma(src, Periods)
|
|
atr= changeATR ? ta.atr(Periods) : atr2
|
|
|
|
up=src-(Multiplier*atr)
|
|
up1 = nz(up[1],up)
|
|
up := close[1] > up1 ? math.max(up,up1) : up
|
|
dn=src+(Multiplier*atr)
|
|
dn1 = nz(dn[1], dn)
|
|
dn := close[1] < dn1 ? math.min(dn, dn1) : dn
|
|
|
|
var trend = 1
|
|
trend := nz(trend[1], trend)
|
|
trend := trend == -1 and close > dn1 ? 1 : trend == 1 and close < up1 ? -1 : trend
|
|
|
|
upPlot = plot(trend == 1 ? up : na, title="Up Trend", style=plot.style_linebr, linewidth=2, color=color.green)
|
|
buySignal = trend == 1 and trend[1] == -1
|
|
plotshape(buySignal and showsignals ? up : na, title="Buy", style=shape.labelup, location=location.absolute, color=color.new(color.green, 0), text="Buy")
|
|
//plotshape(buySignal ? up : na, title="UpTrend Begins", location=location.absolute, style=shape.circle, size=size.tiny, color=color.green, transp=0)
|
|
//plotshape(buySignal and showsignals ? up : na, title="Buy", text="Buy", location=location.absolute, style=shape.labelup, size=size.tiny, color=color.green, textcolor=color.white, transp=0)
|
|
dnPlot = plot(trend == 1 ? na : dn, title="Down Trend", style=plot.style_linebr, linewidth=2, color=color.red)
|
|
sellSignal = trend == -1 and trend[1] == 1
|
|
plotshape(sellSignal and showsignals ? dn : na, title="Sell", style=shape.labeldown, location=location.absolute, color=color.new(color.red, 0), text="Sell")
|
|
//plotshape(sellSignal ? dn : na, title="DownTrend Begins", location=location.absolute, style=shape.circle, size=size.tiny, color=color.red, transp=0)
|
|
//plotshape(sellSignal and showsignals ? dn : na, title="Sell", text="Sell", location=location.absolute, style=shape.labeldown, size=size.tiny, color=color.red, textcolor=color.white, transp=0)
|
|
mPlot = plot(ohlc4, title="", style=plot.style_circles, linewidth=0)
|
|
longFillColor = highlighting and trend == 1 ? color.new(color.green, 0) : na
|
|
shortFillColor = highlighting and trend == -1 ? color.new(color.red, 0) : na
|
|
fill(upPlot, dnPlot, color=longFillColor)
|
|
fill(dnPlot, upPlot, color=shortFillColor)
|
|
alertcondition(buySignal, title="SuperTrend Buy", message="SuperTrend Buy!")
|
|
alertcondition(sellSignal, title="SuperTrend Sell", message="SuperTrend Sell!")
|
|
changeCond = trend != trend[1]
|
|
alertcondition(changeCond, title="SuperTrend Direction Change", message="SuperTrend has changed direction!")
|
|
|
|
// Define Downtrend and Uptrend conditions
|
|
downtrend = trend == -1
|
|
uptrend = trend == 1
|
|
|
|
|
|
// Engulfing
|
|
boringThreshold = input.float(25, title="Boring Candle Threshold (%)", minval=1, maxval=100)
|
|
engulfingThreshold = input.float(50, title="Engulfing Candle Threshold (%)", minval=1, maxval=100)
|
|
stopLevel = input.int(200, title="Stop Level (Pips)", minval=1)
|
|
|
|
// Boring Candle (Inside Bar) and Engulfing Candlestick Conditions
|
|
isBoringCandle = math.abs(open[1] - close[1]) * 100 / math.abs(high[1] - low[1]) <= boringThreshold
|
|
isEngulfingCandle = math.abs(open - close) * 100 / math.abs(high - low) <= engulfingThreshold
|
|
|
|
// Bullish and Bearish Engulfing Conditions
|
|
bullEngulfing = uptrend and close[1] < open[1] and close > open[1] and not isBoringCandle and not isEngulfingCandle
|
|
bearEngulfing = downtrend and close[1] > open[1] and close < open[1] and not isBoringCandle and not isEngulfingCandle
|
|
|
|
// Stop Loss, Take Profit, and Entry Price Calculation
|
|
bullStop = close + (stopLevel * syminfo.mintick)
|
|
bearStop = close - (stopLevel * syminfo.mintick)
|
|
bullSL = low
|
|
bearSL = high
|
|
bullTP = bullStop + (bullStop - low)
|
|
bearTP = bearStop - (high - bearStop)
|
|
|
|
// Entry Conditions
|
|
enterLong = bullEngulfing and uptrend
|
|
enterShort = bearEngulfing and downtrend
|
|
|
|
// Exit Conditions
|
|
exitLong = ta.crossover(close, bullTP) or ta.crossover(close, bullSL)
|
|
exitShort = ta.crossover(close, bearTP) or ta.crossover(close, bearSL)
|
|
|
|
// Check if exit conditions are met by the next candle
|
|
exitLongNextCandle = exitLong and (ta.crossover(close[1], bullTP[1]) or ta.crossover(close[1], bullSL[1]))
|
|
exitShortNextCandle = exitShort and (ta.crossover(close[1], bearTP[1]) or ta.crossover(close[1], bearSL[1]))
|
|
|
|
// Strategy Execution
|
|
if enterLong
|
|
strategy.entry("Buy", strategy.long)
|
|
|
|
if enterShort
|
|
strategy.entry("Sell", strategy.short)
|
|
|
|
// Exit Conditions for Long (Buy) Positions
|
|
if bullEngulfing and not na(bullTP) and not na(bullSL)
|
|
strategy.exit("Exit Long", from_entry="Buy", stop=bullSL, limit=bullTP)
|
|
|
|
// Exit Conditions for Short (Sell) Positions
|
|
if bearEngulfing and not na(bearTP) and not na(bearSL)
|
|
strategy.exit("Exit Short", from_entry="Sell", stop=bearSL, limit=bearTP)
|
|
|
|
|
|
// Plot Shapes and Labels
|
|
plotshape(series=bullEngulfing, style=shape.triangleup, location=location.abovebar, color=color.green)
|
|
plotshape(series=bearEngulfing, style=shape.triangledown, location=location.abovebar, color=color.red)
|
|
|
|
// Determine OP, SL, and TP
|
|
plot(series=bullEngulfing ? bullStop : na, title="Bullish Engulfing stop", color=color.red, linewidth=3, style=plot.style_linebr)
|
|
plot(series=bearEngulfing ? bearStop : na, title="Bearish Engulfing stop", color=color.red, linewidth=3, style=plot.style_linebr)
|
|
plot(series=bullEngulfing ? bullSL : na, title="Bullish Engulfing SL", color=color.red, linewidth=3, style=plot.style_linebr)
|
|
plot(series=bearEngulfing ? bearSL : na, title="Bearish Engulfing SL", color=color.red, linewidth=3, style=plot.style_linebr)
|
|
plot(series=bullEngulfing ? bullTP : na, title="Bullish Engulfing TP", color=color.green, linewidth=3, style=plot.style_linebr)
|
|
plot(series=bearEngulfing ? bearTP : na, title="Bearish Engulfing TP", color=color.green, linewidth=3, style=plot.style_linebr)
|
|
|
|
// Create labels if the condition for bullEngulfing or bearEngulfing is met
|
|
//if bullEngulfing
|
|
// label.new(x=bar_index, y=bullSL, text="SL: " + str.tostring(bullSL), color=color.red, textcolor=color.white, style=label.style_labelup, size=size.tiny)
|
|
|
|
//if bearEngulfing
|
|
// label.new(x=bar_index, y=bearSL, text="SL: " + str.tostring(bearSL), color=color.red, textcolor=color.white, style=label.style_labeldown, size=size.tiny)
|
|
|
|
//if bullEngulfing
|
|
// label.new(x=bar_index, y=bullTP, text="TP: " + str.tostring(bullTP), color=color.green, textcolor=color.white, style=label.style_labeldown, size=size.tiny)
|
|
|
|
//if bearEngulfing
|
|
// label.new(x=bar_index, y=bearTP, text="TP: " + str.tostring(bearTP), color=color.green, textcolor=color.white, style=label.style_labelup, size=size.tiny)
|
|
|
|
```
|
|
|
|
> Detail
|
|
|
|
https://www.fmz.com/strategy/434705
|
|
|
|
> Last Modified
|
|
|
|
2023-12-08 15:40:26
|