
445 lines
27 KiB
Markdown
445 lines
27 KiB
Markdown
|
|
> Name
|
|
|
|
融合移动平均线多重交叉交易策略Multiple-Moving-Averages-Crossover-Trading-Strategy
|
|
|
|
> Author
|
|
|
|
ChaoZhang
|
|
|
|
> Strategy Description
|
|
|
|
|
|
|
|
[trans]
|
|
|
|
### 概述
|
|
|
|
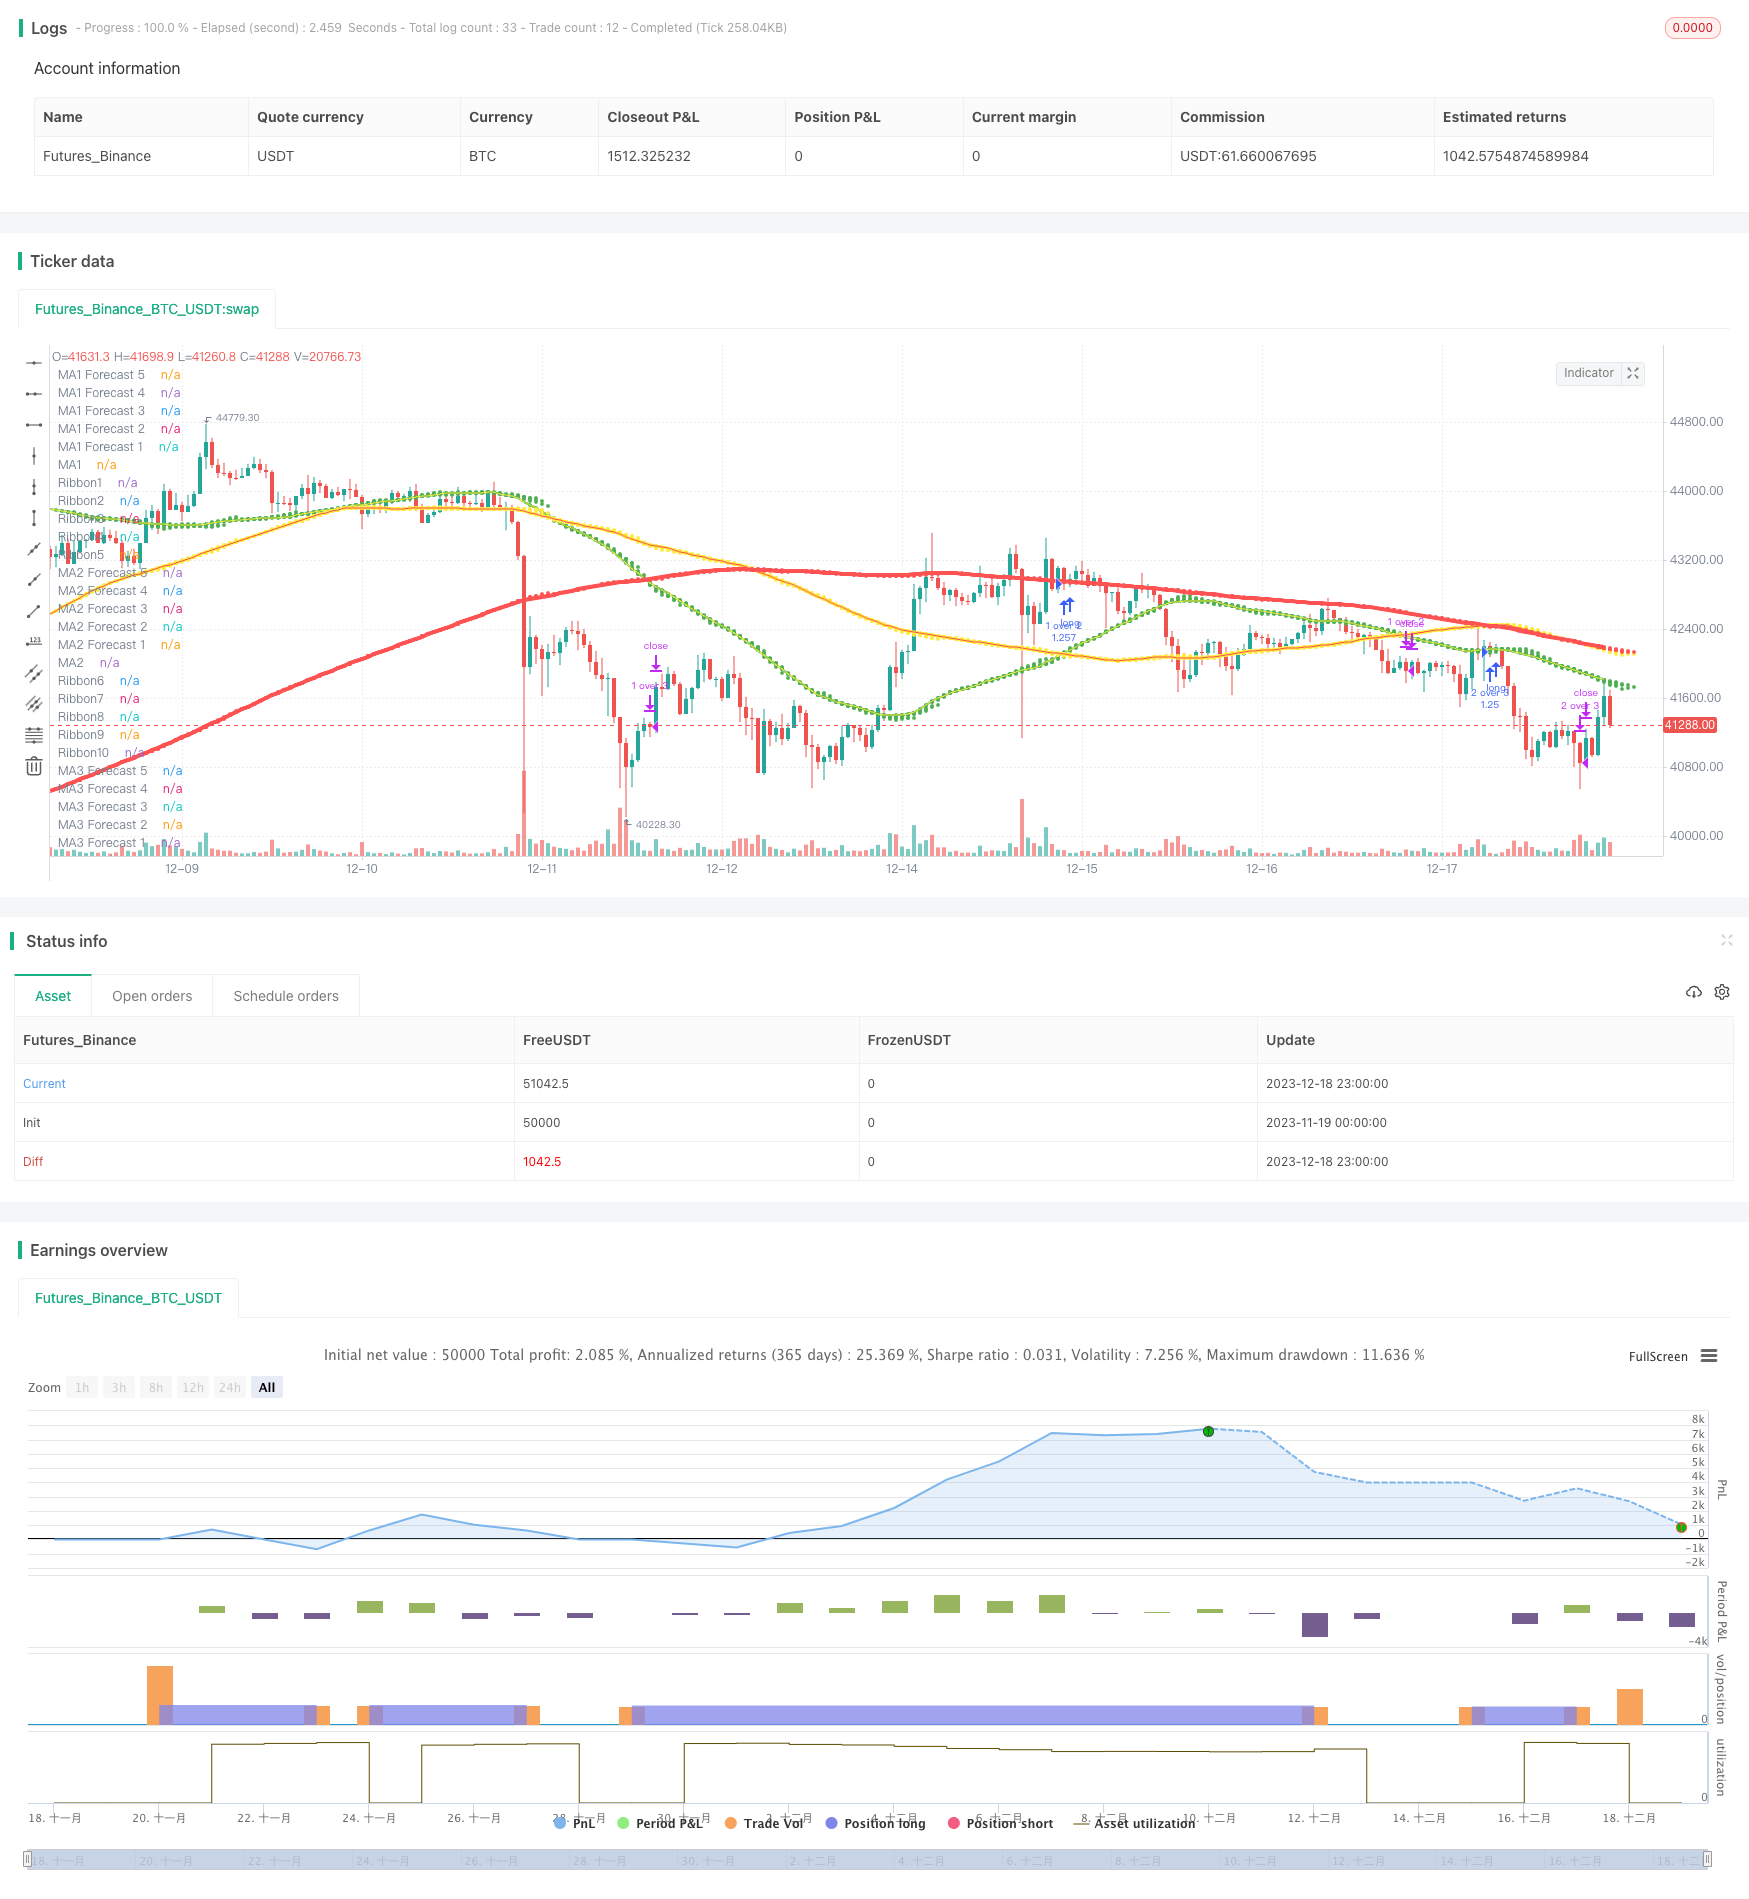
该策略是一个基于三条移动平均线(MA1、MA2、MA3)交叉的交易策略。通过设置三条移动平均线的类型、周期、价格数据源和分辨率、以及是否允许交易它们之间的交叉,可以得到灵活的交易策略组合。
|
|
|
|
### 原理
|
|
|
|
该策略主要利用三条移动平均线之间产生的交叉和抄底信号作为交易信号。当较短周期的移动平均线由下向上穿过较长周期的移动平均线时,产生长仓开仓信号;而当较短周期的移动平均线由上向下穿过较长周期的移动平均线时,产生平仓信号。
|
|
|
|
用户可以自由选择三条移动平均线的类型(SMA、EMA等)、周期、价格数据源(收盘价、最高价等)、K线分辨率(分钟线、日线等)。同时还可以选择是否开启每个移动平均线之间交叉的交易,来决定是否对某些交叉采取交易行动。
|
|
|
|
该策略目前仅做多,使用市价单开仓和平仓。每次交易投入资金为账户总权益的100%。
|
|
|
|
### 优势
|
|
|
|
1. 可以自由选择移动平均线的类型、周期等参数进行优化和组合,降低曲线拟合风险
|
|
2. 多重移动平均线交叉可以形成多个交易机会,提高交易频率
|
|
3. 同时利用长、中、短周期移动平均线,能够在趋势和反转之间平衡
|
|
4. 支持不同K线分辨率,可以进行多时间框架分析
|
|
5. 自带预测功能,可以测试参数拟合效果
|
|
|
|
### 风险
|
|
|
|
1. 大量参数组合可能导致过优化
|
|
2. 交易频率较高,可能增加交易费用和滑点成本
|
|
3. 采用市价单无法限制入场点位
|
|
4. 多重移动平均线可能出现冲突信号
|
|
5. 回测和实盘表现可能存在差异
|
|
|
|
### 优化建议
|
|
|
|
1. 利用walks forward分析得到有效的参数范围
|
|
2. 在回测中加入交易费用和滑点成本
|
|
3. 尝试限价单替代市价单
|
|
4. 增加过滤条件,避免冲突信号
|
|
5. 在模拟真实环境的回测中验证策略
|
|
|
|
|
|
### 总结
|
|
|
|
该策略综合运用了移动平均线的平滑特性和交叉信号的模式识别能力。用户可以灵活地选择参数,在趋势跟随和反转识别之间进行平衡。同时也需要注意控制过优化风险,在模拟真实环境的复杂市场中验证策略健壮性。总的来说,该策略提供了一种运用多重移动平均线进行交易的有效范例。
|
|
|
|
||
|
|
|
|
|
|
Overview
|
|
This strategy is based on the crossover of three moving average lines (MA1, MA2, MA3). By setting the type, period, price data source, resolution of the three MAs, as well as enabling trading on their crosses, flexible trading strategy combinations can be obtained.
|
|
|
|
Principle
|
|
The strategy mainly utilizes the crossover and undercross signals between the three moving average lines as trading signals. When the shorter period MA crosses over the longer period MA from bottom to top, it generates a long entry signal; when the shorter period MA crosses under the longer period MA from top to bottom, it generates an exit signal.
|
|
|
|
Users can freely choose the type (SMA, EMA, etc), period, price data source (close price, highest price, etc) and resolution (minute bars, daily bars, etc) of the three MAs. Also, trading on the crosses between each MA can be enabled or disabled to determine whether to take trading actions on certain crosses.
|
|
|
|
Currently the strategy only goes long, entering and exiting positions with market orders. By default each trade utilizes 100% of total account equity.
|
|
|
|
Advantages
|
|
|
|
1. Flexible optimization and combination by freely choosing parameters of MAs, lowering curve fitting risk
|
|
2. Multiple MA crosses generate more trading opportunities, increasing trading frequency
|
|
3. Utilizing long, medium and short term MAs balances between trend following and reversal
|
|
4. Support for different resolutions allows for multi timeframe analysis
|
|
5. Built-in forecast functionality enables test of parameters fitting effect
|
|
|
|
Risks
|
|
|
|
1. Large amount of parameter combinations may lead to overfitting
|
|
2. High trading frequency may increase costs of trading fees and slippage
|
|
3. Market orders unable to limit entry price
|
|
4. Conflicting signals may occur with multiple MAs
|
|
5. Performance difference may exist between backtest and live trading
|
|
|
|
Optimization Suggestions
|
|
|
|
1. Obtain valid parameter range through walks forward analysis
|
|
2. Add trading fees and slippage costs in backtest
|
|
3. Try limit orders instead of market orders
|
|
4. Add filters to avoid conflicting signals
|
|
5. Validate strategy robustness in simulated realistic environment
|
|
|
|
|
|
Summary
|
|
The strategy comprehensively leverages the smoothing trait of MAs and pattern recognition power of crossover signals. Users can flexibly choose parameters to balance between trend following and reversal identification. Also the risk of overfitting should be controlled by validating strategy robustness under complex market conditions simulated in backtest. In conclusion, this strategy provides an effective example of utilizing multiple MAs for trading.
|
|
|
|
[/trans]
|
|
|
|
> Strategy Arguments
|
|
|
|
|
|
|
|
|Argument|Default|Description|
|
|
|----|----|----|
|
|
|v_input_1|50|MA1 Period|
|
|
|v_input_2|0|MA1 Type: SMA|RMA|EMA|WMA|HMA|DEMA|TEMA|VWMA|
|
|
|v_input_3_close|0|MA1 Source: close|high|low|open|hl2|hlc3|hlcc4|ohlc4|
|
|
|v_input_4|0|MA1 Resolution: 00 Current|01 1m|02 3m|03 5m|04 15m|05 30m|06 45m|07 1h|08 2h|09 3h|10 4h|11 1D|12 1W|13 1M|
|
|
|v_input_5|true|MA1 Visible|
|
|
|v_input_6|100|MA2 Period|
|
|
|v_input_7|0|MA2 Type: SMA|RMA|EMA|WMA|HMA|DEMA|TEMA|VWMA|
|
|
|v_input_8_close|0|MA2 Source: close|high|low|open|hl2|hlc3|hlcc4|ohlc4|
|
|
|v_input_9|0|MA2 Resolution: 00 Current|01 1m|02 3m|03 5m|04 15m|05 30m|06 45m|07 1h|08 2h|09 3h|10 4h|11 1D|12 1W|13 1M|
|
|
|v_input_10|true|MA2 Visible|
|
|
|v_input_11|200|MA3 Period|
|
|
|v_input_12|0|MA3 Type: SMA|RMA|EMA|WMA|HMA|DEMA|TEMA|VWMA|
|
|
|v_input_13_close|0|MA3 Source: close|high|low|open|hl2|hlc3|hlcc4|ohlc4|
|
|
|v_input_14|0|MA3 Resolution: 00 Current|01 1m|02 3m|03 5m|04 15m|05 30m|06 45m|07 1h|08 2h|09 3h|10 4h|11 1D|12 1W|13 1M|
|
|
|v_input_15|true|MA3 Visible|
|
|
|v_input_16|false|Show Crosses|
|
|
|v_input_17|0|Forecast Bias: Neutral|Bullish|Bearish|
|
|
|v_input_18|14|Forecast Bias Period|
|
|
|v_input_19|true|Forecast Bias Magnitude|
|
|
|v_input_20|true|Show Forecasts|
|
|
|v_input_21|true|Show Ribbons|
|
|
|v_input_22|true|Trade MA 1-2 Crosses|
|
|
|v_input_23|true|Trade MA 1-3 Crosses|
|
|
|v_input_24|true|Trade MA 2-3 Crosses|
|
|
|
|
|
|
> Source (PineScript)
|
|
|
|
``` javascript
|
|
/*backtest
|
|
start: 2023-11-19 00:00:00
|
|
end: 2023-12-19 00:00:00
|
|
period: 1h
|
|
basePeriod: 15m
|
|
exchanges: [{"eid":"Futures_Binance","currency":"BTC_USDT"}]
|
|
*/
|
|
|
|
//@version=4
|
|
|
|
//
|
|
// Pine Script v4
|
|
// @author BigBitsIO
|
|
// Script Library: https://www.tradingview.com/u/BigBitsIO/#published-scripts
|
|
//
|
|
|
|
// study(title, shorttitle, overlay, format, precision)
|
|
// https://www.tradingview.com/pine-script-reference/#fun_strategy
|
|
strategy(shorttitle = "TManyMA Strategy - ST9 - Long Market Only", title="Triple Many Moving Averages", overlay=true, pyramiding=1, default_qty_type=strategy.percent_of_equity, default_qty_value=100)
|
|
|
|
// MA#Period is a variable used to store the indicator lookback period. In this case, from the input.
|
|
// input - https://www.tradingview.com/pine-script-docs/en/v4/annotations/Script_inputs.html
|
|
MA1Period = input(50, title="MA1 Period", minval=1, step=1)
|
|
MA1Type = input(title="MA1 Type", defval="SMA", options=["RMA", "SMA", "EMA", "WMA", "HMA", "DEMA", "TEMA", "VWMA"])
|
|
MA1Source = input(title="MA1 Source", type=input.source, defval=close)
|
|
MA1Resolution = input(title="MA1 Resolution", defval="00 Current", options=["00 Current", "01 1m", "02 3m", "03 5m", "04 15m", "05 30m", "06 45m", "07 1h", "08 2h", "09 3h", "10 4h", "11 1D", "12 1W", "13 1M"])
|
|
MA1Visible = input(title="MA1 Visible", type=input.bool, defval=true) // Will automatically hide crossBovers containing this MA
|
|
|
|
MA2Period = input(100, title="MA2 Period", minval=1, step=1)
|
|
MA2Type = input(title="MA2 Type", defval="SMA", options=["RMA", "SMA", "EMA", "WMA", "HMA", "DEMA", "TEMA", "VWMA"])
|
|
MA2Source = input(title="MA2 Source", type=input.source, defval=close)
|
|
MA2Resolution = input(title="MA2 Resolution", defval="00 Current", options=["00 Current", "01 1m", "02 3m", "03 5m", "04 15m", "05 30m", "06 45m", "07 1h", "08 2h", "09 3h", "10 4h", "11 1D", "12 1W", "13 1M"])
|
|
MA2Visible = input(title="MA2 Visible", type=input.bool, defval=true) // Will automatically hide crossovers containing this MA
|
|
|
|
MA3Period = input(200, title="MA3 Period", minval=1, step=1)
|
|
MA3Type = input(title="MA3 Type", defval="SMA", options=["RMA", "SMA", "EMA", "WMA", "HMA", "DEMA", "TEMA", "VWMA"])
|
|
MA3Source = input(title="MA3 Source", type=input.source, defval=close)
|
|
MA3Resolution = input(title="MA3 Resolution", defval="00 Current", options=["00 Current", "01 1m", "02 3m", "03 5m", "04 15m", "05 30m", "06 45m", "07 1h", "08 2h", "09 3h", "10 4h", "11 1D", "12 1W", "13 1M"])
|
|
MA3Visible = input(title="MA3 Visible", type=input.bool, defval=true) // Will automatically hide crossovers containing this MA
|
|
|
|
ShowCrosses = input(title="Show Crosses", type=input.bool, defval=false)
|
|
|
|
ForecastBias = input(title="Forecast Bias", defval="Neutral", options=["Neutral", "Bullish", "Bearish"])
|
|
ForecastBiasPeriod = input(14, title="Forecast Bias Period")
|
|
ForecastBiasMagnitude = input(1, title="Forecast Bias Magnitude", minval=0.25, maxval=20, step=0.25)
|
|
ShowForecasts = input(title="Show Forecasts", type=input.bool, defval=true)
|
|
|
|
ShowRibbons = input(title="Show Ribbons", type=input.bool, defval=true)
|
|
|
|
TradeMA12Crosses = input(title="Trade MA 1-2 Crosses", type=input.bool, defval=true)
|
|
TradeMA13Crosses = input(title="Trade MA 1-3 Crosses", type=input.bool, defval=true)
|
|
TradeMA23Crosses = input(title="Trade MA 2-3 Crosses", type=input.bool, defval=true)
|
|
|
|
|
|
// MA# is a variable used to store the actual moving average value.
|
|
// if statements - https://www.tradingview.com/pine-script-reference/#op_if
|
|
// MA functions - https://www.tradingview.com/pine-script-reference/ (must search for appropriate MA)
|
|
// custom functions in pine - https://www.tradingview.com/wiki/Declaring_Functions
|
|
ma(MAType, MASource, MAPeriod) =>
|
|
if MAType == "SMA"
|
|
ta.sma(MASource, MAPeriod)
|
|
else
|
|
if MAType == "EMA"
|
|
ta.ema(MASource, MAPeriod)
|
|
else
|
|
if MAType == "WMA"
|
|
ta.wma(MASource, MAPeriod)
|
|
else
|
|
if MAType == "RMA"
|
|
ta.rma(MASource, MAPeriod)
|
|
else
|
|
if MAType == "HMA"
|
|
ta.wma(2*wma(MASource, MAPeriod/2)-ta.wma(MASource, MAPeriod), round(sqrt(MAPeriod)))
|
|
else
|
|
if MAType == "DEMA"
|
|
e = ta.ema(MASource, MAPeriod)
|
|
2 * e - ta.ema(e, MAPeriod)
|
|
else
|
|
if MAType == "TEMA"
|
|
e = ta.ema(MASource, MAPeriod)
|
|
3 * (e - ta.ema(e, MAPeriod)) + ta.ema(ema(e, MAPeriod), MAPeriod)
|
|
else
|
|
if MAType == "VWMA"
|
|
ta.vwma(MASource, MAPeriod)
|
|
|
|
res(MAResolution) =>
|
|
if MAResolution == "00 Current"
|
|
timeframe.period
|
|
else
|
|
if MAResolution == "01 1m"
|
|
"1"
|
|
else
|
|
if MAResolution == "02 3m"
|
|
"3"
|
|
else
|
|
if MAResolution == "03 5m"
|
|
"5"
|
|
else
|
|
if MAResolution == "04 15m"
|
|
"15"
|
|
else
|
|
if MAResolution == "05 30m"
|
|
"30"
|
|
else
|
|
if MAResolution == "06 45m"
|
|
"45"
|
|
else
|
|
if MAResolution == "07 1h"
|
|
"60"
|
|
else
|
|
if MAResolution == "08 2h"
|
|
"120"
|
|
else
|
|
if MAResolution == "09 3h"
|
|
"180"
|
|
else
|
|
if MAResolution == "10 4h"
|
|
"240"
|
|
else
|
|
if MAResolution == "11 1D"
|
|
"1D"
|
|
else
|
|
if MAResolution == "12 1W"
|
|
"1W"
|
|
else
|
|
if MAResolution == "13 1M"
|
|
"1M"
|
|
|
|
// https://www.tradingview.com/pine-script-reference/#fun_request.security
|
|
MA1 = request.security(syminfo.tickerid, res(MA1Resolution), ma(MA1Type, MA1Source, MA1Period))
|
|
MA2 = request.security(syminfo.tickerid, res(MA2Resolution), ma(MA2Type, MA2Source, MA2Period))
|
|
MA3 = request.security(syminfo.tickerid, res(MA3Resolution), ma(MA3Type, MA3Source, MA3Period))
|
|
|
|
// Plotting crossover/unders for all combinations of crosses
|
|
// Crossovers no longer detected in label code, they need to be re-used for strategy - crosses and visibility must be set
|
|
MA12Crossover = MA1Visible and MA2Visible and ta.crossover(MA1, MA2)
|
|
MA12Crossunder = MA1Visible and MA2Visible and ta.crossunder(MA1, MA2)
|
|
MA13Crossover = MA1Visible and MA3Visible and ta.crossover(MA1, MA3)
|
|
MA13Crossunder = MA1Visible and MA3Visible and ta.crossunder(MA1, MA3)
|
|
MA23Crossover = MA2Visible and MA3Visible and ta.crossover(MA2, MA3)
|
|
MA23Crossunder = MA2Visible and MA3Visible and ta.crossunder(MA2, MA3)
|
|
|
|
// https://www.tradingview.com/pine-script-reference/v4/#fun_label%7Bdot%7Dnew
|
|
if ShowCrosses and MA12Crossunder
|
|
lun1 = label.new(bar_index, na, tostring(MA1Period)+' '+MA1Type+' crossed under '+tostring(MA2Period)+' '+MA2Type,
|
|
color=color.red,
|
|
textcolor=color.red,
|
|
style=label.style_xcross, size=size.small)
|
|
label.set_y(lun1, MA1)
|
|
if ShowCrosses and MA12Crossover
|
|
lup1 = label.new(bar_index, na, tostring(MA1Period)+' '+MA1Type+' crossed over '+tostring(MA2Period)+' '+MA2Type,
|
|
color=color.green,
|
|
textcolor=color.green,
|
|
style=label.style_xcross, size=size.small)
|
|
label.set_y(lup1, MA1)
|
|
if ShowCrosses and MA13Crossunder
|
|
lun2 = label.new(bar_index, na, tostring(MA1Period)+' '+MA1Type+' crossed under '+tostring(MA3Period)+' '+MA3Type,
|
|
color=color.red,
|
|
textcolor=color.red,
|
|
style=label.style_xcross, size=size.small)
|
|
label.set_y(lun2, MA1)
|
|
if ShowCrosses and MA13Crossover
|
|
lup2 = label.new(bar_index, na, tostring(MA1Period)+' '+MA1Type+' crossed over '+tostring(MA3Period)+' '+MA3Type,
|
|
color=color.green,
|
|
textcolor=color.green,
|
|
style=label.style_xcross, size=size.small)
|
|
label.set_y(lup2, MA1)
|
|
if ShowCrosses and MA23Crossunder
|
|
lun3 = label.new(bar_index, na, tostring(MA2Period)+' '+MA2Type+' crossed under '+tostring(MA3Period)+' '+MA3Type,
|
|
color=color.red,
|
|
textcolor=color.red,
|
|
style=label.style_xcross, size=size.small)
|
|
label.set_y(lun3, MA2)
|
|
if ShowCrosses and MA23Crossover
|
|
lup3 = label.new(bar_index, na, tostring(MA2Period)+' '+MA2Type+' crossed over '+tostring(MA3Period)+' '+MA3Type,
|
|
color=color.green,
|
|
textcolor=color.green,
|
|
style=label.style_xcross, size=size.small)
|
|
label.set_y(lup3, MA2)
|
|
|
|
// plot - This will draw the information on the chart
|
|
// plot - https://www.tradingview.com/pine-script-docs/en/v4/annotations/plot_annotation.html
|
|
plot(MA1Visible ? MA1 : na, color=color.green, linewidth=2, title="MA1")
|
|
plot(MA2Visible ? MA2 : na, color=color.yellow, linewidth=3, title="MA2")
|
|
plot(MA3Visible ? MA3 : na, color=color.red, linewidth=4, title="MA3")
|
|
|
|
|
|
// Forecasting - forcasted prices are calculated using our MAType and MASource for the MAPeriod - the last X candles.
|
|
// it essentially replaces the oldest X candles, with the selected source * X candles
|
|
// Bias - We'll add an "adjustment" for each additional candle being forecasted based on ATR of the previous X candles
|
|
// custom functions in pine - https://www.tradingview.com/wiki/Declaring_Functions
|
|
bias(Bias, BiasPeriod) =>
|
|
if Bias == "Neutral"
|
|
0
|
|
else
|
|
if Bias == "Bullish"
|
|
(atr(BiasPeriod) * ForecastBiasMagnitude)
|
|
else
|
|
if Bias == "Bearish"
|
|
((atr(BiasPeriod) * ForecastBiasMagnitude) * -1) // multiplying by -1 to make it a negative, bearish bias
|
|
|
|
|
|
// Note - Can not show forecasts on different resolutions at the moment, x-axis is an issue
|
|
Bias = bias(ForecastBias, ForecastBiasPeriod) // 14 is default atr period
|
|
MA1Forecast1 = (request.security(syminfo.tickerid, res(MA1Resolution), ma(MA1Type, MA1Source, MA1Period - 1)) * (MA1Period - 1) + ((MA1Source * 1) + (Bias * 1))) / MA1Period
|
|
MA1Forecast2 = (request.security(syminfo.tickerid, res(MA1Resolution), ma(MA1Type, MA1Source, MA1Period - 2)) * (MA1Period - 2) + ((MA1Source * 2) + (Bias * 2))) / MA1Period
|
|
MA1Forecast3 = (request.security(syminfo.tickerid, res(MA1Resolution), ma(MA1Type, MA1Source, MA1Period - 3)) * (MA1Period - 3) + ((MA1Source * 3) + (Bias * 3))) / MA1Period
|
|
MA1Forecast4 = (request.security(syminfo.tickerid, res(MA1Resolution), ma(MA1Type, MA1Source, MA1Period - 4)) * (MA1Period - 4) + ((MA1Source * 4) + (Bias * 4))) / MA1Period
|
|
MA1Forecast5 = (request.security(syminfo.tickerid, res(MA1Resolution), ma(MA1Type, MA1Source, MA1Period - 5)) * (MA1Period - 5) + ((MA1Source * 5) + (Bias * 5))) / MA1Period
|
|
|
|
plot(MA1Resolution == "00 Current" and ShowForecasts and MA1Visible ? MA1Forecast1 : na, color=color.green, linewidth=1, style=plot.style_circles, title="MA1 Forecast 1", offset=1, show_last=1)
|
|
plot(MA1Resolution == "00 Current" and ShowForecasts and MA1Visible ? MA1Forecast2 : na, color=color.green, linewidth=1, style=plot.style_circles, title="MA1 Forecast 2", offset=2, show_last=1)
|
|
plot(MA1Resolution == "00 Current" and ShowForecasts and MA1Visible ? MA1Forecast3 : na, color=color.green, linewidth=1, style=plot.style_circles, title="MA1 Forecast 3", offset=3, show_last=1)
|
|
plot(MA1Resolution == "00 Current" and ShowForecasts and MA1Visible ? MA1Forecast4 : na, color=color.green, linewidth=1, style=plot.style_circles, title="MA1 Forecast 4", offset=4, show_last=1)
|
|
plot(MA1Resolution == "00 Current" and ShowForecasts and MA1Visible ? MA1Forecast5 : na, color=color.green, linewidth=1, style=plot.style_circles, title="MA1 Forecast 5", offset=5, show_last=1)
|
|
|
|
|
|
MA2Forecast1 = (request.security(syminfo.tickerid, res(MA2Resolution), ma(MA2Type, MA2Source, MA2Period - 1)) * (MA2Period - 1) + ((MA1Source * 1) + (Bias * 1))) / MA2Period
|
|
MA2Forecast2 = (request.security(syminfo.tickerid, res(MA2Resolution), ma(MA2Type, MA2Source, MA2Period - 2)) * (MA2Period - 2) + ((MA1Source * 2) + (Bias * 2))) / MA2Period
|
|
MA2Forecast3 = (request.security(syminfo.tickerid, res(MA2Resolution), ma(MA2Type, MA2Source, MA2Period - 3)) * (MA2Period - 3) + ((MA1Source * 3) + (Bias * 3))) / MA2Period
|
|
MA2Forecast4 = (request.security(syminfo.tickerid, res(MA2Resolution), ma(MA2Type, MA2Source, MA2Period - 4)) * (MA2Period - 4) + ((MA1Source * 4) + (Bias * 4))) / MA2Period
|
|
MA2Forecast5 = (request.security(syminfo.tickerid, res(MA2Resolution), ma(MA2Type, MA2Source, MA2Period - 5)) * (MA2Period - 5) + ((MA1Source * 5) + (Bias * 5))) / MA2Period
|
|
|
|
plot(MA2Resolution == "00 Current" and ShowForecasts and MA2Visible ? MA2Forecast1 : na, color=color.yellow, linewidth=1, style=plot.style_circles, title="MA2 Forecast 1", offset=1, show_last=1)
|
|
plot(MA2Resolution == "00 Current" and ShowForecasts and MA2Visible ? MA2Forecast2 : na, color=color.yellow, linewidth=1, style=plot.style_circles, title="MA2 Forecast 2", offset=2, show_last=1)
|
|
plot(MA2Resolution == "00 Current" and ShowForecasts and MA2Visible ? MA2Forecast3 : na, color=color.yellow, linewidth=1, style=plot.style_circles, title="MA2 Forecast 3", offset=3, show_last=1)
|
|
plot(MA2Resolution == "00 Current" and ShowForecasts and MA2Visible ? MA2Forecast4 : na, color=color.yellow, linewidth=1, style=plot.style_circles, title="MA2 Forecast 4", offset=4, show_last=1)
|
|
plot(MA2Resolution == "00 Current" and ShowForecasts and MA2Visible ? MA2Forecast5 : na, color=color.yellow, linewidth=1, style=plot.style_circles, title="MA2 Forecast 5", offset=5, show_last=1)
|
|
|
|
|
|
MA3Forecast1 = (request.security(syminfo.tickerid, res(MA3Resolution), ma(MA3Type, MA3Source, MA3Period - 1)) * (MA3Period - 1) + ((MA1Source * 1) + (Bias * 1))) / MA3Period
|
|
MA3Forecast2 = (request.security(syminfo.tickerid, res(MA3Resolution), ma(MA3Type, MA3Source, MA3Period - 2)) * (MA3Period - 2) + ((MA1Source * 2) + (Bias * 2))) / MA3Period
|
|
MA3Forecast3 = (request.security(syminfo.tickerid, res(MA3Resolution), ma(MA3Type, MA3Source, MA3Period - 3)) * (MA3Period - 3) + ((MA1Source * 3) + (Bias * 3))) / MA3Period
|
|
MA3Forecast4 = (request.security(syminfo.tickerid, res(MA3Resolution), ma(MA3Type, MA3Source, MA3Period - 4)) * (MA3Period - 4) + ((MA1Source * 4) + (Bias * 4))) / MA3Period
|
|
MA3Forecast5 = (request.security(syminfo.tickerid, res(MA3Resolution), ma(MA3Type, MA3Source, MA3Period - 5)) * (MA3Period - 5) + ((MA1Source * 5) + (Bias * 5))) / MA3Period
|
|
|
|
plot(MA3Resolution == "00 Current" and ShowForecasts and MA3Visible ? MA3Forecast1 : na, color=color.red, linewidth=1, style=plot.style_circles, title="MA3 Forecast 1", offset=1, show_last=1)
|
|
plot(MA3Resolution == "00 Current" and ShowForecasts and MA3Visible ? MA3Forecast2 : na, color=color.red, linewidth=1, style=plot.style_circles, title="MA3 Forecast 2", offset=2, show_last=1)
|
|
plot(MA3Resolution == "00 Current" and ShowForecasts and MA3Visible ? MA3Forecast3 : na, color=color.red, linewidth=1, style=plot.style_circles, title="MA3 Forecast 3", offset=3, show_last=1)
|
|
plot(MA3Resolution == "00 Current" and ShowForecasts and MA3Visible ? MA3Forecast4 : na, color=color.red, linewidth=1, style=plot.style_circles, title="MA3 Forecast 4", offset=4, show_last=1)
|
|
plot(MA3Resolution == "00 Current" and ShowForecasts and MA3Visible ? MA3Forecast5 : na, color=color.red, linewidth=1, style=plot.style_circles, title="MA3 Forecast 5", offset=5, show_last=1)
|
|
|
|
|
|
// Ribbon related code
|
|
// For Ribbons to work - they must use the same MAType, MAResolution and MASource. This is to ensure the ribbons are fair between one to the other.
|
|
// Ribbons also will usually look better if MA1Period < MA2Period and MA2Period < MA3Period
|
|
|
|
// custom functions in pine - https://www.tradingview.com/wiki/Declaring_Functions
|
|
// This function is used to calculate the period to be used on a ribbon based on existing MAs
|
|
rperiod(P1, P2, Step, Ribbons) =>
|
|
((array.abs(P1 - P2)) / (Ribbons + 1) * Step) + math.min(P1, P2)
|
|
// divide by +1 so that 5 lines can show. Divide by 5 and one line shows up on another MA
|
|
|
|
// MA1-MA2
|
|
Ribbon1 = request.security(syminfo.tickerid, res(MA1Resolution), ma(MA1Type, MA1Source, rperiod(MA1Period, MA2Period, 1, 5)))
|
|
Ribbon2 = request.security(syminfo.tickerid, res(MA1Resolution), ma(MA1Type, MA1Source, rperiod(MA1Period, MA2Period, 2, 5)))
|
|
Ribbon3 = request.security(syminfo.tickerid, res(MA1Resolution), ma(MA1Type, MA1Source, rperiod(MA1Period, MA2Period, 3, 5)))
|
|
Ribbon4 = request.security(syminfo.tickerid, res(MA1Resolution), ma(MA1Type, MA1Source, rperiod(MA1Period, MA2Period, 4, 5)))
|
|
Ribbon5 = request.security(syminfo.tickerid, res(MA1Resolution), ma(MA1Type, MA1Source, rperiod(MA1Period, MA2Period, 5, 5)))
|
|
|
|
plot(ShowRibbons and MA1Type == MA2Type and MA1Resolution == MA2Resolution and MA1Source == MA2Source ? Ribbon1 : na, color=color.green, linewidth=1, style=plot.style_line, title="Ribbon1", transp=90)
|
|
plot(ShowRibbons and MA1Type == MA2Type and MA1Resolution == MA2Resolution and MA1Source == MA2Source ? Ribbon2 : na, color=color.green, linewidth=1, style=plot.style_line, title="Ribbon2", transp=85)
|
|
plot(ShowRibbons and MA1Type == MA2Type and MA1Resolution == MA2Resolution and MA1Source == MA2Source ? Ribbon3 : na, color=color.green, linewidth=1, style=plot.style_line, title="Ribbon3", transp=80)
|
|
plot(ShowRibbons and MA1Type == MA2Type and MA1Resolution == MA2Resolution and MA1Source == MA2Source ? Ribbon4 : na, color=color.yellow, linewidth=1, style=plot.style_line, title="Ribbon4", transp=75)
|
|
plot(ShowRibbons and MA1Type == MA2Type and MA1Resolution == MA2Resolution and MA1Source == MA2Source ? Ribbon5 : na, color=color.yellow, linewidth=1, style=plot.style_line, title="Ribbon5", transp=70)
|
|
|
|
// MA2-MA3
|
|
Ribbon6 = request.security(syminfo.tickerid, res(MA2Resolution), ma(MA2Type, MA2Source, rperiod(MA2Period, MA3Period, 1, 5)))
|
|
Ribbon7 = request.security(syminfo.tickerid, res(MA2Resolution), ma(MA2Type, MA2Source, rperiod(MA2Period, MA3Period, 2, 5)))
|
|
Ribbon8 = request.security(syminfo.tickerid, res(MA2Resolution), ma(MA2Type, MA2Source, rperiod(MA2Period, MA3Period, 3, 5)))
|
|
Ribbon9 = request.security(syminfo.tickerid, res(MA2Resolution), ma(MA2Type, MA2Source, rperiod(MA2Period, MA3Period, 4, 5)))
|
|
Ribbon10 = request.security(syminfo.tickerid, res(MA2Resolution), ma(MA2Type, MA2Source, rperiod(MA2Period, MA3Period, 5, 5)))
|
|
|
|
plot(ShowRibbons and MA2Type == MA3Type and MA2Resolution == MA3Resolution and MA2Source == MA3Source ? Ribbon6 : na, color=color.yellow, linewidth=1, style=plot.style_line, title="Ribbon6", transp=70)
|
|
plot(ShowRibbons and MA2Type == MA3Type and MA2Resolution == MA3Resolution and MA2Source == MA3Source ? Ribbon7 : na, color=color.yellow, linewidth=1, style=plot.style_line, title="Ribbon7", transp=75)
|
|
plot(ShowRibbons and MA2Type == MA3Type and MA2Resolution == MA3Resolution and MA2Source == MA3Source ? Ribbon8 : na, color=color.red, linewidth=1, style=plot.style_line, title="Ribbon8", transp=80)
|
|
plot(ShowRibbons and MA2Type == MA3Type and MA2Resolution == MA3Resolution and MA2Source == MA3Source ? Ribbon9 : na, color=color.red, linewidth=1, style=plot.style_line, title="Ribbon9", transp=85)
|
|
plot(ShowRibbons and MA2Type == MA3Type and MA2Resolution == MA3Resolution and MA2Source == MA3Source ? Ribbon10 : na, color=color.red, linewidth=1, style=plot.style_line, title="Ribbon10", transp=90)
|
|
|
|
// Strategy Specific
|
|
if MA12Crossover and TradeMA12Crosses
|
|
//https://www.tradingview.com/pine-script-reference/#fun_strategy{dot}entry
|
|
strategy.entry("1 over 2", strategy.long, comment="1 over 2")
|
|
if MA12Crossunder and TradeMA12Crosses
|
|
//https://www.tradingview.com/pine-script-reference/#fun_strategy{dot}close
|
|
strategy.close("1 over 2")
|
|
|
|
if MA13Crossover and TradeMA13Crosses
|
|
//https://www.tradingview.com/pine-script-reference/#fun_strategy{dot}entry
|
|
strategy.entry("1 over 3", strategy.long, comment="1 over 3")
|
|
if MA13Crossunder and TradeMA13Crosses
|
|
//https://www.tradingview.com/pine-script-reference/#fun_strategy{dot}close
|
|
strategy.close("1 over 3")
|
|
|
|
if MA23Crossover and TradeMA23Crosses
|
|
//https://www.tradingview.com/pine-script-reference/#fun_strategy{dot}entry
|
|
strategy.entry("2 over 3", strategy.long, comment="2 over 3")
|
|
if MA23Crossunder and TradeMA23Crosses
|
|
//https://www.tradingview.com/pine-script-reference/#fun_strategy{dot}close
|
|
strategy.close("2 over 3")
|
|
|
|
```
|
|
|
|
> Detail
|
|
|
|
https://www.fmz.com/strategy/435959
|
|
|
|
> Last Modified
|
|
|
|
2023-12-20 14:12:20
|