
11 KiB
Name
智能量化低点反转策略Smart-Quantitative-Bottom-Reversal-Trading-Strategy
Author
ChaoZhang
Strategy Description
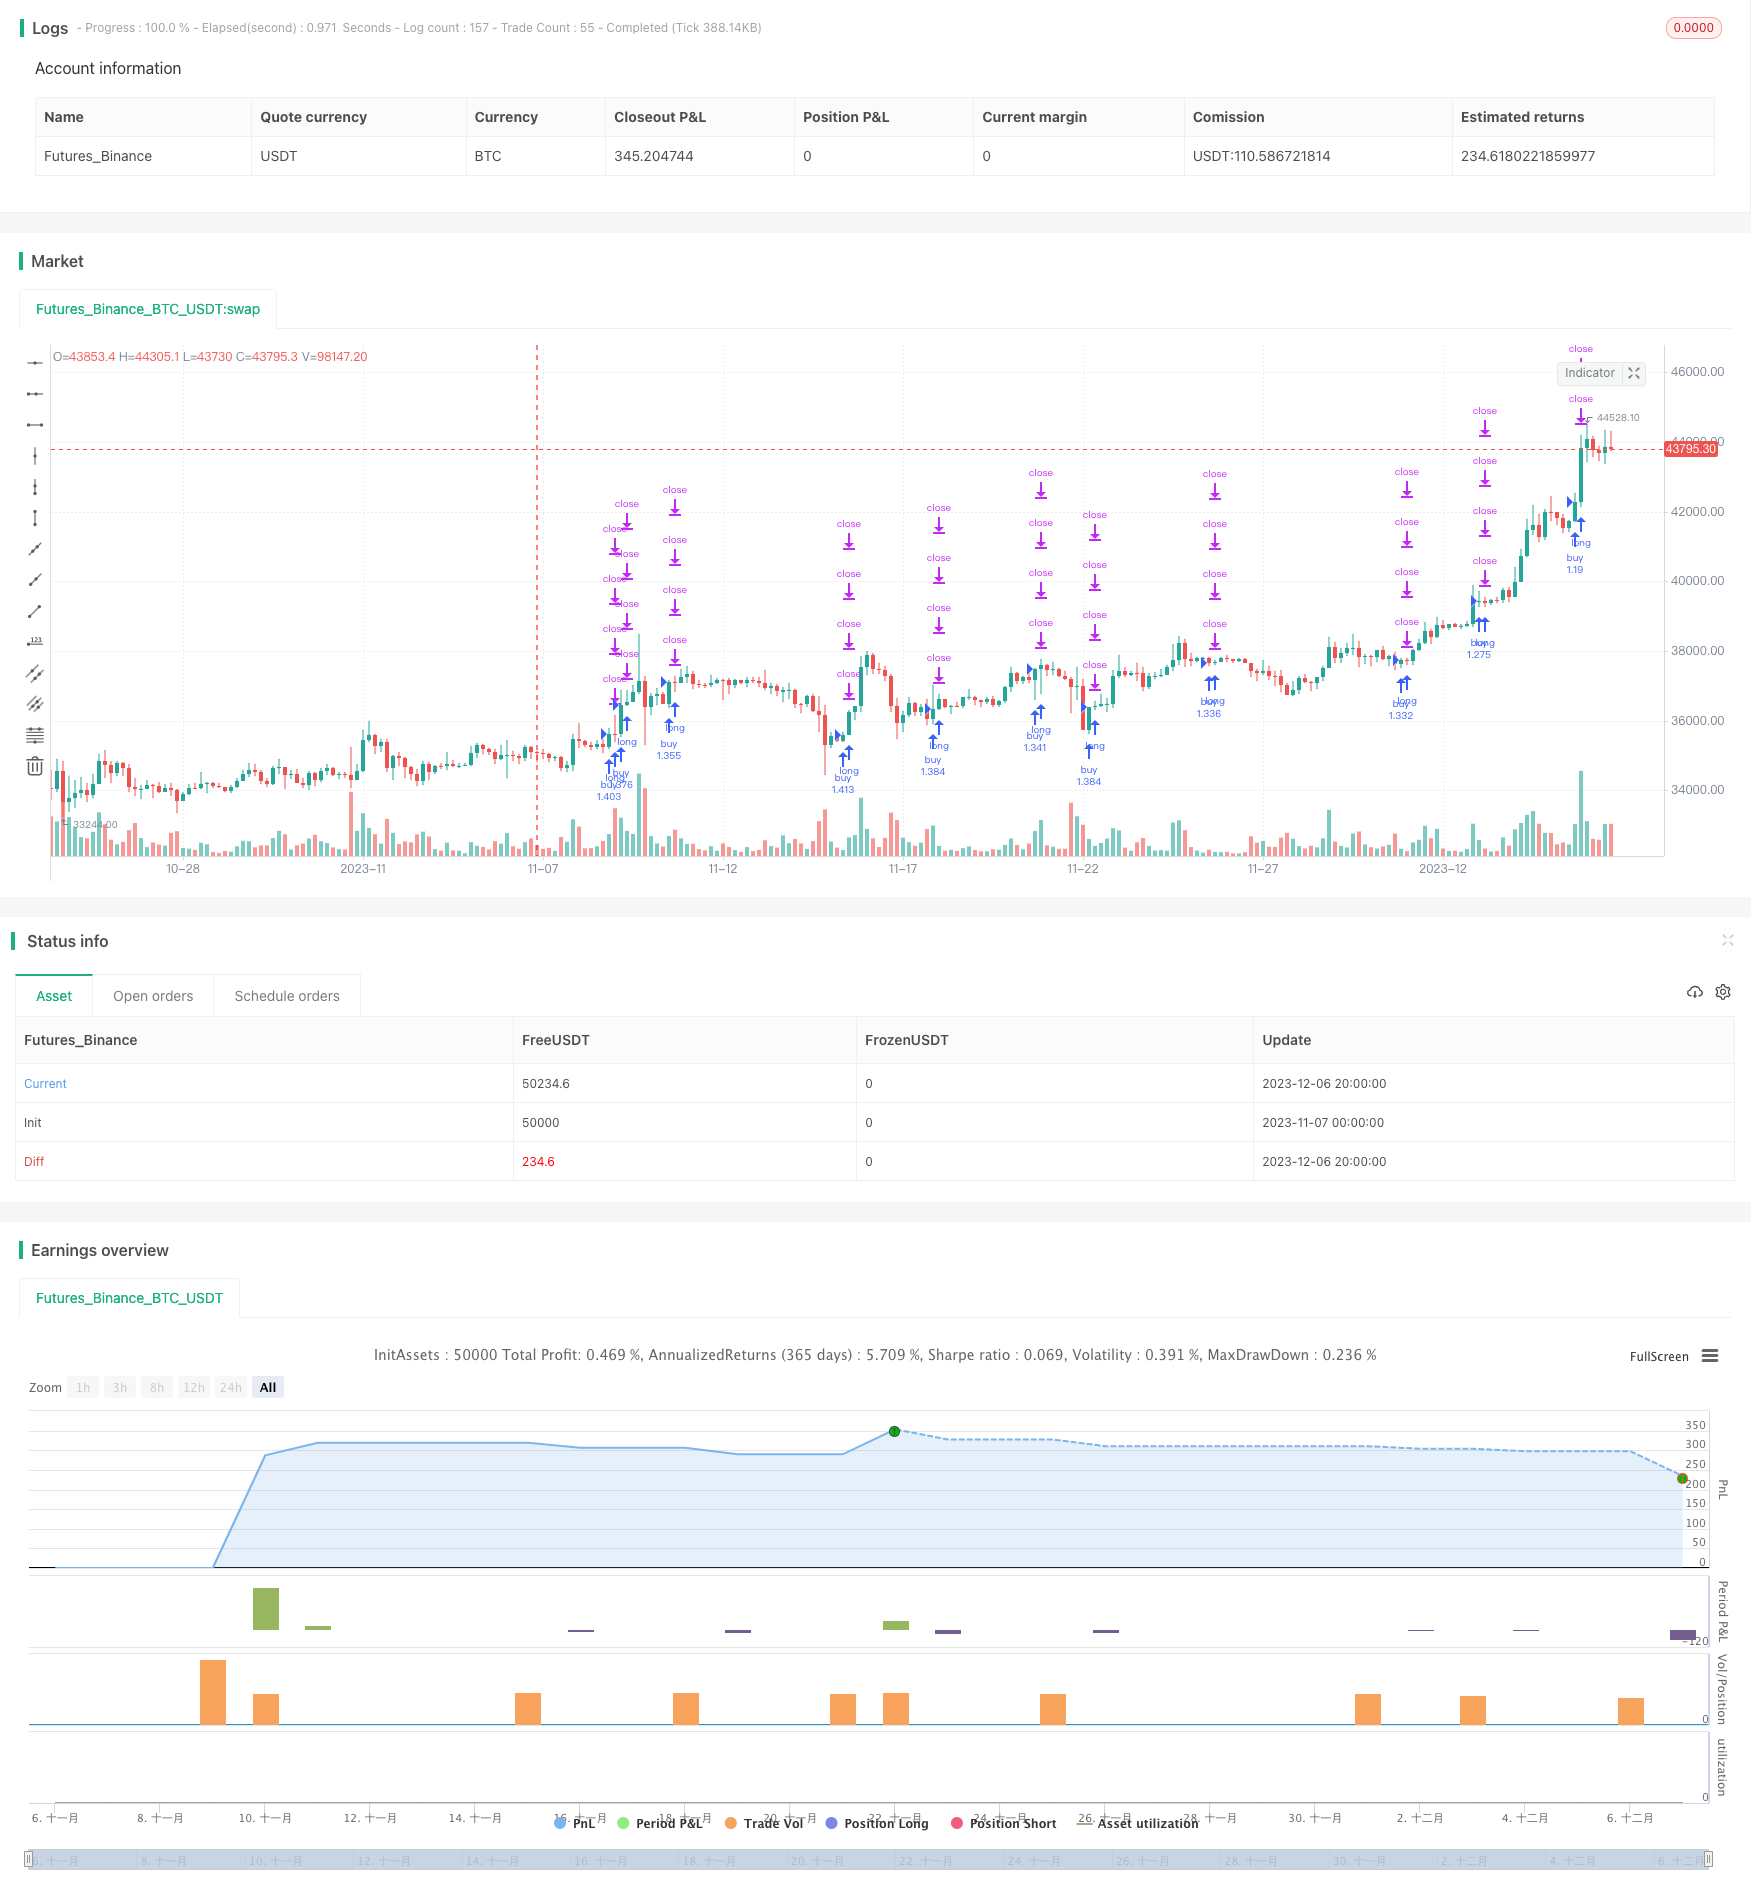 [trans]
概述
该策略是一种针对加密货币的智能量化低点反转交易策略。它利用多时间框架技术和自适应RSI指标判断市场可能的短期低点,在低点附近进行反转进入,获得超额收益。
策略原理
首先,该策略利用变化量和成交量计算自适应RSI指标,判断可能的市场短期低点。然后结合多时间框架技术在更大级别确定低点信号。当自适应RSI指标线从0水平下方上穿时产生买入信号。
具体来说,自适应RSI指标的计算方法是:先计算每根K线的变化量,再计算该根K线的成交量,然后变化量乘以成交量得到该根K线的量化力度。对量化力度进行RSI计算,并取N周期平均值,从而得到自适应RSI指标。该指标能清晰判断市场低点。
在此基础上,本策略又引入了多时间框架技术,在更高级别框架判断信号,避免被短期市场噪音干扰。当高级别均线从低点折返时,判断为本策略的买入时机。
优势分析
该策略最大的优势在于利用自适应RSI指标准确判断市场的短期低点,这为低点反转交易提供了有效信号。此外,多时间框架技术的加入也提高了信号的质量,避免被短期市场噪音干扰。
相比传统的RSI指标,自适应RSI指标加入了量化力度的计算,使得它对快速变化的加密货币市场更为敏感,可以更早、更准确地判断市场低点,这为低点反转交易提供了先机。
此外,该策略兼具趋势跟踪和反转交易的优点。在趋势不明朗的市场中,它可以利用反转交易获利。而在明确的牛市中,它也能跟踪趋势运行。
风险分析
该策略的主要风险在于低点判断的准确性无法100%保证。市场短期内常有巨大的非理性波动。如果低点继续下探,将面临较大的止损风险。
此外,多时间框架之间也可能出现背离。如果高时间框架信号出现滞后,则可能导致交易亏损。
为控制风险,该策略采用比较保守的止损机制,并设置分批止盈,逐步优化收益。此外也可适当调整自适应RSI的参数,优化低点判断的准确性。
优化方向
该策略可以从以下几个方面进行优化:
-
优化自适应RSI指标的参数,提高对市场低点的判断准确性。可以尝试不同的周期参数。
-
添加其他指标进行confirmation,避免出现错误信号。比如结合成交量指标等。
-
优化止损机制,在保证盈亏比的前提下,适当放宽止损幅度,赚取更多趋势利润。
-
优化时间框架的选择,在更大级别确保信号的可靠性。可以测试每日、每周等更高级别均线。
-
测试该策略在不同加密货币品种的效果,选择最佳品种。
总结
该智能量化低点反转策略通过自适应RSI指标和多时间框架技术判断市场可能的短期低点。它反转交易的特点使其能在不确定的行情中获得超额收益。同时,它也可跟踪明确趋势行情。通过持续优化,该策略有望获取更加可靠的交易信号,从而获得长期稳定收益。
||
Overview
This strategy is a smart quantitative bottom reversal trading strategy designed for cryptocurrencies. It utilizes multi-timeframe technology and adaptive RSI indicator to identify potential short-term bottoms of the market, and enters for reversal near the bottom to achieve excessive returns.
Strategy Principle
Firstly, the strategy employs change in price and trading volume to calculate the adaptive RSI indicator, judging possible short-term market bottoms. Then, combined with multi-timeframe technology, it confirms bottom signals on a larger timeframe. Buy signals are generated when the adaptive RSI line crosses above the 0 level.
Specifically, the adaptive RSI indicator is calculated as follows: First calculate the change in price for each candlestick, then calculate the trading volume of that candlestick. Multiply the two to get quantified momentum for that candlestick. Apply RSI calculation on quantified momentum and take N period average to obtain the final adaptive RSI indicator. This indicator can clearly identify market bottoms.
On top of that, this strategy incorporates multi-timeframe technology to judge signals on a higher timeframe, avoiding interference from short-term market noise. When the moving average on the higher timeframe turns from the bottom, it is considered the buy timing for this strategy.
Advantage Analysis
The biggest advantage of this strategy lies in the accurate identification of short-term market bottoms using the adaptive RSI indicator, which provides effective signals for bottom reversal trading. In addition, the incorporation of multi-timeframe technology also improves signal quality by avoiding interference from short-term noises.
Compared to traditional RSI indicators, the adaptive RSI indicator introduces quantified momentum in its calculation, making it more sensitive to the rapidly changing cryptocurrency market, and hence able to identify bottoms earlier and more precisely, providing a head start for bottom reversal trading.
In addition, this strategy combines the advantages of both trend following and reversal trading. In uncertain market conditions, it can profit from reversal trading. In a clear bull market, it can also follow the trend.
Risk Analysis
The main risk of this strategy is that the accuracy of bottom identification cannot be 100% guaranteed. There can be huge irrational fluctuations in the market in the short run. If the bottom extends further down, large stop loss risks would be faced.
In addition, divergences can occur between different timeframes. If signals from higher timeframes lag behind, it may lead to trading losses.
To control risks, this strategy adopts relatively conservative stop loss mechanisms and takes profits in batches, progressively optimizing returns. Also, parameters of the adaptive RSI can be adjusted to optimize accuracy in bottom judging.
Optimization Directions
This strategy can be optimized in the following aspects:
-
Optimize parameters of the adaptive RSI to improve accuracy in market bottom judgment. Different period parameters can be tested.
-
Add other indicators for confirmation to avoid false signals, such as combining with volume indicators etc.
-
Optimize the stop loss mechanism to allow wider stop loss range while ensuring good risk-reward ratio, in order to capture more trend profits.
-
Optimize timeframe selection to ensure signal reliability on a larger scale. Daily, weekly or even higher timeframes can be tested.
-
Test this strategy on different cryptocurrency products and select the best performing ones.
Summary
This smart quantitative bottom reversal trading strategy identifies potential short-term bottoms by using the adaptive RSI indicator and multi-timeframe technology. Its reversal nature enables excessive profits in uncertain market conditions, while also being able to follow clear trends. With continuous optimizations, this strategy has the potential to generate more reliable trading signals and achieve long-term steady profits.
[/trans]
Strategy Arguments
| Argument | Default | Description |
|---|---|---|
| v_input_1 | 0 | Strategy Direction: long |
| v_input_2 | 10 | min |
| v_input_3 | 60 | tf3 |
| v_input_4 | true | min1 |
| v_input_5 | 0 | Timeframe: 60 |
| v_input_6 | 24 | Period |
| v_input_7 | true | Shift |
| v_input_8 | 25 | len |
| v_input_9 | 10 | stop loss |
| v_input_10 | 25 | qty_percent1 |
| v_input_11 | 25 | qty_percent2 |
| v_input_12 | 25 | qty_percent3 |
| v_input_13 | true | Take profit1 |
| v_input_14 | 2 | Take profit2 |
| v_input_15 | 3 | Take profit3 |
| v_input_16 | 5 | Take profit4 |
Source (PineScript)
/*backtest
start: 2023-11-07 00:00:00
end: 2023-12-07 00:00:00
period: 4h
basePeriod: 15m
exchanges: [{"eid":"Futures_Binance","currency":"BTC_USDT"}]
*/

// © theCrypster 2020

//@version=4
strategy(title = "Low Scanner strategy crypto", overlay = false, pyramiding=1,initial_capital = 1000, default_qty_type= strategy.percent_of_equity, default_qty_value = 100, calc_on_order_fills=false, slippage=0,commission_type=strategy.commission.percent,commission_value=0.075)
strat_dir_input = input(title="Strategy Direction", defval="long", options=["long", "short", "all"])
strat_dir_value = strat_dir_input == "long" ? strategy.direction.long : strat_dir_input == "short" ? strategy.direction.short : strategy.direction.all
strategy.risk.allow_entry_in(strat_dir_value)
leng=1
p1=close[1]
min=input(10)
len55 = timeframe.isintraday and timeframe.multiplier >= 1 ?
   min / timeframe.multiplier * 7 :
   timeframe.isintraday and timeframe.multiplier < 60 ?
   60 / timeframe.multiplier * 24 * 7 : 7
//taken from https://www.tradingview.com/script/Ql1FjjfX-security-free-MTF-example-JD/
tf3 = input("60", type=input.resolution)
ti = change( time(tf3) ) != 0
T_c = fixnan( ti ? close : na )

vrsi = rsi(cum(change(T_c) * volume), leng)
pp=wma(vrsi,len55)

d=(vrsi[1]-pp[1])
min1 =input(1)
len100 = timeframe.isintraday and timeframe.multiplier >= 1 ?
   min1 / timeframe.multiplier * 7 :
   timeframe.isintraday and timeframe.multiplier < 60 ?
   60 / timeframe.multiplier * 24 * 7 : 7
x=ema(d,len100)
//
zx=x/-1
col=zx > 0? color.lime : color.orange
plot(zx,color=col,linewidth=1)
//

tf10 = input("60", title = "Timeframe", type = input.resolution, options = ["1", "5", "15", "30", "60","120", "240","360","720", "D", "W"])

length = input(24, title = "Period", type = input.integer)
shift = input(1, title = "Shift", type = input.integer)

hma(_src, _length)=>
    wma((2 * wma(_src, _length / 2)) - wma(_src, _length), round(sqrt(_length)))

hma3(_src, _length)=>
    p = length/2
    wma(wma(close,p/3)*3 - wma(close,p/2) - wma(close,p),p)


a = security(syminfo.tickerid, tf10, hma(close, length))
b =security(syminfo.tickerid, tf10, hma3(close[1], length)[shift])
//plot(a,color=color.gray)
//plot(b,color=color.yellow)
close_price = close[0]
len = input(25)

linear_reg = linreg(close_price, len, 0)


//plot(linear_reg, color=color.blue, title="LR", linewidth=3)

buy=crossover(linear_reg, b)
sell=crossunder(linear_reg, b)
//
l = crossover(zx,0) or buy

if l
    strategy.entry("buy", strategy.long)

per(pcnt) =>
    strategy.position_size != 0 ? round(pcnt / 100 * strategy.position_avg_price / syminfo.mintick) : float(na)
stoploss=input(title=" stop loss", defval=10, minval=0.01)
los = per(stoploss)
q1=input(title=" qty_percent1", defval=25, minval=1)
q2=input(title=" qty_percent2", defval=25, minval=1)
q3=input(title=" qty_percent3", defval=25, minval=1)
tp1=input(title=" Take profit1", defval=1, minval=0.01)
tp2=input(title=" Take profit2", defval=2, minval=0.01)
tp3=input(title=" Take profit3", defval=3, minval=0.01)
tp4=input(title=" Take profit4", defval=5, minval=0.01)
strategy.exit("x1", qty_percent = q1, profit = per(tp1), loss = los)
strategy.exit("x2", qty_percent = q2, profit = per(tp2), loss = los)
strategy.exit("x3", qty_percent = q3, profit = per(tp3), loss = los)
strategy.exit("x4", profit = per(tp4), loss = los)
Detail
https://www.fmz.com/strategy/434671
Last Modified
2023-12-08 10:45:49