
282 lines
9.1 KiB
Markdown
282 lines
9.1 KiB
Markdown
|
||
> Name
|
||
|
||
基于EMA和MAMA指标的交易策略EMA-and-MAMA-Indicators-Based-Trading-Strategy
|
||
|
||
> Author
|
||
|
||
ChaoZhang
|
||
|
||
> Strategy Description
|
||
|
||
|
||
|
||
[trans]
|
||
|
||
## 概述
|
||
|
||
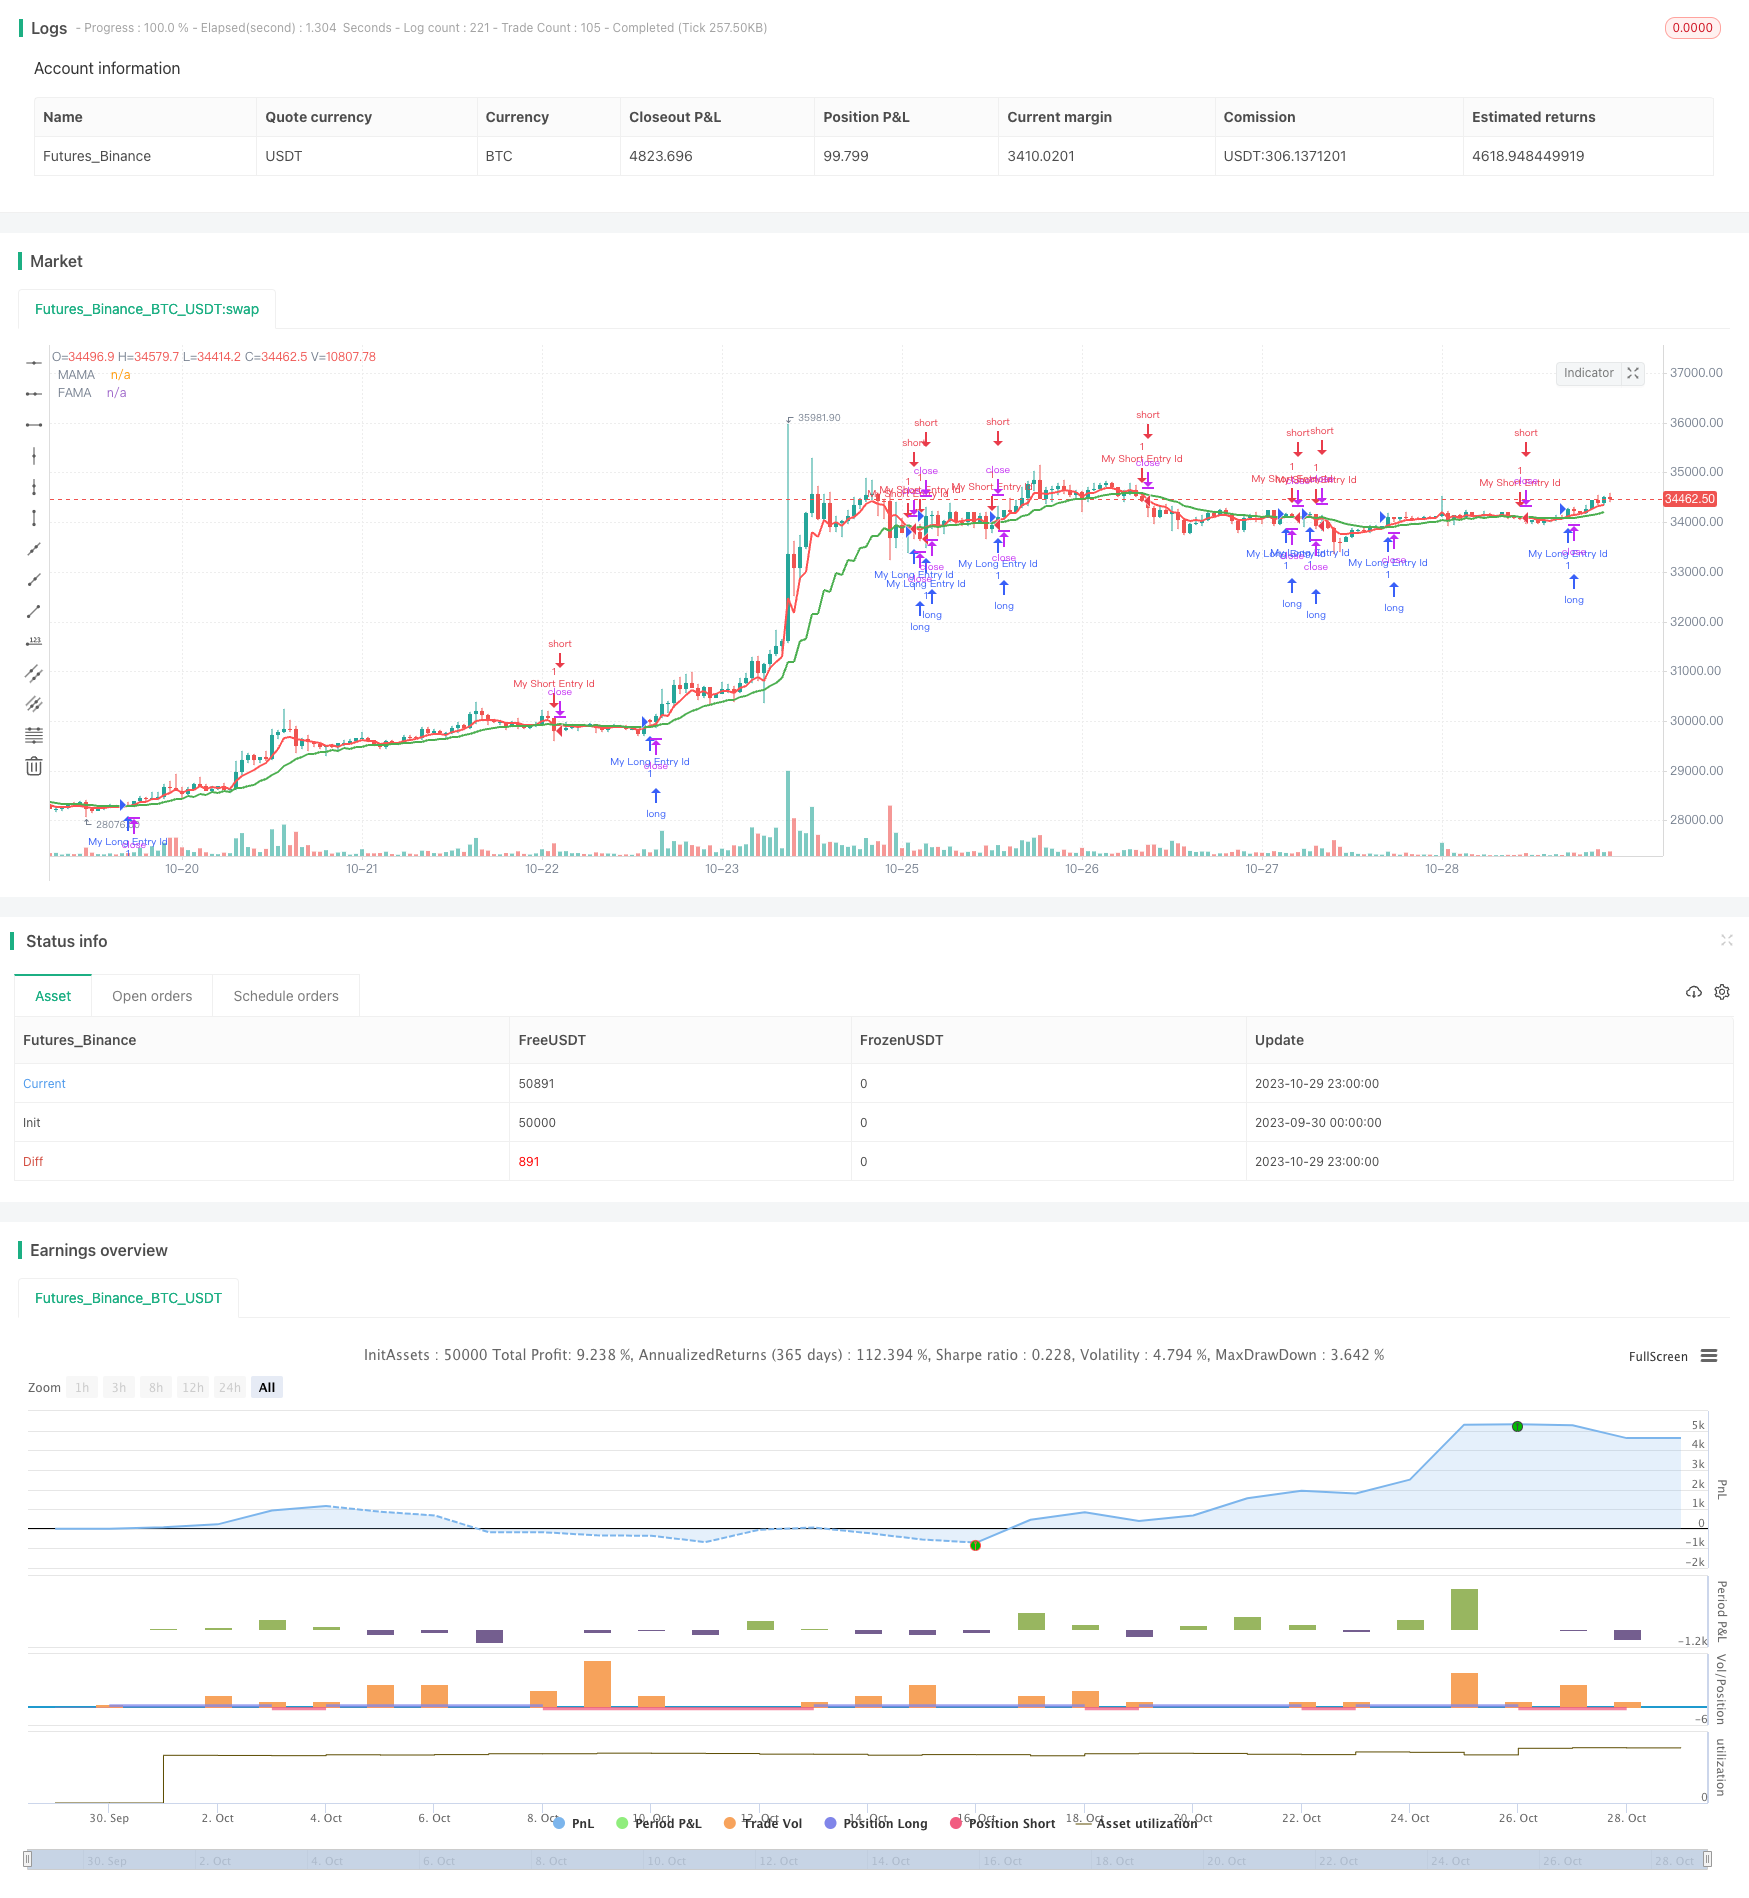
该策略基于EMA(指数移动平均线)和MAMA(MESA自适应移动平均线)两个指标,根据它们的交叉情况来判断行情趋势和产生交易信号。EMA常用于判断市场趋势方向,而MAMA可以更准确地捕捉市场转折点,两者配合使用可以提高策略的性能。
|
||
|
||
## 策略原理
|
||
|
||
1. 计算快速EMA和慢速EMA,它们分别反映市场短期和长期趋势
|
||
2. 计算MAMA和FAMA线,它们分别为自适应移动平均线
|
||
3. 当快速EMA上穿慢速EMA时,产生买入信号
|
||
4. 当快速EMA下穿慢速EMA时,产生卖出信号
|
||
5. 当MAMA上穿FAMA时,产生买入信号
|
||
6. 当MAMA下穿FAMA时,产生卖出信号
|
||
7. MAMA和FAMA的交叉可用于验证EMA交叉信号或提前捕捉趋势转折
|
||
|
||
具体来说,策略首先计算快速EMA(fl)和慢速EMA(sl),分别反映短期和长期趋势。
|
||
|
||
然后根据John Ehlers的公式计算MAMA和FAMA:
|
||
1. 计算价格的 Hilbert Transform 并提取信号的相位信息
|
||
2. 根据相位信息计算信号的瞬时周期p
|
||
3. 根据p值计算α权重
|
||
4. 根据α权重计算MAMA和FAMA
|
||
|
||
最后,策略根据EMA和MAMA/FAMA的交叉情况来产生交易信号:
|
||
- EMA金叉时做多
|
||
- EMA死叉时做空
|
||
- MAMA上穿FAMA时做多
|
||
- MAMA下穿FAMA时做空
|
||
|
||
## 优势分析
|
||
|
||
该策略结合EMA和MAMA指标的优势,可以提高交易信号的准确性。
|
||
|
||
EMA的优势:
|
||
- 能够有效平滑价格数据,减少噪音
|
||
- 能跟踪市场趋势且有一定的滞后性
|
||
- 参数灵活,可调整对短期和长期趋势的敏感度
|
||
|
||
MAMA的优势:
|
||
- 自适应参数,不需要人为指定周期
|
||
- 响应迅速,可提前捕捉趋势转折
|
||
- 准确识别支撑和阻力区域
|
||
|
||
两者配合使用的优势:
|
||
- EMA判断主要趋势方向
|
||
- MAMA验证信号并提前捕捉转折
|
||
- 提高信号的准确性和胜率
|
||
|
||
## 风险分析
|
||
|
||
该策略主要存在以下风险:
|
||
|
||
- EMA和MAMA均为后期确认指标, Entry 点稍有滞后,可能带来滑点风险
|
||
- 大幅震荡行情中,EMA和MAMA交叉频繁,会产生多头套和空头套
|
||
- EMA和MAMA参数设置不当,可能错过趋势或产生假信号
|
||
|
||
对应措施:
|
||
|
||
- 采用止损来控制亏损
|
||
- 合理选择参数,避免过于灵敏
|
||
- 与其他指标组合使用,确认信号
|
||
|
||
## 优化方向
|
||
|
||
该策略可从以下方面进行优化:
|
||
|
||
- 优化EMA周期参数,使其更符合不同品种的特点
|
||
- 调整MAMA参数α的灵敏度,优化捕捉转折的速度
|
||
- 增加其他指标过滤,如MACD、RSI等,避免假信号
|
||
- 增加止损策略,以控制风险
|
||
- 进行回测优化,选择最佳的参数组合
|
||
- 增加自动止盈,让利润最大化
|
||
|
||
## 总结
|
||
|
||
该策略整合EMA和MAMA两个指标的优势,能够顺势而为,及时捕捉趋势转折,是一种可靠的跟踪趋势类策略。通过参数优化和风险控制,可以提高策略的胜率和盈利能力。但用户仍需根据自身风险偏好谨慎操作。
|
||
|
||
||
|
||
|
||
## Overview
|
||
|
||
This strategy is based on the EMA (Exponential Moving Average) and MAMA (MESA Adaptive Moving Average) indicators to determine the trend direction and generate trading signals according to their crossovers. EMA is often used to judge the market trend direction, while MAMA can more accurately capture market turning points. Using both can improve the performance of the strategy.
|
||
|
||
## Strategy Logic
|
||
|
||
1. Calculate the fast EMA and slow EMA, which reflect the short-term and long-term trends of the market respectively.
|
||
|
||
2. Calculate the MAMA and FAMA lines, which are adaptive moving averages.
|
||
|
||
3. When the fast EMA crosses above the slow EMA, a buy signal is generated.
|
||
|
||
4. When the fast EMA crosses below the slow EMA, a sell signal is generated.
|
||
|
||
5. When MAMA crosses above FAMA, a buy signal is generated.
|
||
|
||
6. When MAMA crosses below FAMA, a sell signal is generated.
|
||
|
||
7. Crossovers of MAMA and FAMA can be used to confirm EMA signals or provide early detection of trend turns.
|
||
|
||
Specifically, the strategy first calculates the fast EMA (fl) and slow EMA (sl), reflecting short-term and long-term trends respectively.
|
||
|
||
Then it calculates MAMA and FAMA based on John Ehlers' formula:
|
||
|
||
1. Calculate the Hilbert Transform of price and extract phase information of the signal.
|
||
|
||
2. Calculate the instantaneous frequency p based on the phase information.
|
||
|
||
3. Calculate the weighting factor α based on the p value.
|
||
|
||
4. Calculate MAMA and FAMA based on α.
|
||
|
||
Finally, trading signals are generated based on EMA and MAMA/FAMA crossovers:
|
||
|
||
- Long when EMA crosses above
|
||
- Short when EMA crosses below
|
||
- Long when MAMA crosses above FAMA
|
||
- Short when MAMA crosses below FAMA
|
||
|
||
## Advantage Analysis
|
||
|
||
This strategy combines the advantages of EMA and MAMA indicators to improve the accuracy of trading signals.
|
||
|
||
Advantages of EMA:
|
||
|
||
- Effectively smooth price data and reduce noise
|
||
- Track trends well with some lag
|
||
- Flexible parameters to adjust sensitivity
|
||
|
||
Advantages of MAMA:
|
||
|
||
- Adaptive parameters, no need for manual period setting
|
||
- Fast response to capture trend turns early
|
||
- Accurately identify support and resistance
|
||
|
||
Advantages of combining them:
|
||
|
||
- EMA determines the overall trend
|
||
- MAMA verifies signals and detects turns early
|
||
- Improved accuracy and win rate of signals
|
||
|
||
## Risk Analysis
|
||
|
||
The main risks of this strategy:
|
||
|
||
- EMA and MAMA are lagging indicators, entry signals may have some delay and slippage
|
||
- Frequent crossovers in ranging markets causing whipsaws
|
||
- Improper parameter settings lead to missing trends or fake signals
|
||
|
||
Solutions:
|
||
|
||
- Use stop loss to control loss
|
||
- Choose reasonable parameters, avoid being too sensitive
|
||
- Combine with other indicators to confirm signals
|
||
|
||
## Optimization Directions
|
||
|
||
The strategy can be optimized in the following aspects:
|
||
|
||
- Optimize EMA periods based on symbol characteristics
|
||
- Fine tune MAMA alpha sensitivity to better capture turns
|
||
- Add other filters like MACD, RSI to avoid fake signals
|
||
- Add stop loss to control risks
|
||
- Backtest to find optimal parameters
|
||
- Automate take profit for maximized profit
|
||
|
||
## Summary
|
||
|
||
This strategy integrates the strengths of EMA and MAMA indicators to follow the trend and capture turns timely. With parameter optimization and risk control, it can achieve improved win rate and profitability. But users should still apply caution based on personal risk preference.
|
||
|
||
[/trans]
|
||
|
||
> Strategy Arguments
|
||
|
||
|
||
|
||
|Argument|Default|Description|
|
||
|----|----|----|
|
||
|v_input_1_hl2|0|Source: hl2|high|low|open|close|hlc3|hlcc4|ohlc4|
|
||
|v_input_2|0.5|Fast Limit|
|
||
|v_input_3|0.05|Slow Limit|
|
||
|v_input_4|false|Mark crossover points|
|
||
|v_input_5|false|Fill MAMA/FAMA Region|
|
||
|v_input_6|false|Enable Bar colors|
|
||
|
||
|
||
> Source (PineScript)
|
||
|
||
``` javascript
|
||
/*backtest
|
||
start: 2023-09-30 00:00:00
|
||
end: 2023-10-30 00:00:00
|
||
period: 1h
|
||
basePeriod: 15m
|
||
exchanges: [{"eid":"Futures_Binance","currency":"BTC_USDT"}]
|
||
*/
|
||
|
||
//@version=2
|
||
strategy("EMAMA strategy", overlay=true)
|
||
//This entire strategy is courtesy of LazyBear for programming the original EMAMA system, I simply added a strategy element to everything to round things out.
|
||
|
||
src=input(hl2, title="Source")
|
||
fl=input(.5, title="Fast Limit")
|
||
sl=input(.05, title="Slow Limit")
|
||
sp = (4*src + 3*src[1] + 2*src[2] + src[3]) / 10.0
|
||
dt = (.0962*sp + .5769*nz(sp[2]) - .5769*nz(sp[4])- .0962*nz(sp[6]))*(.075*nz(p[1]) + .54)
|
||
q1 = (.0962*dt + .5769*nz(dt[2]) - .5769*nz(dt[4])- .0962*nz(dt[6]))*(.075*nz(p[1]) + .54)
|
||
i1 = nz(dt[3])
|
||
jI = (.0962*i1 + .5769*nz(i1[2]) - .5769*nz(i1[4])- .0962*nz(i1[6]))*(.075*nz(p[1]) + .54)
|
||
jq = (.0962*q1 + .5769*nz(q1[2]) - .5769*nz(q1[4])- .0962*nz(q1[6]))*(.075*nz(p[1]) + .54)
|
||
i2_ = i1 - jq
|
||
q2_ = q1 + jI
|
||
i2 = .2*i2_ + .8*nz(i2[1])
|
||
q2 = .2*q2_ + .8*nz(q2[1])
|
||
re_ = i2*nz(i2[1]) + q2*nz(q2[1])
|
||
im_ = i2*nz(q2[1]) - q2*nz(i2[1])
|
||
re = .2*re_ + .8*nz(re[1])
|
||
im = .2*im_ + .8*nz(im[1])
|
||
p1 = iff(im!=0 and re!=0, 360/atan(im/re), nz(p[1]))
|
||
p2 = iff(p1 > 1.5*nz(p1[1]), 1.5*nz(p1[1]), iff(p1 < 0.67*nz(p1[1]), 0.67*nz(p1[1]), p1))
|
||
p3 = iff(p2<6, 6, iff (p2 > 50, 50, p2))
|
||
p = .2*p3 + .8*nz(p3[1])
|
||
spp = .33*p + .67*nz(spp[1])
|
||
phase = atan(q1 / i1)
|
||
dphase_ = nz(phase[1]) - phase
|
||
dphase = iff(dphase_< 1, 1, dphase_)
|
||
alpha_ = fl / dphase
|
||
alpha = iff(alpha_ < sl, sl, iff(alpha_ > fl, fl, alpha_))
|
||
mama = alpha*src + (1 - alpha)*nz(mama[1])
|
||
fama = .5*alpha*mama + (1 - .5*alpha)*nz(fama[1])
|
||
pa=input(false, title="Mark crossover points")
|
||
|
||
plotarrow(pa?(cross(mama, fama)?mama<fama?-1:1:na):na, title="Crossover Markers")
|
||
|
||
fr=input(false, title="Fill MAMA/FAMA Region")
|
||
|
||
duml=plot(fr?(mama>fama?mama:fama):na, style=circles, color=gray, linewidth=0, title="DummyL")
|
||
|
||
mamal=plot(mama, title="MAMA", color=red, linewidth=2)
|
||
|
||
famal=plot(fama, title="FAMA", color=green, linewidth=2)
|
||
|
||
fill(duml, mamal, red, transp=70, title="NegativeFill")
|
||
|
||
fill(duml, famal, green, transp=70, title="PositiveFill")
|
||
|
||
ebc=input(false, title="Enable Bar colors")
|
||
|
||
bc=mama>fama?lime:red
|
||
|
||
barcolor(ebc?bc:na)
|
||
|
||
longCondition = crossover(mama, fama)
|
||
if (longCondition)
|
||
strategy.entry("My Long Entry Id", strategy.long)
|
||
|
||
shortCondition = crossunder(mama, fama)
|
||
if (shortCondition)
|
||
strategy.entry("My Short Entry Id", strategy.short)
|
||
```
|
||
|
||
> Detail
|
||
|
||
https://www.fmz.com/strategy/430662
|
||
|
||
> Last Modified
|
||
|
||
2023-10-31 14:20:56
|