
158 lines
6.8 KiB
Markdown
158 lines
6.8 KiB
Markdown
|
|
> Name
|
|
|
|
基于05赫氏变化的短周期交易策略Heikin-Ashi-05-Change-Short-Period-Trading-Strategy
|
|
|
|
> Author
|
|
|
|
ChaoZhang
|
|
|
|
> Strategy Description
|
|
|
|
|
|
[trans]
|
|
|
|
## 概述
|
|
|
|
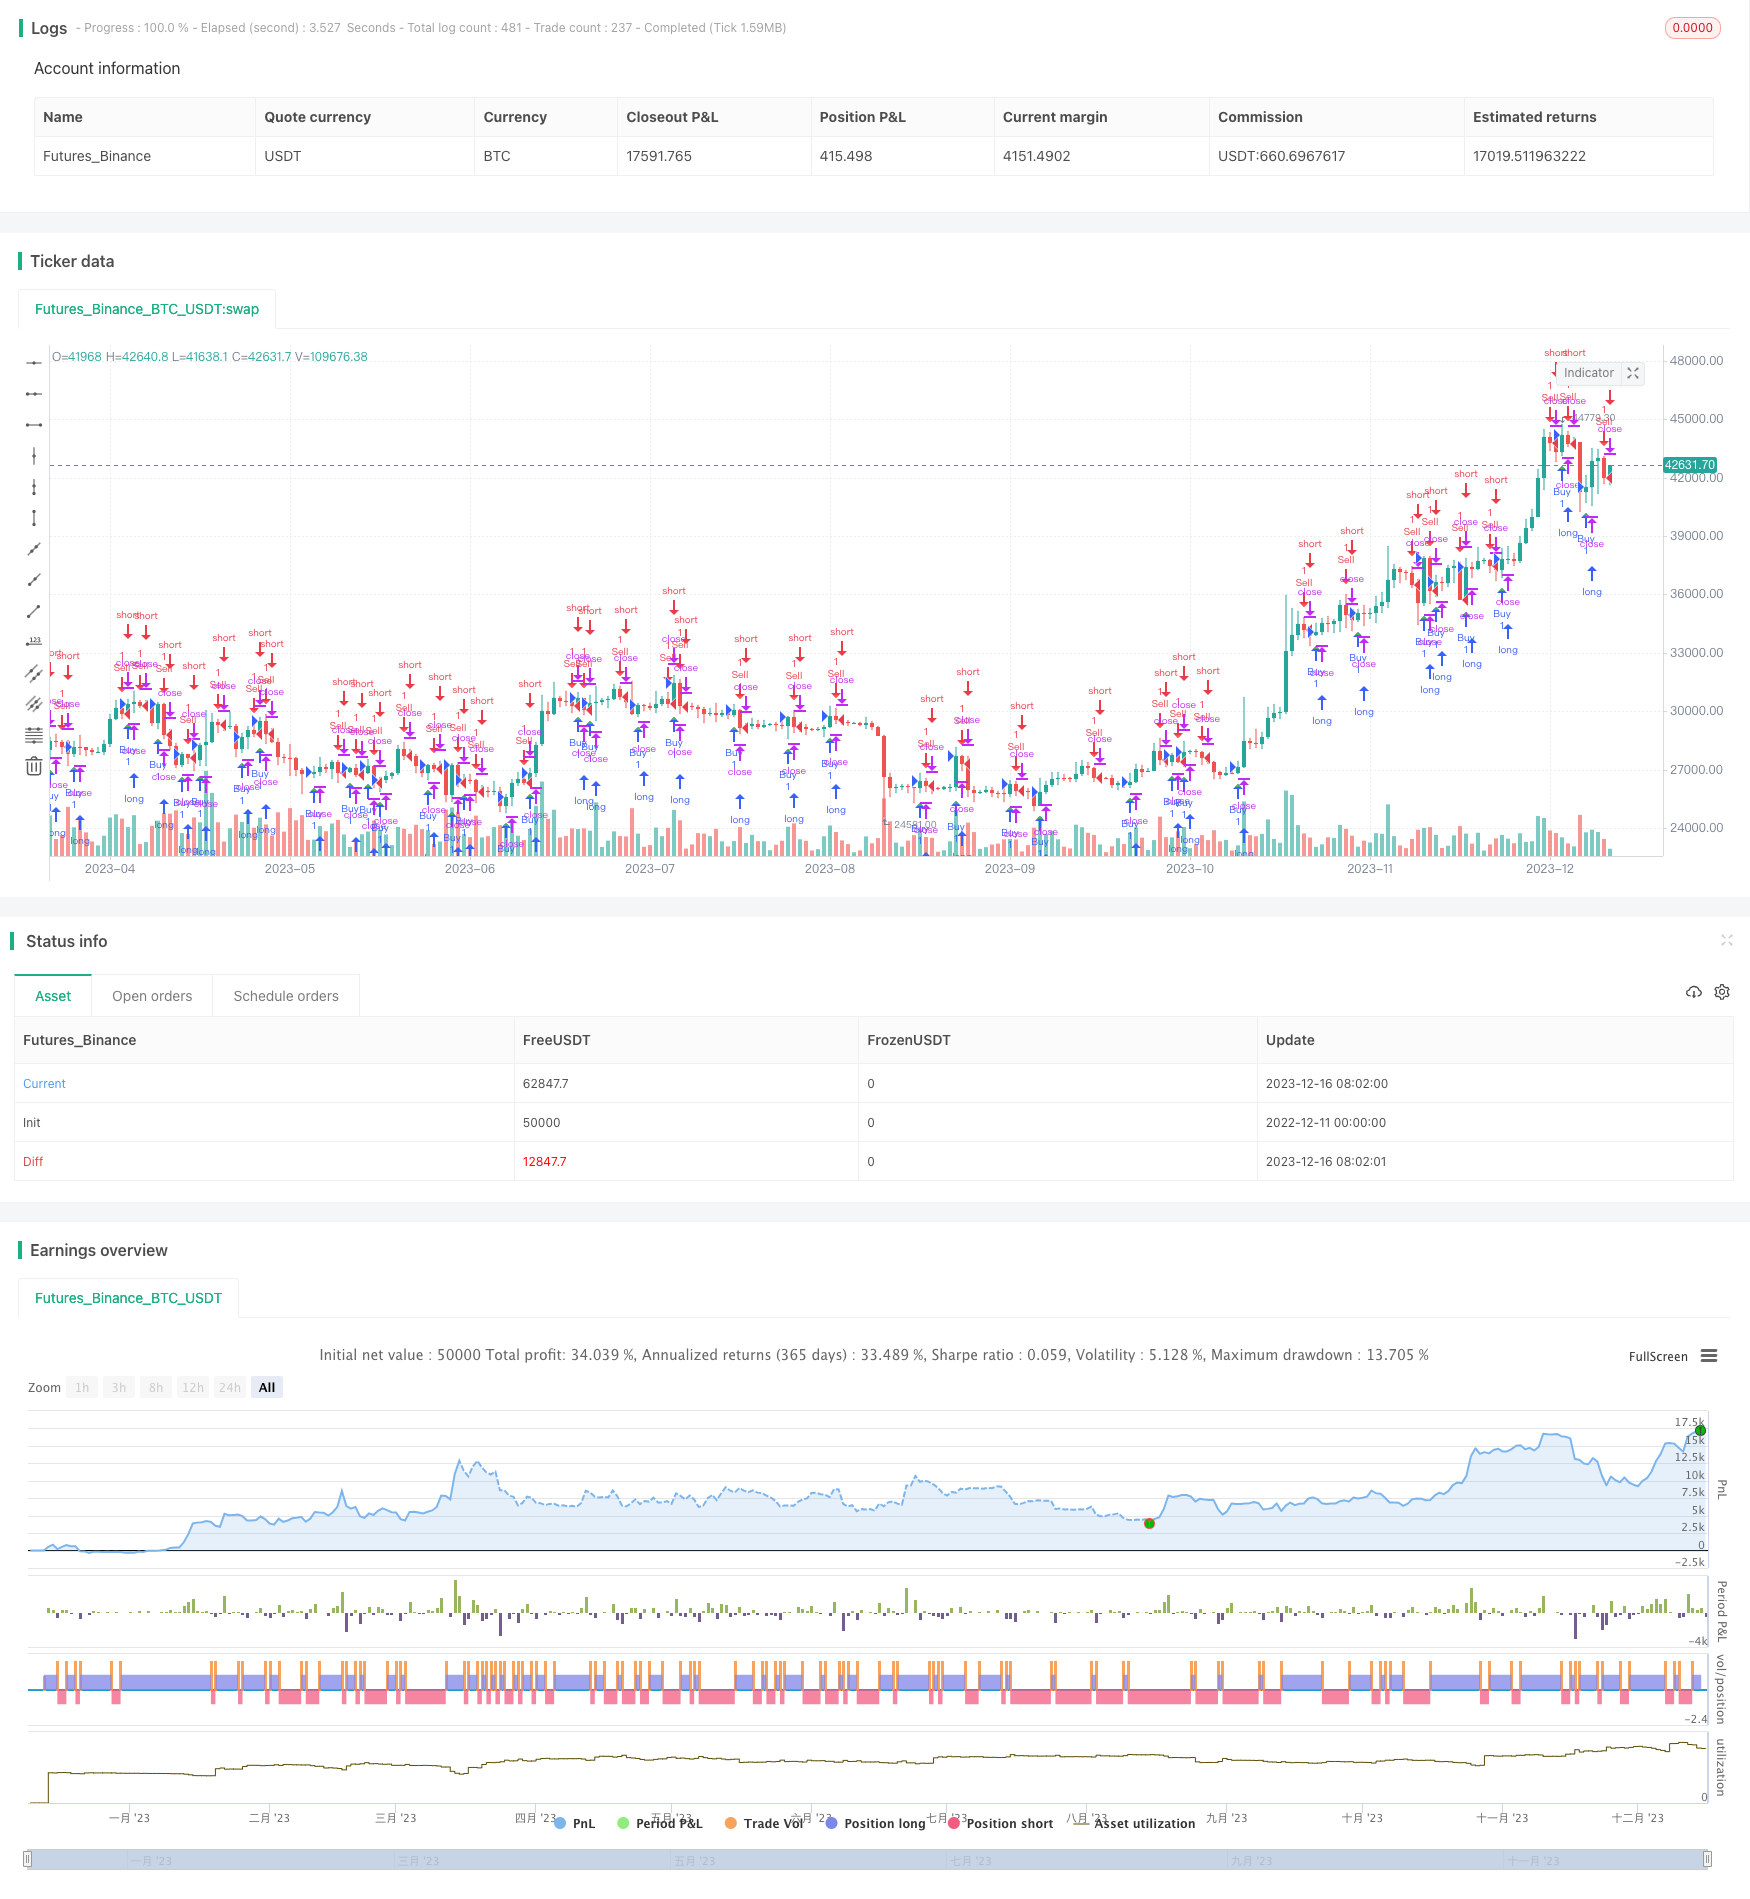
该策略是基于0.5%的赫氏收盘价变化来发出买入和卖出信号的一个短周期交易策略。它只适用于赫氏燃烧图,且最佳运行周期为2小时、1小时和30分钟。
|
|
|
|
## 策略原理
|
|
|
|
该策略的核心逻辑是:**当赫氏收盘价相比前一根K线的收盘价上涨0.5%时,做多;当赫氏收盘价相比前一根K线的收盘价下跌0.5%时,做空**。
|
|
|
|
具体来说,该策略先计算出当前K线收盘价与前一K线收盘价的变化百分比,即`priceChange = close / close[1] - 1`。如果`priceChange >= 0.005`,则发出做多信号;如果`priceChange <= -0.005`,则发出做空信号。
|
|
|
|
在发出信号时,该策略还会判断当前是否已有仓位。如果已经持仓(做多或做空),则不会重复发出信号;如果没有持仓,则会根据买入条件或卖出条件发出相应的开仓信号。
|
|
|
|
最后,策略还使用了`plotshape`来在图表上标记买入卖出信号。
|
|
|
|
## 策略优势
|
|
|
|
- 采用赫氏变化率作为交易信号,相比简单移动均线等指标,更能捕捉价格短期变化趋势
|
|
- 仅基于0.5%的微小价格变动就发出信号,极为灵敏,适合短线交易
|
|
- 整个策略逻辑非常简单直接,容易理解实现
|
|
- 可在多时间周期运用,灵活性强
|
|
|
|
## 风险及解决方案
|
|
|
|
- 赫氏燃烧图本身就更关注短期价格变动,容易被市场噪音干扰,产生虚假信号
|
|
- 可以适当调整变化率的参数,如改为1%或者2%,降低虚假信号率
|
|
- 过于灵敏,可能会过于频繁出入场,增加交易成本和税费
|
|
- 可以适当调整持仓周期,例如每次持仓2小时以上,避免高频交易
|
|
- 图形标记的买卖点可能过多,影响图表美观性
|
|
- 可以隐藏图形标记,仅通过策略日志查看入场信号
|
|
|
|
## 优化方向
|
|
|
|
该策略主要可从以下几个方面进行优化:
|
|
|
|
1. 基于市场的波动率和交易风格,调整价格变化阈值参数,找到最佳参数组合
|
|
2. 加入止损逻辑,限制单笔交易最大亏损比例,控制风险
|
|
3. 结合其他指标滤波,避免在震荡期无谓开仓
|
|
4. 增加仓位管理机制,例如固定数量开仓、指数增仓、网格交易等
|
|
5. 优化入场机制,避免频繁两边交易,采用顺势或逆势方式
|
|
|
|
## 总结
|
|
|
|
该策略整体来说是一个非常简单直接、参数少、容易理解和修改的短线交易策略。它 catches短期价格变化趋势的能力很强,适合那些喜欢高频交易的人。但同时也应当注意控制交易次数,降低交易成本。通过一些参数调整和优化,可以使该策略的交易表现更加出色。
|
|
|
|
||
|
|
|
|
## Overview
|
|
|
|
This is a short-term trading strategy that issues buy and sell signals based on 0.5% changes in the Heikin-Ashi close price. It is only suitable for Heikin-Ashi candlestick charts and works best at periods of 2 hours, 1 hour, and 30 minutes.
|
|
|
|
## Strategy Logic
|
|
|
|
The core logic of this strategy is: **Go long when the Heikin-Ashi close price rises 0.5% compared to the previous candlestick; Go short when the Heikin-Ashi close price falls 0.5% compared to the previous candlestick.**
|
|
|
|
Specifically, the strategy first calculates the percentage change between the current close price and the previous close price, i.e. `priceChange = close / close[1] - 1`. If `priceChange >= 0.005`, a long signal is issued. If `priceChange <= -0.005`, a short signal is issued.
|
|
|
|
When issuing signals, the strategy also judges whether there is an existing position. If already in position (long or short), no signal will be repeated. If there is no position, it will issue open position signals based on the buy or sell conditions.
|
|
|
|
Finally, `plotshape` is used to mark the buy and sell signals on the chart.
|
|
|
|
## Advantages
|
|
|
|
- Using Heikin-Ashi rate of change as trading signal, which captures price trend changes better than simple moving average etc.
|
|
- Issuing signals based on tiny 0.5% price changes, making it extremely sensitive and suitable for short-term trading
|
|
- Very simple and straightforward logic, easy to understand and implement
|
|
- Applicable to multiple timeframes, highly flexible
|
|
|
|
## Risks and Solutions
|
|
|
|
- Heikin-Ashi itself focuses more on short-term price action, prone to market noise and false signals
|
|
- Adjust parameters like only reacting to 1% or 2% changes to lower false signal rates
|
|
- Too sensitive, may over-trade frequently incurring higher fees
|
|
- Adjust holding period, e.g. 2 hours minimum each trade, to avoid high frequency trading
|
|
- Too many graphical markers cluttering the chart
|
|
- Hide plotshapes and only check signals from strategy log
|
|
|
|
## Optimization Directions
|
|
|
|
The main aspects to optimize this strategy:
|
|
|
|
1. Adjust price change threshold based on market volatility and trading style to find optimum parameters
|
|
2. Incorporate stop loss to limit max loss percentage per trade
|
|
3. Add filter with other indicators to avoid unnecessary trades during consolidation
|
|
4. Introduce position sizing for fixed quantity, exponential, grid trading etc.
|
|
5. Optimize entry mechanisms, avoid whipsaws, trade with trend or counter trend
|
|
|
|
## Conclusion
|
|
|
|
In summary, this is a very simple, low parameter, easy to understand short-term trading strategy. It catches price changes extremely fast, suitable for high frequency traders. But also need to control number of trades to reduce costs. With several optimization methods, it can achieve even better results.
|
|
|
|
[/trans]
|
|
|
|
|
|
|
|
> Source (PineScript)
|
|
|
|
``` javascript
|
|
/*backtest
|
|
start: 2022-12-11 00:00:00
|
|
end: 2023-12-17 00:00:00
|
|
period: 1d
|
|
basePeriod: 1h
|
|
exchanges: [{"eid":"Futures_Binance","currency":"BTC_USDT"}]
|
|
*/
|
|
|
|
//@version=4
|
|
strategy("Heikin-Ashi - Change 0.5% short Time Period", shorttitle="Heikin-Ashi - Change 0.5% short Time Period", overlay=true)
|
|
|
|
// Calculate 0.5% price change
|
|
priceChange = close / close[1] - 1
|
|
|
|
// Buy and Sell Signals
|
|
buyp = priceChange >= 0.005
|
|
sellp = priceChange <= -0.005
|
|
|
|
// Initialize position and track the current position
|
|
var int position = na
|
|
|
|
// Strategy entry conditions
|
|
buy_condition = buyp and (na(position) or position == -1)
|
|
sell_condition = sellp and (na(position) or position == 1)
|
|
|
|
if buy_condition
|
|
strategy.entry("Buy", strategy.long)
|
|
position := 1
|
|
|
|
if sell_condition
|
|
strategy.entry("Sell", strategy.short)
|
|
position := -1
|
|
|
|
// Plot Buy and Sell signals using plotshape
|
|
plotshape(series=buy_condition, title="Buy Signal", location=location.belowbar, color=color.green, style=shape.triangleup, size=size.small)
|
|
plotshape(series=sell_condition, title="Sell Signal", location=location.abovebar, color=color.red, style=shape.triangledown, size=size.small)
|
|
|
|
```
|
|
|
|
> Detail
|
|
|
|
https://www.fmz.com/strategy/435720
|
|
|
|
> Last Modified
|
|
|
|
2023-12-18 12:13:56
|