
308 lines
10 KiB
Markdown
308 lines
10 KiB
Markdown
|
|
> Name
|
|
|
|
基于随机数字的量化交易策略Quantitative-Trading-Strategy-Based-on-Random-Numbers
|
|
|
|
> Author
|
|
|
|
ChaoZhang
|
|
|
|
> Strategy Description
|
|
|
|
|
|
[trans]
|
|
|
|
## 概述
|
|
|
|
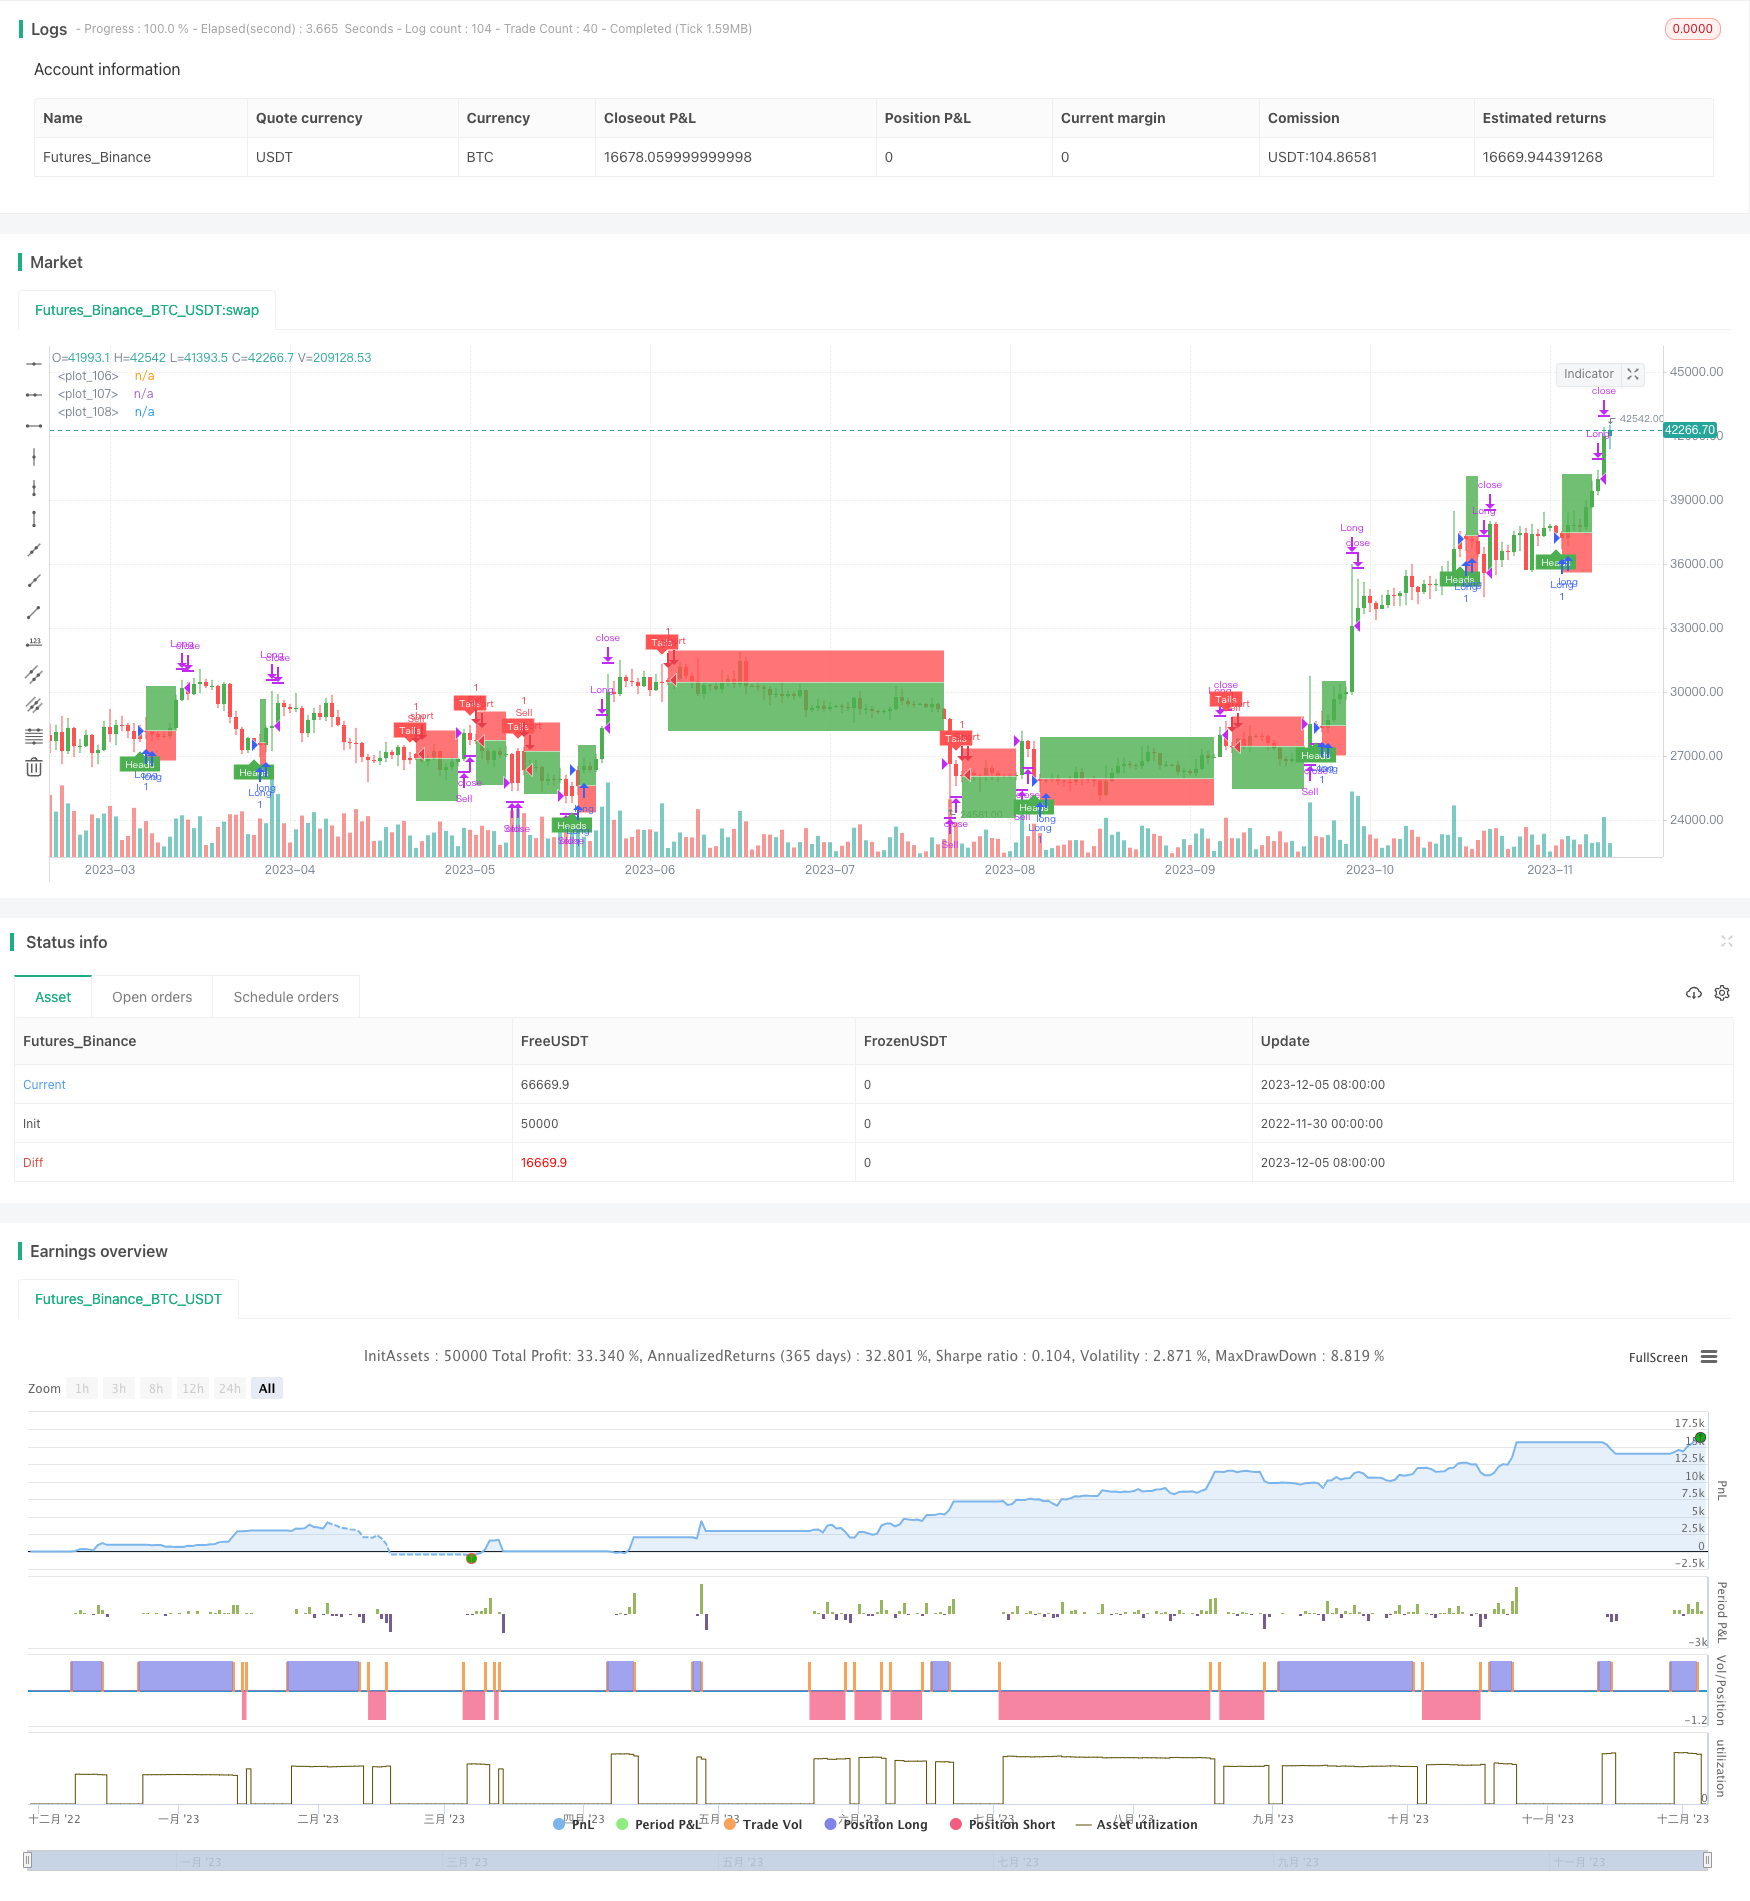
本策略的核心思想是利用随机数模拟硬币掷色子等概率事件,根据事件结果决定做多头或空头,从而实现随机交易。这种交易策略可以用于模拟测试,也可以作为基础框架用于更复杂的策略开发。
|
|
|
|
## 策略原理
|
|
|
|
1. 通过`flip`变量模拟随机事件,根据`coinLabel`随机数大小决定做多或做空。
|
|
|
|
2. 利用`risk`和`ratio`设置止损止盈线。
|
|
|
|
3. 按照设置的最大周期数随机触发下一次交易信号。
|
|
|
|
4. 通过`plotBox`变量控制是否显示平仓盒。
|
|
|
|
5. `stoppedOut`和`takeProfit`变量用于检测止损或止盈。
|
|
|
|
6. 提供回测功能测试策略表现。
|
|
|
|
## 优势分析
|
|
|
|
1. 代码结构清晰,易于理解和二次开发。
|
|
|
|
2. UI交互友好,各种参数都可以通过图形界面调整。
|
|
|
|
3. 随机性强,不受市场波动影响,可靠性高。
|
|
|
|
4. 可通过参数优化获得更好的收益回报率。
|
|
|
|
5. 可作为其他策略演示或测试使用。
|
|
|
|
## 风险分析
|
|
|
|
1. 随机交易无法对市场进行判断,存在一定盈利风险。
|
|
|
|
2. 无法确定最佳参数组合,需要反复测试。
|
|
|
|
3. 存在因随机信号过于密集而可能带来的超级相关风险。
|
|
|
|
4. 建议结合止损止盈机制以控制风险。
|
|
|
|
5. 可通过适当延长交易间隔来降低风险。
|
|
|
|
## 优化方向
|
|
|
|
1. 结合更复杂因子产生随机信号。
|
|
|
|
2. 增加交易品种,扩大测试范围。
|
|
|
|
3. 优化 UI 交互,增加策略控制功能。
|
|
|
|
4. 提供更多测试工具和指标,便于参数优化。
|
|
|
|
5. 可作为交易信号或止损止盈组件加入到其他策略。
|
|
|
|
|
|
## 总结
|
|
|
|
本策略总体框架完整,基于随机事件产生交易信号,可靠性较高。同时提供了参数调整、回测以及绘图功能。既可以用来测试新手开发策略,也可作为其他策略的基础模块。通过适当优化,可以使策略表现更加突出。
|
|
|
|
||
|
|
|
|
## Overview
|
|
|
|
The core idea of this strategy is to simulate probability events such as coin flipping and dice rolling using random numbers to determine long or short positions, thus implementing random trading. This kind of trading strategy can be used for simulation testing and also as a basic framework for more complex strategy development.
|
|
|
|
## Strategy Principle
|
|
|
|
1. Use the `flip` variable to simulate random events and determine long or short based on the `coinLabel` random number size.
|
|
|
|
2. Use `risk` and `ratio` to set stop loss and take profit lines.
|
|
|
|
3. Trigger the next trading signal randomly according to the set maximum cycle number.
|
|
|
|
4. Control whether to display the close position box through the `plotBox` variable.
|
|
|
|
5. `stoppedOut` and `takeProfit` variables are used to detect stop loss or take profit.
|
|
|
|
6. Provide backtesting capabilities to test strategy performance.
|
|
|
|
## Advantage Analysis
|
|
|
|
1. The code structure is clear and easy to understand and secondary develop.
|
|
|
|
2. The UI interaction is friendly and various parameters can be adjusted through the graphical interface.
|
|
|
|
3. The randomness is strong and not affected by market fluctuations, with high reliability.
|
|
|
|
4. Better return on investment can be obtained through parameter optimization.
|
|
|
|
5. Can be used as a demonstration or test for other strategies.
|
|
|
|
## Risk Analysis
|
|
|
|
1. Random trading cannot judge the market and there is a certain profit risk.
|
|
|
|
2. Unable to determine the optimal parameter combination, repeated testing is required.
|
|
|
|
3. There is a risk of super correlation that may result from overly dense random signals.
|
|
|
|
4. It is recommended to use stop loss and take profit mechanisms to control risks.
|
|
|
|
5. Risks can be reduced by appropriately extending the trading interval.
|
|
|
|
## Optimization Directions
|
|
|
|
1. Incorporate more complex factors to generate random signals.
|
|
|
|
2. Increase trading varieties to expand test scope.
|
|
|
|
3. Optimize UI interaction and increase strategy control capabilities.
|
|
|
|
4. Provide more test tools and indicators for parameter optimization.
|
|
|
|
5. Can be used as a trading signal or stop loss take profit component added to other strategies.
|
|
|
|
## Summary
|
|
|
|
The overall framework of this strategy is complete, generating trading signals based on random events, with high reliability. At the same time, it provides parameter adjustment, backtesting, and charting capabilities. It can be used to test novice strategy development, and also as a basic module for other strategies. Through appropriate optimization, the strategy performance can be further improved.
|
|
|
|
[/trans]
|
|
|
|
> Strategy Arguments
|
|
|
|
|
|
|
|
|Argument|Default|Description|
|
|
|----|----|----|
|
|
|v_input_1|false|------- Trade Activity -------|
|
|
|v_input_2|25|Max Bars between Coin Filps|
|
|
|v_input_3|false|------- Position Settings -------|
|
|
|v_input_4|5|Risk in % |
|
|
|v_input_5|1.5|Risk to Reward Ratio x:1 |
|
|
|v_input_6|false|------- Plot Options -------|
|
|
|v_input_7|true|Show Position Boxes|
|
|
|v_input_8|false|------- Back Testing -------|
|
|
|v_input_9|true|Run Strategy Back Test|
|
|
|v_input_10|false|Use Custom Date Range for back test|
|
|
|v_input_11|2021|Test Start Year|
|
|
|v_input_12|true|Test Start Month|
|
|
|v_input_13|true|Test Start Day|
|
|
|v_input_14|2021|Test Stop Year|
|
|
|v_input_15|5|Test Stop Month|
|
|
|v_input_16|true|Test Stop Day|
|
|
|
|
|
|
> Source (PineScript)
|
|
|
|
``` javascript
|
|
/*backtest
|
|
start: 2022-11-30 00:00:00
|
|
end: 2023-12-06 00:00:00
|
|
period: 1d
|
|
basePeriod: 1h
|
|
exchanges: [{"eid":"Futures_Binance","currency":"BTC_USDT"}]
|
|
*/
|
|
|
|
// This source code is subject to the terms of the Mozilla Public License 2.0 at https://mozilla.org/MPL/2.0/
|
|
// © melodicfish
|
|
|
|
//@version=4
|
|
strategy("Coin Flipper Pro",overlay=true,max_bars_back=100)
|
|
|
|
// ======= User Inputs variables=========
|
|
|
|
h1=input(title="------- Trade Activity -------",defval=false)
|
|
maxBars=input(25.0,title="Max Bars between Coin Filps",step=1.0,minval=4.0)
|
|
|
|
h2=input(title="------- Position Settings -------",defval=false)
|
|
risk=input(defval=5.0,title="Risk in % ",type=input.float, minval=0.001 ,step=0.1)
|
|
ratio= input(defval=1.5,title="Risk to Reward Ratio x:1 ",type=input.float, minval=0.001,step=0.1)
|
|
|
|
h3=input(title="------- Plot Options -------",defval=false)
|
|
showBox=input(defval=true, title="Show Position Boxes")
|
|
|
|
h4=input(title="------- Back Testing -------",defval=false)
|
|
runTest=input(defval=true, title="Run Strategy Back Test")
|
|
customTime=input(defval=false, title="Use Custom Date Range for back test")
|
|
|
|
|
|
tsYear = input(2021,minval=1000,maxval=9999,title= "Test Start Year")
|
|
tsMonth = input(1,minval=1,maxval=12,title= "Test Start Month")
|
|
tsDay = input(1,minval=1,maxval=31,title= "Test Start Day")
|
|
start = timestamp(tsYear,tsMonth,tsDay,0,0)
|
|
|
|
teYear = input(2021,minval=1000,maxval=9999,title= "Test Stop Year")
|
|
teMonth = input(5,minval=1,maxval=12,title= "Test Stop Month")
|
|
teDay = input(1,minval=1,maxval=31,title= "Test Stop Day")
|
|
end = timestamp(teYear,teMonth,teDay,0,0)
|
|
|
|
// ======= variables =========
|
|
var barsBetweenflips=25
|
|
var coinFlipResult=0.0
|
|
var flip=true
|
|
var coinLabel=0.0
|
|
var stoppedOut= true
|
|
var takeProfit=true
|
|
var posLive=false
|
|
var p1=0.0
|
|
var p2=0.0
|
|
var p3=0.0
|
|
var plotBox=false
|
|
var posType=0
|
|
long=false
|
|
short=false
|
|
|
|
|
|
// ===== Functions ======
|
|
|
|
getColor() =>
|
|
round(random(1,255))
|
|
|
|
|
|
// ===== Logic ========
|
|
if barssince(flip==true)>barsBetweenflips and posLive==false
|
|
flip:=true
|
|
coinLabel:=random(1,10)
|
|
|
|
// Candle Colors
|
|
candleColor= flip==true and flip[1]==false and barstate.isconfirmed==false?color.rgb(getColor(),getColor(),getColor(),0):flip==false and close>=open?color.green:color.red
|
|
candleColor:= barstate.ishistory==true and close>=open?color.green: barstate.ishistory==true and close<open? color.red:candleColor
|
|
barcolor(candleColor)
|
|
|
|
if flip[1]==true and posLive==false
|
|
flip:=false
|
|
barsBetweenflips:=round(random(3,round(maxBars)))
|
|
posLive:=true
|
|
|
|
long:= flip[1]==true and coinLabel[1]>=5.0
|
|
short:= flip[1]==true and coinLabel[1]<5.0
|
|
|
|
|
|
// Calculate Position Boxes
|
|
if long==true and posType!=1
|
|
|
|
riskLDEC=1-(risk/100)
|
|
p1:= close[1]*(1+((risk/100)*ratio)) // TargetLine
|
|
p2:=close[1]
|
|
p3:= close[1]*riskLDEC // StopLine
|
|
plotBox:=true
|
|
posType:=1
|
|
|
|
if short==true and posType!=-1
|
|
|
|
riskSDEC=1-((risk*ratio)/100)
|
|
p1:= close[1]*riskSDEC // TargetLine
|
|
p2:=close[1]
|
|
p3:= close[1]*(1+(risk/100)) // StopLine
|
|
plotBox:=true
|
|
posType:=-1
|
|
|
|
|
|
// Check Trade Status
|
|
stoppedOut:= posType==1 and long==false and low<= p3? true: posType==-1 and short==false and high>=p3? true: false
|
|
takeProfit:= posType==1 and long == false and high>= p1? true: posType==-1 and short==false and low<=p1? true: false
|
|
if stoppedOut==true or takeProfit==true
|
|
posType:=0
|
|
plotBox:=false
|
|
posLive:=false
|
|
|
|
|
|
// ====== Plots ========
|
|
plot1=plot(plotBox and showBox? p1:na,style=plot.style_linebr,color=color.white, transp= 100)
|
|
plot2=plot(plotBox and showBox? p2:na,style=plot.style_linebr,color=color.white, transp= 100)
|
|
plot3=plot(plotBox and showBox? p3:na,style=plot.style_linebr,color=color.white, transp= 100)
|
|
fill(plot1,plot2,color= color.green)
|
|
fill(plot2,plot3,color= color.red)
|
|
plotshape(flip==true and flip[1]==false and coinLabel>=5.0,style=shape.labelup,location=location.belowbar, color=color.green,size=size.tiny,title="short label",text="Heads",textcolor=color.white)
|
|
plotshape(flip==true and flip[1]==false and coinLabel<5.0,style=shape.labeldown,location=location.abovebar, color=color.red,size=size.tiny,title="short label",text="Tails",textcolor=color.white)
|
|
if stoppedOut==true
|
|
label.new(bar_index-1, p3, style=label.style_xcross, color=color.orange)
|
|
if takeProfit==true
|
|
label.new(bar_index-1, p1, style=label.style_flag, color=color.blue)
|
|
|
|
|
|
|
|
if runTest==true and customTime==false or runTest==true and customTime==true and time >= start and time <= end
|
|
strategy.entry("Sell", strategy.short,when=short==true)
|
|
strategy.close("Sell", comment="Close Short", when=stoppedOut==true or takeProfit==true)
|
|
strategy.entry("Long", strategy.long,when=long==true)
|
|
strategy.close("Long",comment="Close Long", when= stoppedOut==true or takeProfit==true )
|
|
|
|
|
|
|
|
|
|
```
|
|
|
|
> Detail
|
|
|
|
https://www.fmz.com/strategy/434600
|
|
|
|
> Last Modified
|
|
|
|
2023-12-07 17:14:20
|