
14 KiB
Name
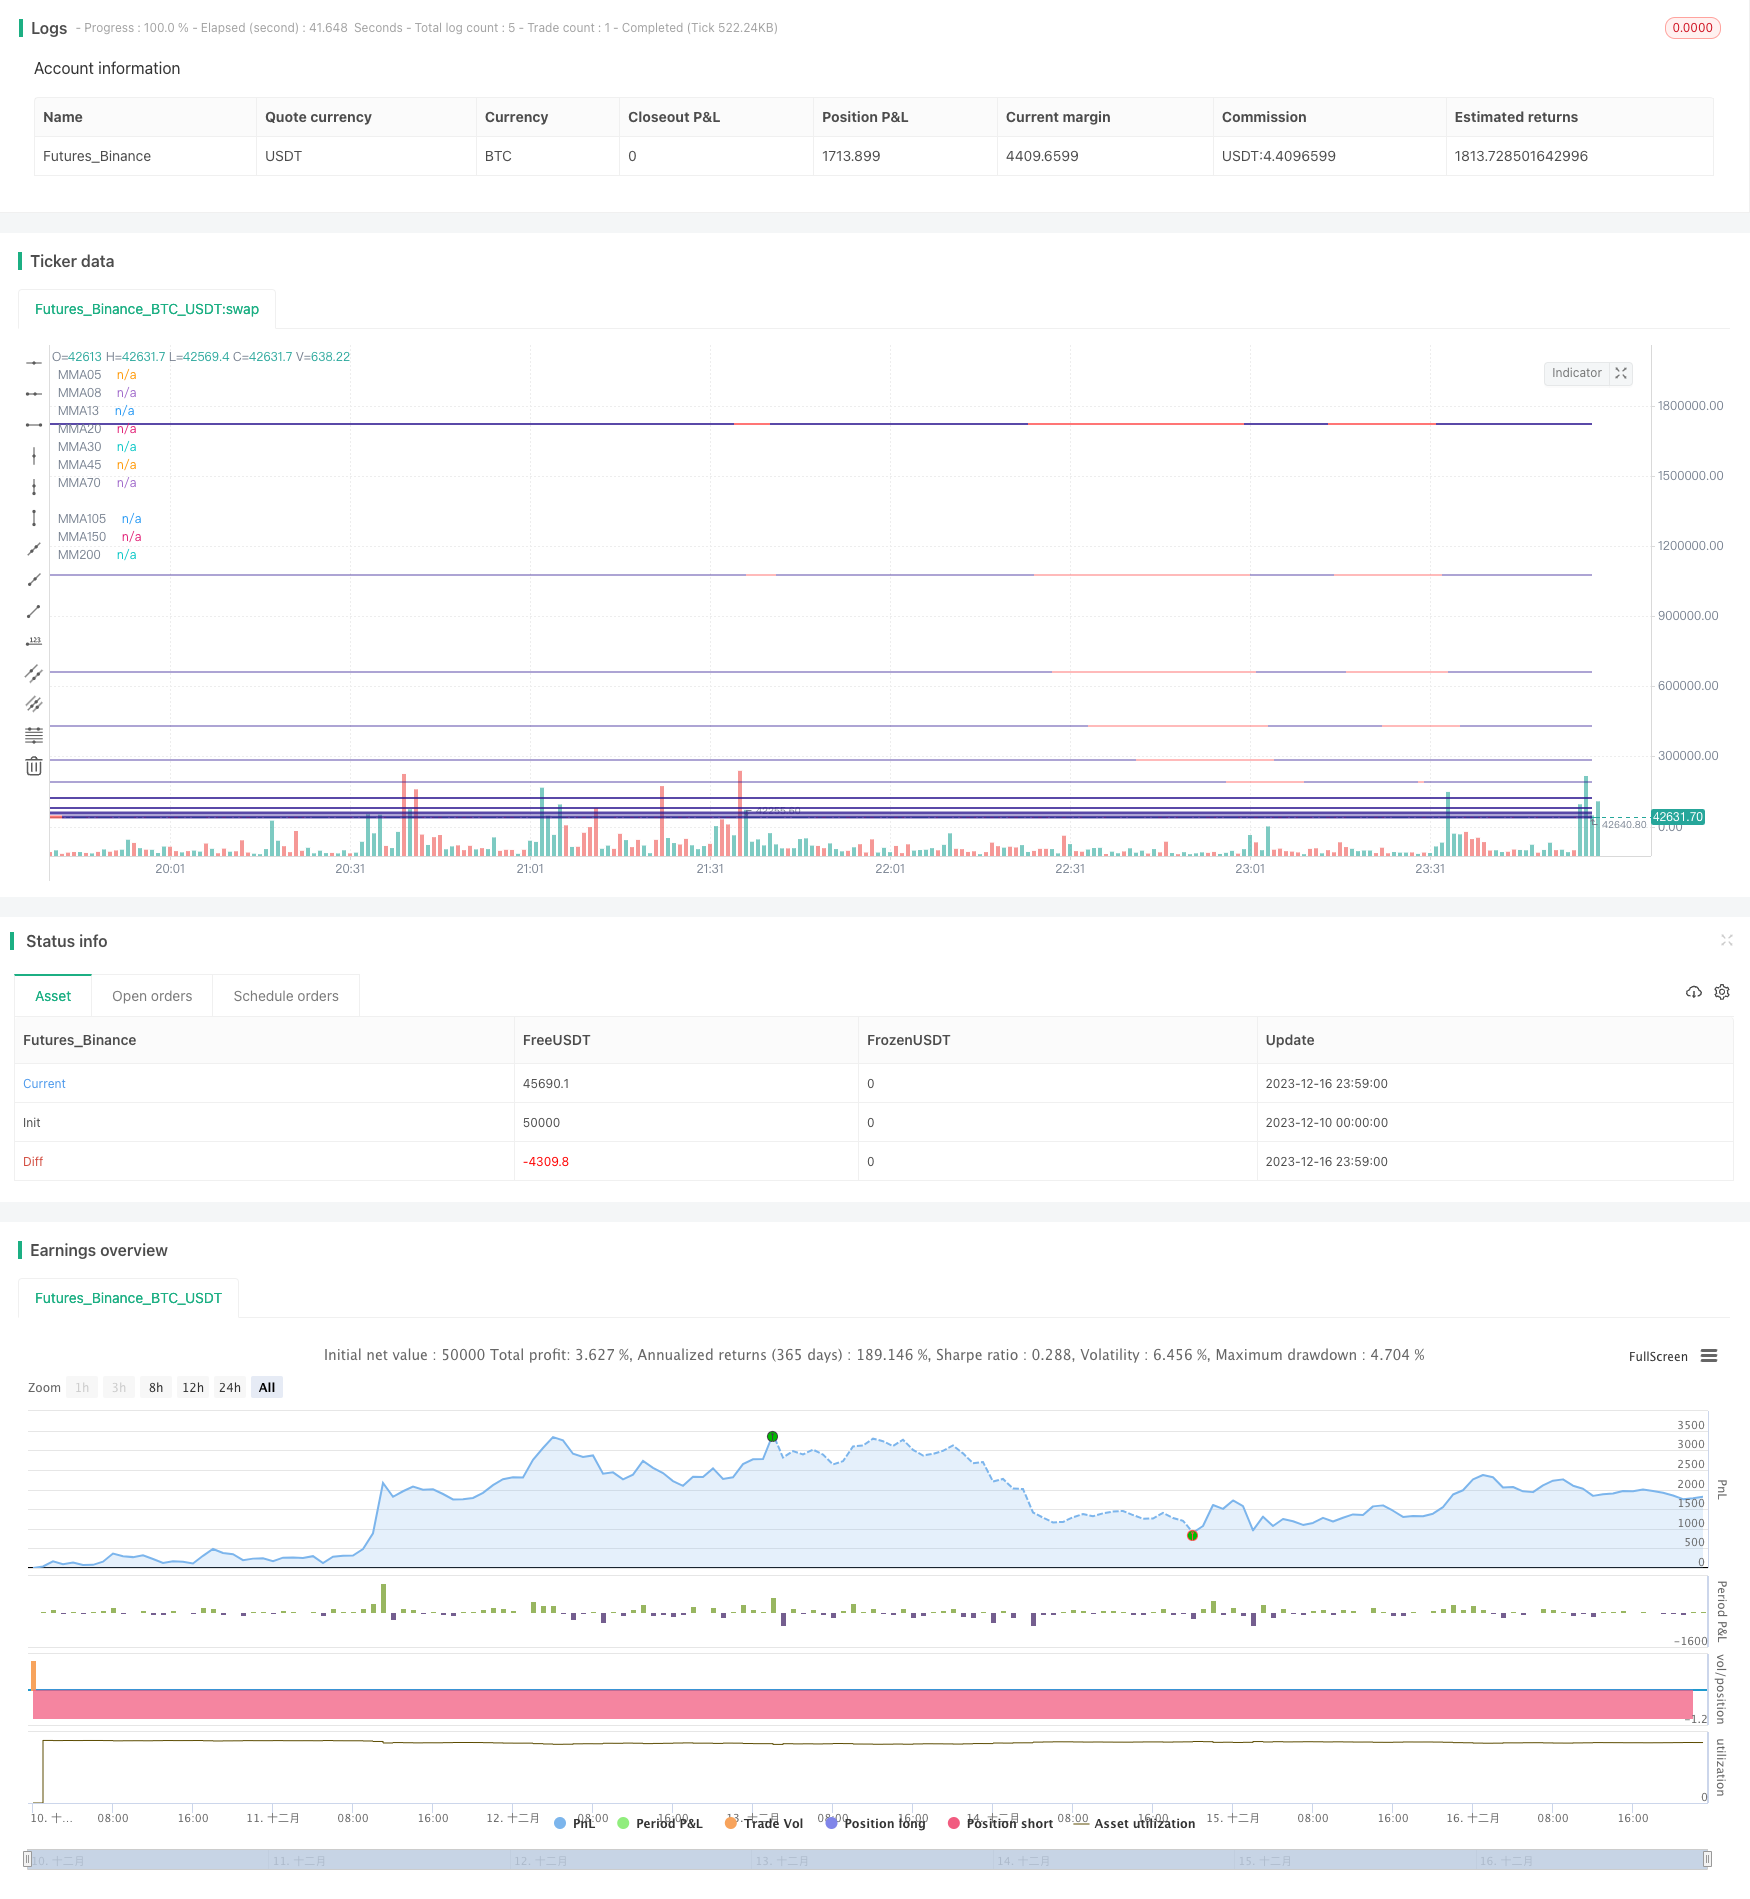
基于多个移动平均带策略Moving-Average-Ribbon-Strategy
Author
ChaoZhang
Strategy Description
 [trans]
概述
移动平均带策略是一种基于多个移动平均线的趋势跟踪策略。它会同时监控快速移动平均线和慢速移动平均线,当价格突破移动平均带时产生交易信号。该策略同时结合了趋势判断和超买超卖指标,可以有效地捕捉中长线趋势。
策略原理
该策略同时使用 5 个快速移动平均线(5日线、8日线、13日线、20日线和 30日线)和 4 个慢速移动平均线(45日线、70日线、105日线和 150日线),快速线组成内部的移动平均带,慢速线组成外部的移动平均带。当价格上穿内部平均带时产生买入信号,当价格下穿内部平均带时产生卖出信号。为了过滤假突破,它要求价格需要连续 3 根K线突破内部移动平均带,并且大部分快速移动平均线也同步突破,才会产生交易信号。
此外,该策略还会判断长期趋势。只有当价格处于 200 日移动平均线之上,才会考虑产生买入信号。反之,只有价格跌破 200 日移动平均线,才会考虑产生卖出信号。通过判断长期趋势,可以避免在盘整期间被套。
优势分析
该策略具有以下几个优势:
-
多重移动平均线设计,可以准确判断趋势方向。内外移动平均带结合快慢速均线,识别中长线趋势效果好。
-
连续突破机制可以有效过滤假突破。同时要求大部分快速均线突破,确保趋势变化。
-
判断长期趋势,避免在盘整中被套。配合 200 日线判断,只在趋势发生转折时才考虑建仓。
-
兼顾趋势跟踪和超买超卖。移动平均线本身具有趋势跟踪功能,又结合超买超卖指标设定止损点,风险控制到位。
风险分析
该策略主要存在以下风险:
-
突破失败风险。当价格出现假突破时,该策略无法完全避免亏损的产生。
-
震荡趋势下亏损风险。当行情长期震荡时,止损点可能会频繁被击中,导致亏损加大。
-
参数优化风险。移动平均线参数设置不当,也会导致交易信号产生误差,进而亏损加大。
对应解决方法:
-
适当放宽止损点,给予价格足够空间去运行。或者采用ljetrail 止损方式,让止损线随价格运行。
-
增加趋势判断指标,避免在震荡期无方向建仓。例如配合 DMI、MACD 等指标进行过滤。
-
借助历史回测和参数优化手段,选择最佳参数组合。实盘中也要跟踪参数效果,进行动态优化。
优化方向
该策略可以从以下几个维度进行优化:
-
优化移动平均线参数,选取最佳周期数。可以通过回测不同周期数的移动平均线,找到最佳参数组合。
-
增加趋势判断指标进行滤波。例如 RSI 指标判断超买超卖、布林带判断通道突破等。避免在趋势不明朗时盲目建仓。
-
采用自适应移动平均线。根据市场变化和波动率,实时优化移动平均线参数,使之更好地适应当前市场状态。
-
结合机器学习模型判断趋势概率。建立概率模型评估突破成功概率,助力决策系统判断入场时机。
-
优化止损策略,让止损更好跟踪价格。例如 traillig stop loss 或自动缩量止损等,让止损线更加智能。
总结
移动平均带策略是比较常见的趋势跟踪策略之一。它同时结合快速线和慢速线判断中长线趋势,并设定连续突破过滤机制来决定入场。该策略兼顾趋势跟踪和超买超卖判断,通过参数优化和指标增强,可以进一步提升运用效果。它适用于中长线持有的投资者。
||
Overview
The Moving Average Ribbon strategy is a trend following strategy based on multiple moving averages. It monitors fast and slow moving averages simultaneously, and generates trading signals when prices break through the moving average ribbon. The strategy combines trend determination and overbought/oversold indicators, which can effectively capture medium- and long-term trends.
Strategy Logic
The strategy uses 5 fast moving averages (5-, 8-, 13-, 20- and 30-day lines) and 4 slow moving averages (45-, 70-, 105- and 150-day lines). The fast lines form an inner moving average ribbon and the slow lines form an outer moving average ribbon. A buy signal is generated when prices break above the inner ribbon, and a sell signal is generated when prices break below the inner ribbon. To filter out false breaks, it requires prices to break through the inner ribbon for 3 consecutive candles, and most of the fast moving averages also break through synchronously before generating trading signals.
In addition, the strategy also judges long-term trends. It only considers generating buy signals when prices are above the 200-day moving average. On the contrary, it only considers generating sell signals when prices break below the 200-day moving average. By determining long-term trends, it prevents being trapped during consolidations.
Advantage Analysis
The strategy has the following advantages:
-
The multi-moving average design can accurately determine trend direction. The combination of inner and outer moving average ribbons with fast and slow lines works well in identifying medium- to long-term trends.
-
The consecutive break mechanism can effectively filter out false breaks. Meanwhile, requiring most fast moving averages to break through ensures the trend is changing.
-
Judging long-term trends avoids being trapped during consolidations. Using the 200-day line to determine allows opening positions only when trends start to reverse.
-
Balances trend following and overbought/oversold conditions. The moving averages themselves have trend following ability, while combining overbought/oversold indicators to set stop loss points ensures good risk control.
Risk Analysis
The main risks of this strategy includes:
-
Failed breakout risk. When false breakouts occur, the strategy cannot completely avoid losses.
-
Loss risk during ranging trends. When the market ranges for long periods, stop loss points may be frequently hit, leading to larger losses.
-
Parameter optimization risk. Improper settings of moving average parameters can also lead to errors in trading signals, resulting in greater losses.
The corresponding solutions are:
-
Appropriately widen the stop loss points to give prices enough space to move. Or adopt a trailing stop loss method to allow stop loss line to follow prices.
-
Add trend judging indicators to avoid establishing positions without direction during consolidations. Such as filtering with DMI, MACD and other indicators.
-
Use historical backtesting and parameter optimization methods to select the best parameter combinations. Also track parameter effectiveness in real trading and make dynamic optimizations.
Optimization Directions
The strategy can be optimized in the following aspects:
-
Optimize moving average parameters to select the best cycle numbers. Run backtests of moving averages with different cycle numbers to find the optimal parameter combination.
-
Add trend judging indicators for filtering. Such as RSI for overbought/oversold, Bollinger Bands for channel breakouts etc. Avoid establishing positions blindly when trends are unclear.
-
Adopt adaptive moving averages. Optimize moving average parameters dynamically according to changing market conditions and volatility, so that they fit better to current market states.
-
Combine machine learning models to judge trend probabilities. Establish probability models to evaluate chances of a successful breakout, assisting the decision system in judging ideal entry timing.
-
Optimize stop loss strategies for better tracking of prices. Such as trailing stop loss or dynamic position sizing stop loss to make stop loss line more intelligent.
Summary
The Moving Average Ribbon strategy is one of the more common trend following strategies. It combines fast and slow lines to judge medium- and long-term trends, and sets consecutive breakout mechanisms to decide entries. The strategy balances trend following and overbought/oversold conditions. With parameter optimization and indicator enhancement, its performance can be further improved. It suits investors who hold mid- to long-term positions.
[/trans]
Strategy Arguments
| Argument | Default | Description |
|---|---|---|
| v_input_1_close | 0 | Source: close |
| v_input_2 | trima | Input one in lowercase: sma, ema, wma, trima, zlema, dema, tema, or hma |
Source (PineScript)
//@version=4
strategy(title="Moving Average Ribbon", shorttitle="MA Ribbon", overlay=true)
src = input(close, type=input.source, title="Source")
matype = input(title="Input one in lowercase: sma, ema, wma, trima, zlema, dema, tema, or hma", type=input.string, defval="trima")
// possible values: sma, ema, wma, trima, zlema, dema, tema, hma (hull ma)


trima(_src, _len) =>
    sma(sma(_src, _len), _len)
hma(_src, _len) =>
    wma(2 * wma(_src, _len / 2) - wma(_src, _len), round(sqrt(_len)))
dema(_src, _len) =>
    2 * ema(_src, _len) - ema(ema(_src, _len), _len)
tema(_src, _len) =>
    3 * ema(_src, _len) - 3 * ema(ema(_src, _len), _len) +
       ema(ema(ema(_src, _len), _len), _len)
zlema(_src, _len) =>
    ema(_src, _len) + ema(_src, _len) - ema(ema(_src, _len), _len)

ma(_src, _len) =>
    hma__1 = hma(_src, _len)
    ema_1 = ema(_src, _len)
    sma_1 = sma(_src, _len)
    wma_1 = wma(_src, _len)
    trima__1 = trima(_src, _len)
    zlema__1 = zlema(_src, _len)
    dema__1 = dema(_src, _len)
    tema__1 = tema(_src, _len)
    matype == "hma" ? hma__1 : matype == "ema" ? ema_1 : matype == "sma" ? sma_1 :
       matype == "wma" ? wma_1 : matype == "trima" ? trima__1 :
       matype == "zlema" ? zlema__1 : matype == "dema" ? dema__1 : tema__1

ma05 = ma(src, 5)
ma08 = ma(src, 8)
ma13 = ma(src, 13)
ma20 = ma(src, 20)
ma30 = ma(src, 30)
ma45 = ma(src, 45)
ma70 = ma(src, 70)
ma105 = ma(src, 105)
ma150 = ma(src, 150)
ma200 = ma(src, 200)


maColor(ma, maRef) =>
    if change(ma) <= 0 and ma05 < maRef
        color.new(color.red, 20)
    else
        if change(ma) >= 0 and ma05 > maRef
            color.new(color.navy, 20)
        else
            if change(ma) < 0 and ma05 > maRef
                color.new(color.red, 20)
            else
                if change(ma) >= 0 and ma05 < maRef
                    color.new(color.navy, 20)
                else
                    color.gray


aboveConfirmed(x,maRef)=>
    above=true
    for i=1 to x
        if close[i]<maRef[i] and not (close[i]>ma200[i]*1.01) and not (ma05[i]>ma105[i]*1.015)
            above:=false
    above


aboveMost(x,len)=>
    above=0
    boolean=false
    if close[len]>ma05[len]
        above:=above+1
    if close[len]>ma08[len]
        above:=above+1
    if close[len]>ma13[len]
        above:=above+1
    if close[len]>ma20[len]
        above:=above+1
    if close[len]>ma30[len]
        above:=above+1
    if close[len]>ma45[len]
        above:=above+1
    if close[len]>ma70[len]
        above:=above+1
    if close[len]>ma105[len]
        above:=above+1
    if close[len]>ma150[len]
        above:=above+1
    if close[len]>ma200[len]
        above:=above+1
    if(above>=x)
        boolean:=true
    boolean

belowMost(x,len)=>
    above=0
    boolean=false
    if close[len]<ma05[len]
        above:=above+1
    if close[len]<ma08[len]
        above:=above+1
    if close[len]<ma13[len]
        above:=above+1
    if close[len]<ma20[len]
        above:=above+1
    if close[len]<ma30[len]
        above:=above+1
    if close[len]<ma45[len]
        above:=above+1
    if close[len]<ma70[len]
        above:=above+1
    if close[len]<ma105[len]
        above:=above+1
    if close[len]<ma150[len]
        above:=above+1
    if close[len]<ma200[len]
        above:=above+1
    if(above>=x)
        boolean:=true
    boolean


belowConfirmed(x,maRef)=>
    below=true
    for i=1 to x
        if close[i]>maRef[i] and not (close[i]<maRef[i]*0.99) and not (ma05[i]<ma105[i]*0.985)
            below:=false
    below


//plotshape(aboveConfirmed(5,ma150),color=color.navy,location=location.abovebar,style=shape.triangleup,size=size.large,title="above",text="above")

plot(ma05, color=maColor(ma05, ma150), style=plot.style_line, title="MMA05", linewidth=2)
plot(ma08, color=maColor(ma08, ma150), style=plot.style_line, title="MMA08", linewidth=1)
plot(ma13, color=maColor(ma13, ma150), style=plot.style_line, title="MMA13", linewidth=1)
plot(ma20, color=maColor(ma20, ma150), style=plot.style_line, title="MMA20", linewidth=1)
plot(ma30, color=maColor(ma30, ma150), style=plot.style_line, title="MMA30", linewidth=1)
plot(ma45, color=maColor(ma45, ma200), style=plot.style_line, title="MMA45", linewidth=1)
plot(ma70, color=maColor(ma70, ma200), style=plot.style_line, title="MMA70", linewidth=2)
plot(ma105, color=maColor(ma105, ma200), style=plot.style_line, title="MMA105", linewidth=2)
plot(ma150, color=maColor(ma150, ma200), style=plot.style_line, title="MMA150", linewidth=3)
plot(ma200, color=maColor(ma200, ma200), style=plot.style_line, title="MM200", linewidth=3)


closeLong=belowMost(6,1) and belowMost(6,2) and belowMost(6,3)
closeShort=aboveMost(6,1) and aboveMost(6,2) and aboveMost(6,3)

isAbove=aboveConfirmed(5,ma200)
strategy.entry("short", false, when=belowConfirmed(3,ma200) and belowMost(8,1) and belowMost(8,2) and belowMost(8,3))
strategy.entry("long", true, when=aboveConfirmed(3,ma200) and aboveMost(8,1) and aboveMost(8,2) and aboveMost(8,3))


strategy.close("long",when=closeLong)
strategy.close("short",when=closeShort)
Detail
https://www.fmz.com/strategy/435723
Last Modified
2023-12-18 12:29:19