
18 KiB
Name
双向压力量化交易策略Dual-Pressure-Quantitative-Trading-Strategy
Author
ChaoZhang
Strategy Description
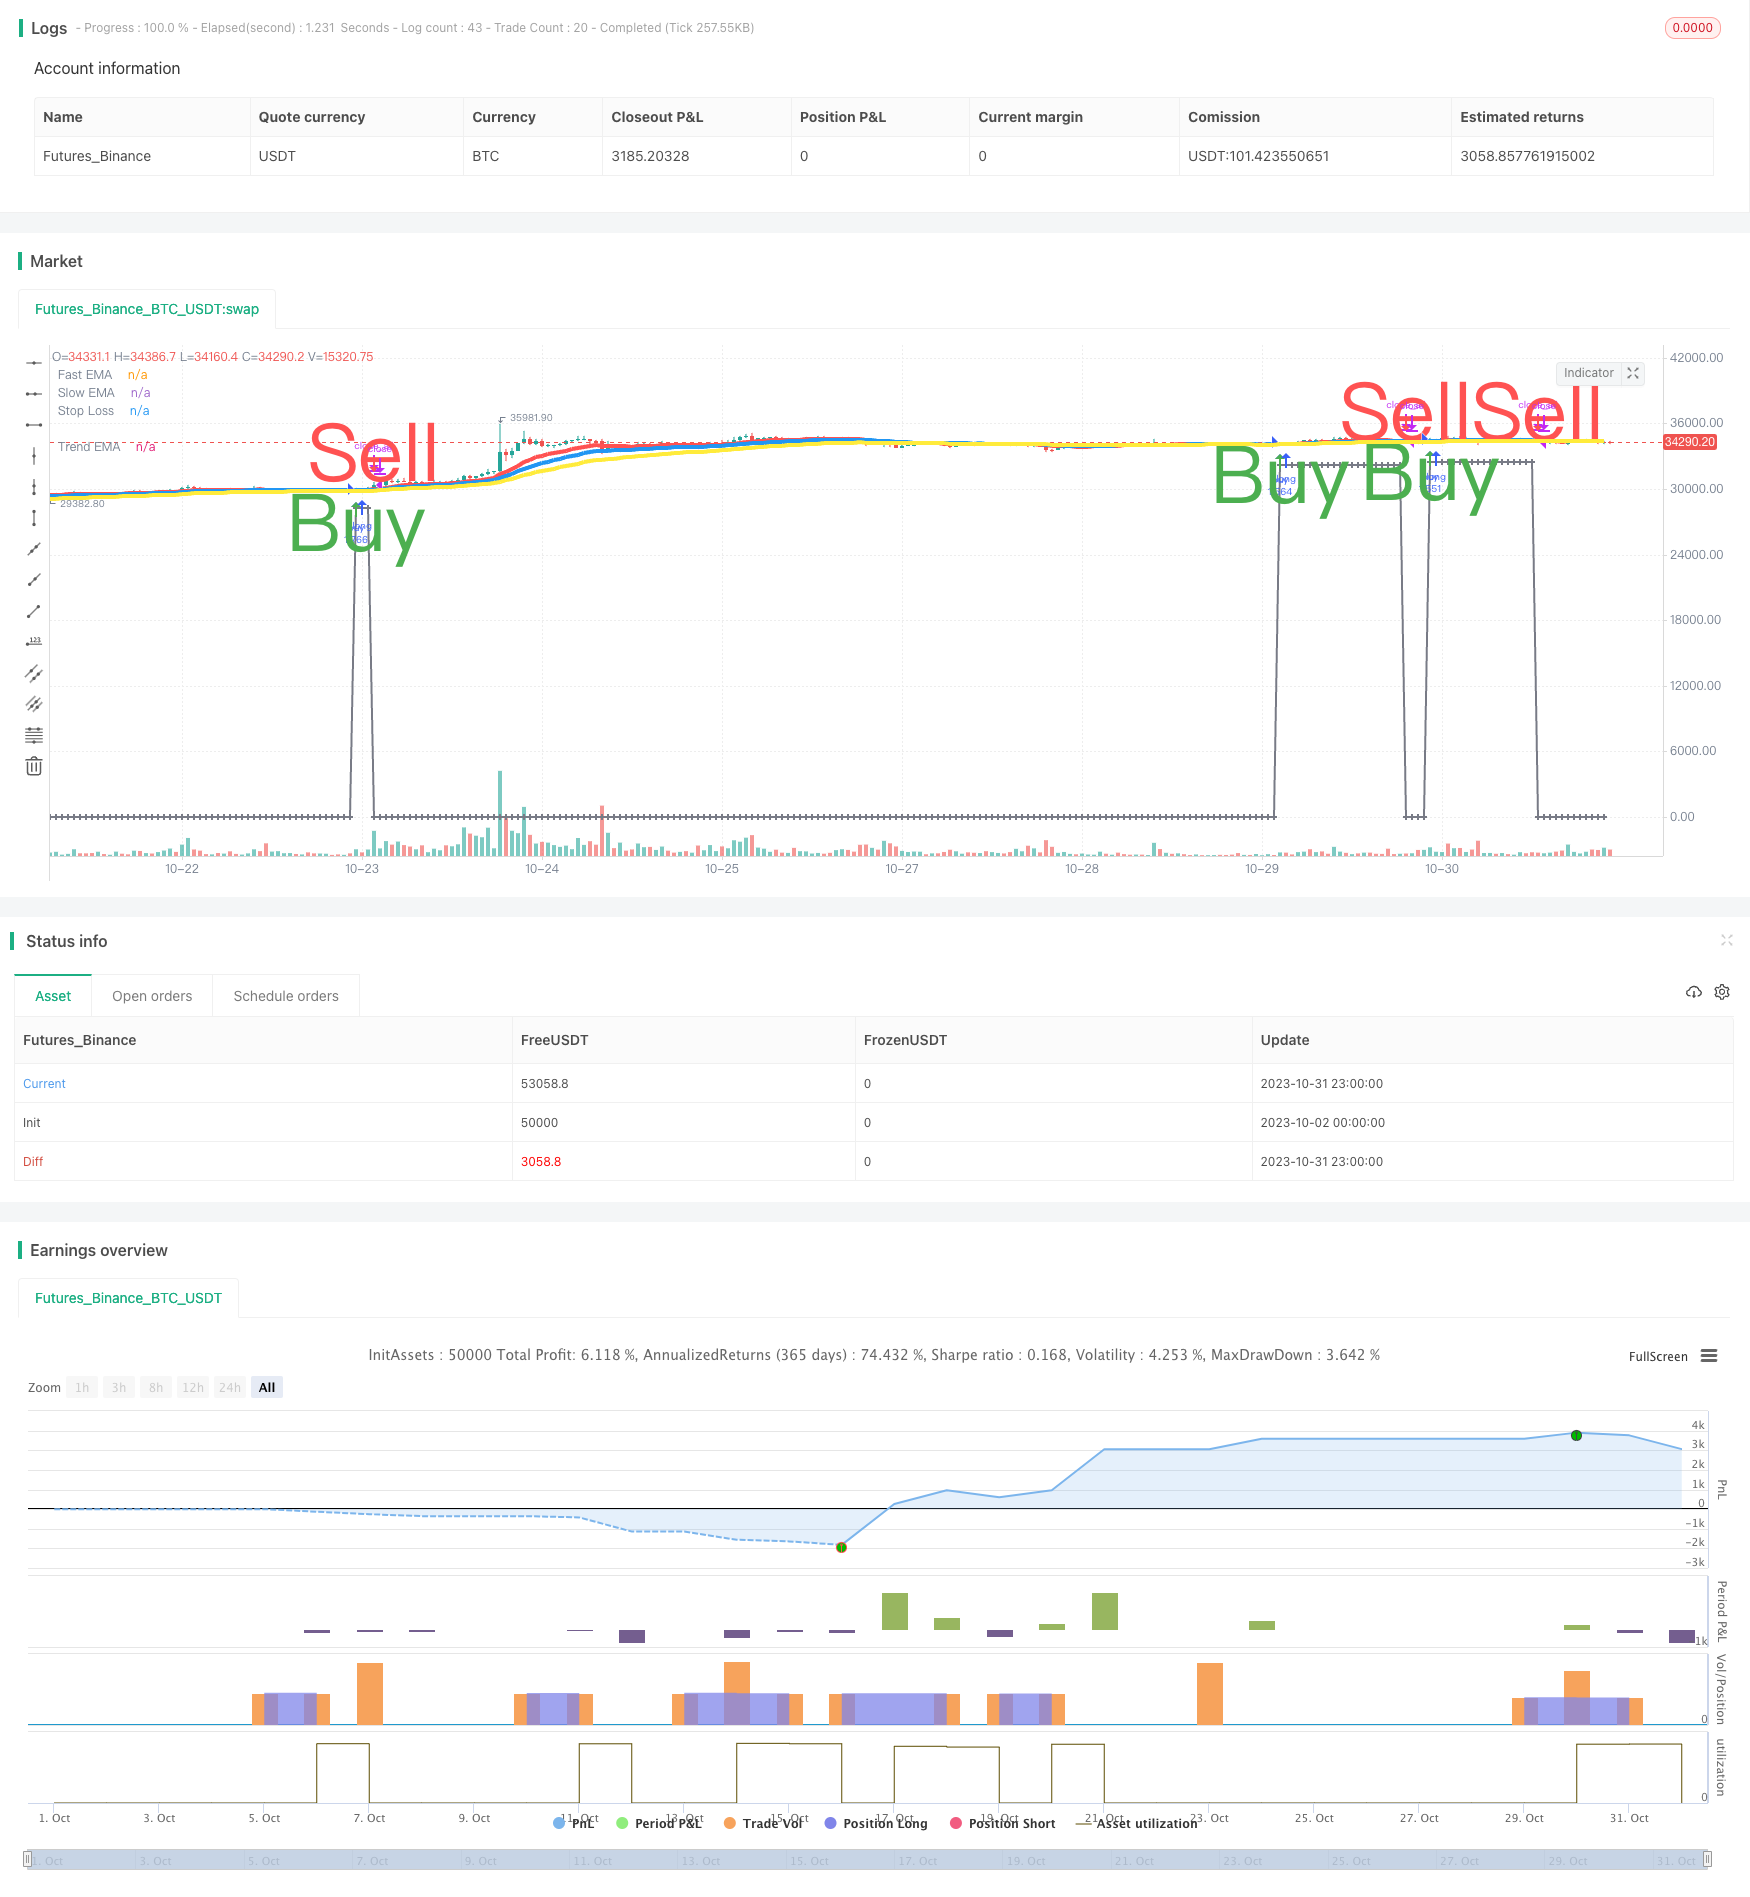 [trans]
概述
双向压力量化交易策略是一种结合随机指标和成交量指标的趋势跟踪策略。该策略主要使用随机指标K和D线以及成交量指标来产生买入和卖出信号,辅以均线金叉和死叉产生额外信号。
策略原理
买入信号
买入信号的主要触发逻辑是:
-
K线和D线同时下破超卖区域 (例如20),并产生向上交叉,且K线和D线同时处于上升趋势
-
成交量高于一定阈值 (例如1.4倍平均成交量)
-
收盘价高于开盘价 (白色K线)
额外的买入信号还可能来自:
-
均线金叉:快速EMA线上穿慢速EMA线,且两条均线同时上升
-
K线和D线同时由低位进入超卖区域 (例如由20下面上升进入20到80区间)
卖出信号
卖出信号的主要触发逻辑是:
-
K线和D线同时进入超卖区域 (例如80)
-
均线死叉:快速EMA线下穿慢速EMA线
-
K线下穿D线,且K线和D线同时处于下降趋势
止损信号
设置买入价格的一定百分比 (例如6%) 作为止损线,如果价格跌破该线则触发止损卖出。
策略优势分析
- 使用双随机指标避免假信号
- 结合成交量过滤噪音,确保趋势性
- 多种信号叠加,提高准确率
- 均线辅助判断大趋势方向
- 设定止损策略控制风险
优势1:双随机指标避免假信号
单一随机指标可能产生大量假信号。该策略采用K线和D线(K线的移动均线)双随机指标组合,可以有效过滤假信号,确保信号的可靠性。
优势2:成交量过滤噪音,确保趋势性
加入成交量条件作为辅助判断标准,要求成交量需要超过一定水平,从而过滤低量的非趋势性买卖点,减少被套仓的风险。
优势3:多种信号叠加,提高准确率
策略汇总了随机指标、成交量指标、均线指标多个买卖信号,这些信号需要同时触发才产生真正的交易信号。多种指标叠加可以提高信号的可靠性。
优势4:均线辅助判断大趋势方向
加入均线判断规则,例如只有在快慢均线同时上升时才考虑买入信号。这可以避免逆势买入或追顶,从大时间周期判断趋势。
优势5:设定止损策略控制风险
策略含有止损信号设计,如果价格跌破买入时的一定比例则自动止损。这可以有效控制单次交易的最大损失。
风险分析
- 策略参数需要精心调试,不当设置可能导致表现不佳
- 止损点设置需要考虑跳空风险
- 需关注交易品种的流动性风险
- 需留意多时间周期指标的位序风险
风险1:策略参数需要精心调试
该策略包含多个参数,如随机指标参数、均线参数、成交量参数等。这些参数需要针对不同品种进行优化,不当设置可能导致结果差强人意。
风险2:止损点设置需考虑跳空风险
设置止损点时,需要考虑价格跳空的可能性。如果止损点过于接近买入价格,可能会被跳空导致不必要的止损。
风险3:需关注交易品种的流动性风险
对于流动性较差的品种,成交量规则可能会过滤掉过多信号。此时需要降低成交量条件的限制。
风险4:需留意多时间周期指标的位序风险
不同周期指标之间可能会产生位序不一致的问题,这可能影响信号的准确性。需要验证信号点位序一致。
优化方向
该策略可以从以下几个方面进行优化:
-
优化参数以提高稳定性
-
加入机器学习方法动态调整参数
-
优化止损策略降低止损率
-
加入更多过滤条件减少交易次数
-
尝试条件单或止盈策略提高收益率
方向1:优化参数以提高稳定性
可以通过更系统的方法如遗传算法对主要参数进行优化,确保参数在不同市场周期中都可以获得稳定的表现。
方向2:加入机器学习方法动态调整参数
可以训练模型实时评估市场状态,并据此调整策略参数,实现参数的动态优化。
方向3:优化止损策略降低止损率
可以研究更好的止损策略,在保持风险控制的同时,尽可能减少不必要的止损,提高盈利空间。
方向4:加入更多过滤条件减少交易次数
适当加强过滤条件来减少交易次数,降低交易成本的影响,使每次交易的回报更高。
方向5:尝试条件单或止盈策略提高收益率
可以根据行情特点,设计条件单策略或移动止盈策略,在保证止损的同时,尽可能在利润最大化点平仓。
总结
该策略综合考量了趋势判断、风险控制、交易频率等多个方面。核心优势是双随机指标结合成交量指标判断趋势,以及风险控制的止损机制。下一步可以从提高参数稳定性、动态调整参数、降低止损率等方面进行优化,使策略在更多市场环境中都能获得稳定收益。
||
Overview
The Dual Pressure quantitative trading strategy is a trend following strategy that combines Stochastic and volume indicators. It mainly uses the Stochastic K and D lines together with volume indicators to generate buy and sell signals, complemented by moving average crosses for additional signals.
Strategy Logic
Buy Signals
The main buy signal triggers when:
-
Both K and D lines cross below oversold area (e.g. 20) and turn up, and both K and D are rising
-
Volume is above a threshold (e.g. 1.4 times average volume)
-
Close is above open (white candle)
Additional buy signals can come from:
-
Golden cross: Fast EMA crosses above slow EMA, both rising
-
Both K and D rise from low into middle zone (e.g. from below 20 to 20-80)
Sell Signals
Main sell signals trigger when:
-
Both K and D enter overbought area (e.g. above 80)
-
Death cross: Fast EMA crosses below slow EMA
-
K crosses below D, and both K and D are falling
Stop Loss
A percentage (e.g. 6%) below buy price is set as stop loss level. Falling below triggers stop loss.
Advantage Analysis
- Dual stochastic avoids false signals
- Volume filters noise and ensures trend
- Multiple signals combined improve accuracy
- Moving averages assist overall trend
- Stop loss controls risk
Advantage 1: Dual Stochastic Avoids False Signals
Single stochastic can generate many false signals. The dual stochastic combination filters false signals and improves reliability.
Advantage 2: Volume Filters Noise and Ensures Trend
The volume condition filters low volume non-trending spots and reduces risk of being trapped.
Advantage 3: Multiple Signals Improve Accuracy
Multiple indicators must align to trigger real trading signals. This improves signal reliability.
Advantage 4: Moving Averages Assist Overall Trend
Rules like dual moving averages ensure signals align with overall trend. This avoids counter-trend trades.
Advantage 5: Stop Loss Controls Risk
The stop loss logic realizes profits and controls loss on single trades.
Risk Analysis
- Parameters need careful optimization, improper settings lead to poor performance
- Stop loss placement must consider gap risk
- Liquidity risk should be monitored for trading instruments
- Lookback issue between different timeframes
Risk 1: Parameters Need Careful Optimization
The strategy has multiple parameters. They need optimization for different instruments, otherwise performance suffers.
Risk 2: Stop Loss Placement Must Consider Gap Risk
The stop loss point should account for price gapping scenarios. It should not be too close to buy price.
Risk 3: Monitor Liquidity Risk
For illiquid instruments, volume rules may filter too many signals. Volume thresholds need to be relaxed.
Risk 4: Lookback Issue Between Timeframes
Misalignment between signals on different timeframes may happen. Signals must be verified to match.
Enhancement Opportunities
The strategy can be enhanced in areas like:
-
Optimize parameters for robustness
-
Introduce machine learning for adaptive parameters
-
Improve stop loss strategy to reduce stop loss rate
-
Add filters to reduce trade frequency
-
Explore conditional orders or profit taking to improve reward
Opportunity 1: Optimize Parameters for Robustness
Methods like genetic algorithms can systematically optimize parameters for stability across market regimes.
Opportunity 2: Introduce Machine Learning for Adaptive Parameters
Models can assess market conditions and adjust parameters accordingly, achieving dynamic optimization.
Opportunity 3: Improve Stop Loss Strategy to Reduce Stop Loss Rate
Better stop loss algorithms can reduce unnecessary stops while maintaining risk control.
Opportunity 4: Add Filters to Reduce Trade Frequency
Strengthening filters can reduce trade frequency, lower costs, and improve per trade returns.
Opportunity 5: Explore Conditional Orders or Profit Taking
According to market conditions, conditional orders or profit taking strategies can better maximize profit while controlling risk.
Conclusion
The strategy balances trend, risk control, costs and other aspects. The core advantages are dual stochastic plus volume for trend and stop loss for risk control. Next steps are to enhance robustness, adaptive parameters, stop loss optimization etc. to yield steady profits in more market regimes.
[/trans]
Strategy Arguments
| Argument | Default | Description |
|---|---|---|
| v_input_1 | true | From Day |
| v_input_2 | true | From Month |
| v_input_3 | 2018 | From Year |
| v_input_4 | 31 | To Day |
| v_input_5 | 12 | To Month |
| v_input_6 | 2030 | To Year |
| v_input_7 | 14 | Stoch K |
| v_input_8 | 3 | Stoch D |
| v_input_9 | 80 | Stoch Overbuying Zone |
| v_input_10 | 20 | Stoch Overselling Zone |
| v_input_11 | 14 | Fast EMA (Death Cross) |
| v_input_12 | 23 | Slow EMA (Death Cross) |
| v_input_13 | 40 | Slowest EMA (Trend Test) |
| v_input_14 | 20 | Volume Periods |
| v_input_15 | 80 | Min Volume/Media Increase (%) |
| v_input_16 | 6 | [Sell Trigger] Stop Loss Threshold % |
Source (PineScript)
/*backtest
start: 2023-10-02 00:00:00
end: 2023-11-01 00:00:00
period: 1h
basePeriod: 15m
exchanges: [{"eid":"Futures_Binance","currency":"BTC_USDT"}]
*/

//@version=3
// SW SVE - Stochastic+Vol+EMAs [Sergio Waldoke]
// Script created by Sergio Waldoke (BETA VERSION v0.5, fine tuning PENDING)
// Stochastic process is the main source of signals, reinforced on buying by Volume. Also by Golden Cross.
// Selling is determined by K and D entering overselling zone or EMA's Death Cross signal, the first occurring,
// and some other signals combined.
// Buy Long when you see a long buy arrow.
// Sell when you see a close arrow.
// This is a version to be tuned and improved, but already showing excelent results after tune some parameters
// according to the kind of market.
// Strategy ready for doing backtests.

// SVE SYSTEM DESIGN:
// Buy Signal Trigger:
// - Both Stoch <= 20 crossing up and both growing and green candle and Vol/sma vol >= 1.40 Avg Vol
//   or
// - Both Stoch growing up and Vol/sma vol >= 1.40 Avg Vol and green candle and
//   both prior Stoch crossing up
//   or
//   [OPTIONAL]: (Bad for BTC 2018, excelent for 2017)
// - Crossingover(fast_ema, slow_ema) and growing(fast_ema) and growing(slow_ema) and green candle

// Exit position:
// - Both Stoch <= 20 and Both Stoch were > 20 during position
//   or
// - CrossingUnder(Fast EMA, Medium EMA)
//   or   [OPTIONAL] (Better for BTC 2018, Worse for BNB 1H)
// - CrossingUnder(k, d) and (k and d starting over over_buying) and (k and d descending) and k crossing down over_buying line

//calc_on_every_tick=true,
//calc_on_order_fills=true,   (affects historical calculation, triggers in middle of the bar, may be better for automatic orders)
strategy("SW SVE - Stochastic+Vol+EMAs [Sergio Waldoke]", shorttitle="SW SVE", overlay=true, max_bars_back=5000,
         default_qty_type=strategy.percent_of_equity, default_qty_value=100, currency="USD",
         commission_type=strategy.commission.percent, commission_value=0.25)

//Strategy Parameters
FromDay   = input(defval = 1, title = "From Day", minval = 1, maxval = 31)
FromMonth = input(defval = 1, title = "From Month", minval = 1, maxval = 12)
FromYear  = input(defval = 2018, title = "From Year", minval = 2009, maxval = 2200)
ToDay     = input(defval = 31, title = "To Day", minval = 1, maxval = 31)
ToMonth   = input(defval = 12, title = "To Month", minval = 1, maxval = 12)
ToYear    = input(defval = 2030, title = "To Year", minval = 2009, maxval = 2200)

//Indicator Parameters
//Original defaults for 4HS: 14, 3, 80, 20,   14, 23, 40,   20, 40,   3:
stoch_k = input(title="Stoch K",  defval=14, minval=1)
stoch_d = input(title="Stoch D",  defval=3, minval=1)
over_buying  = input(title="Stoch Overbuying Zone",  defval=80, minval=0, maxval=100)
over_selling = input(title="Stoch Overselling Zone",  defval=20, minval=0, maxval=100)

fast_ema_periods = input(title="Fast EMA (Death Cross)",  defval=14, minval=1, maxval=600)
slow_ema_periods = input(title="Slow EMA (Death Cross)",  defval=23, minval=1, maxval=600)
trend_ema_periods = input(title="Slowest EMA (Trend Test)",  defval=40, minval=1, maxval=600)

volume_periods = input(title="Volume Periods",  defval=20, minval=1, maxval=600)
volume_factor = input(title="Min Volume/Media Increase (%)",  defval=80, minval=-100) / 100 + 1

threshold_sl_perc = input(title="[Sell Trigger] Stop Loss Threshold %", defval=6.0, type=float, minval=0, maxval=100)

//before_buy = input(title="# Growing Before Buy",  defval=2, minval=1)
//before_sell = input(title="# Decreasing Before Sell",  defval=1, minval=1)
//stepsignal = input(title="Show White Steps", type=bool, defval=true)
//steps_base = input(title="White Steps Base",  defval=242, minval=0)

//Signals
fast_ema = ema(close, fast_ema_periods)
slow_ema = ema(close, slow_ema_periods)
trend_ema = ema(close, trend_ema_periods)
k = stoch(close, high, low, stoch_k)
d = sma(k, stoch_d)
vol_ma = sma(volume, volume_periods)

//REVIEW CONSTANT 1.75:
in_middle_zone(a) => a > over_selling * 1.75 and a < over_buying
growing(a) => a > a[1]

was_in_middle_zone = k == d
was_in_middle_zone := was_in_middle_zone[1] or in_middle_zone(k) and in_middle_zone(d)

//Buy Signal Trigger:
//- Both Stoch <= 20 crossing up and both growing and
//  green candle and Vol/sma vol >= 1.40 Avg Vol
buy = k <= over_selling and d <= over_selling and crossover(k, d) and growing(k) and growing(d) and
      close > open and volume/vol_ma >= volume_factor

//or
//- Both Stoch growing up and Vol/sma vol >= 1.40 Avg Vol and green candle and
//  both prior Stoch crossing up
buy := buy or (growing(k) and growing(d) and volume/vol_ma >= volume_factor and close > open and
              crossover(k[1], d[1]) )
//Worse:
//              (crossover(k[1], d[1]) or (crossover(k, d) and k[1] <= over_selling and d[1] <= over_selling) ) )

//or
//  [OPTIONAL]: (Bad for BTC 2018, excelent for 2017)
//- Crossingover(fast_ema, slow_ema) and growing(fast_ema) and growing(slow_ema) and green candle
buy := buy or (crossover(fast_ema, slow_ema) and growing(fast_ema) and growing(slow_ema) and close > open)


//Debug:
//d1 = close > open  ? 400 : 0
//plot(d1+5200, color=white, linewidth = 3, style = stepline)

//Exit position:
//- Both Stoch <= 20 and Both Stoch were > 20 during position
sell = k <= over_selling and d <= over_selling and was_in_middle_zone

//  or
//- CrossingUnder(Fast EMA, Medium EMA)
sell := sell or crossunder(fast_ema, slow_ema)

//  or  [OPTIONAL] (Better for BTC 2018, Worse for BNB 1H)
//- CrossingUnder(k, d) and (k and d starting over over_buying) and (k and d descending) and k crossing down over_buying line
sell := sell or (crossunder(k, d) and k[1] >= over_buying and d[1] >= over_buying and
                 not growing(k) and not growing(d) and k <= over_buying)

color = buy ? green : red

bought_price = close
bought_price := nz(bought_price[1])

already_bought = false
already_bought := nz(already_bought[1], false)

//Date Ranges
buy  := buy and  not already_bought


//d1 = buy ? 400 : 0
//plot(d1+6500, color=white, linewidth = 3, style = stepline)

was_in_middle_zone := (not buy and was_in_middle_zone) or (in_middle_zone(k) and in_middle_zone(d))

already_bought   := already_bought[1] or buy
bought_price := buy ? close * (1 - threshold_sl_perc/100) : bought_price[1]
trigger_SL = close < bought_price[0]
sell := sell or trigger_SL

sell := sell and
                 already_bought and not buy and (was_in_middle_zone or trigger_SL)

//plot((sell?400:0)+5200, title="Buy-Sell", color=yellow, linewidth = 3, style = stepline)

already_bought   := already_bought[0] and not sell
bought_price := sell ? 0 : bought_price[0]

//plot((was_in_middle_zone?400:0)+5200, title="Buy-Sell", color=yellow, linewidth = 3, style = stepline)

was_in_middle_zone := not sell and was_in_middle_zone

//Plot signals
plot(fast_ema, title="Fast EMA", color=red, linewidth = 4)
plot(slow_ema, title="Slow EMA", color=blue, linewidth = 4)
plot(trend_ema, title="Trend EMA", color=yellow, linewidth = 4)

//Stop Loss
plot(bought_price, color=gray, linewidth=2, style=cross, join=true, title="Stop Loss")

//Y = stepsignal ? lowest(40) : na
//Y = steps_base
//plot(mysignal+Y, title="Steps", color=white, linewidth = 3, style = stepline)
//Unit steps - for debugging
//plot(mysteps+Y, title="Steps2", color=yellow, linewidth = 3, style = stepline)

//Bought or not - for debugging
//plot((already_bought?400:0)+5200, title="Buy-Sell", color=yellow, linewidth = 3, style = stepline)
//plot((sell?400:0)+5200, title="Buy-Sell", color=yellow, linewidth = 3, style = stepline)

plotshape(buy, title="Buy arrows", style=shape.arrowup, location=location.belowbar, color=color, text="Buy", textcolor=color, size=size.huge, transp=30)
plotshape(sell, title="Sell arrows", style=shape.arrowdown, location=location.abovebar, color=color, text="Sell", textcolor=color, size=size.huge, transp=30)

//if n>2000
strategy.entry("buy", strategy.long, when=buy)
strategy.close_all(when=sell)

//plot(strategy.equity, title="Equity", color=white, linewidth = 4, style = line)

//AlertS trigger
//msg = "[SW Magic Signals EMA] BUY/SELL Signal has been triggered." + "(" + tostring(fastema) + ", " + tostring(slowema) + ") on " + tickerid + ", " + period + "."
msg = "SW SVE BUY/SELL Signal has been triggered. (#, #) on EXCH:PAIR, period: #."

alertcondition(buy or sell, title="SW SVE (BUY/SELL SIGNAL)", message=msg)
alertcondition(buy, title="SW SVE (BUY SIGNAL)", message=msg)
alertcondition(sell, title="SW SVE (SELL SIGNAL)", message=msg)
Detail
https://www.fmz.com/strategy/430833
Last Modified
2023-11-02 13:56:23