
9.1 KiB
Name
动态均线趋势交叉策略Dynamic-Moving-Average-Trend-Crossover-Strategy
Author
ChaoZhang
Strategy Description
 [trans]
概述
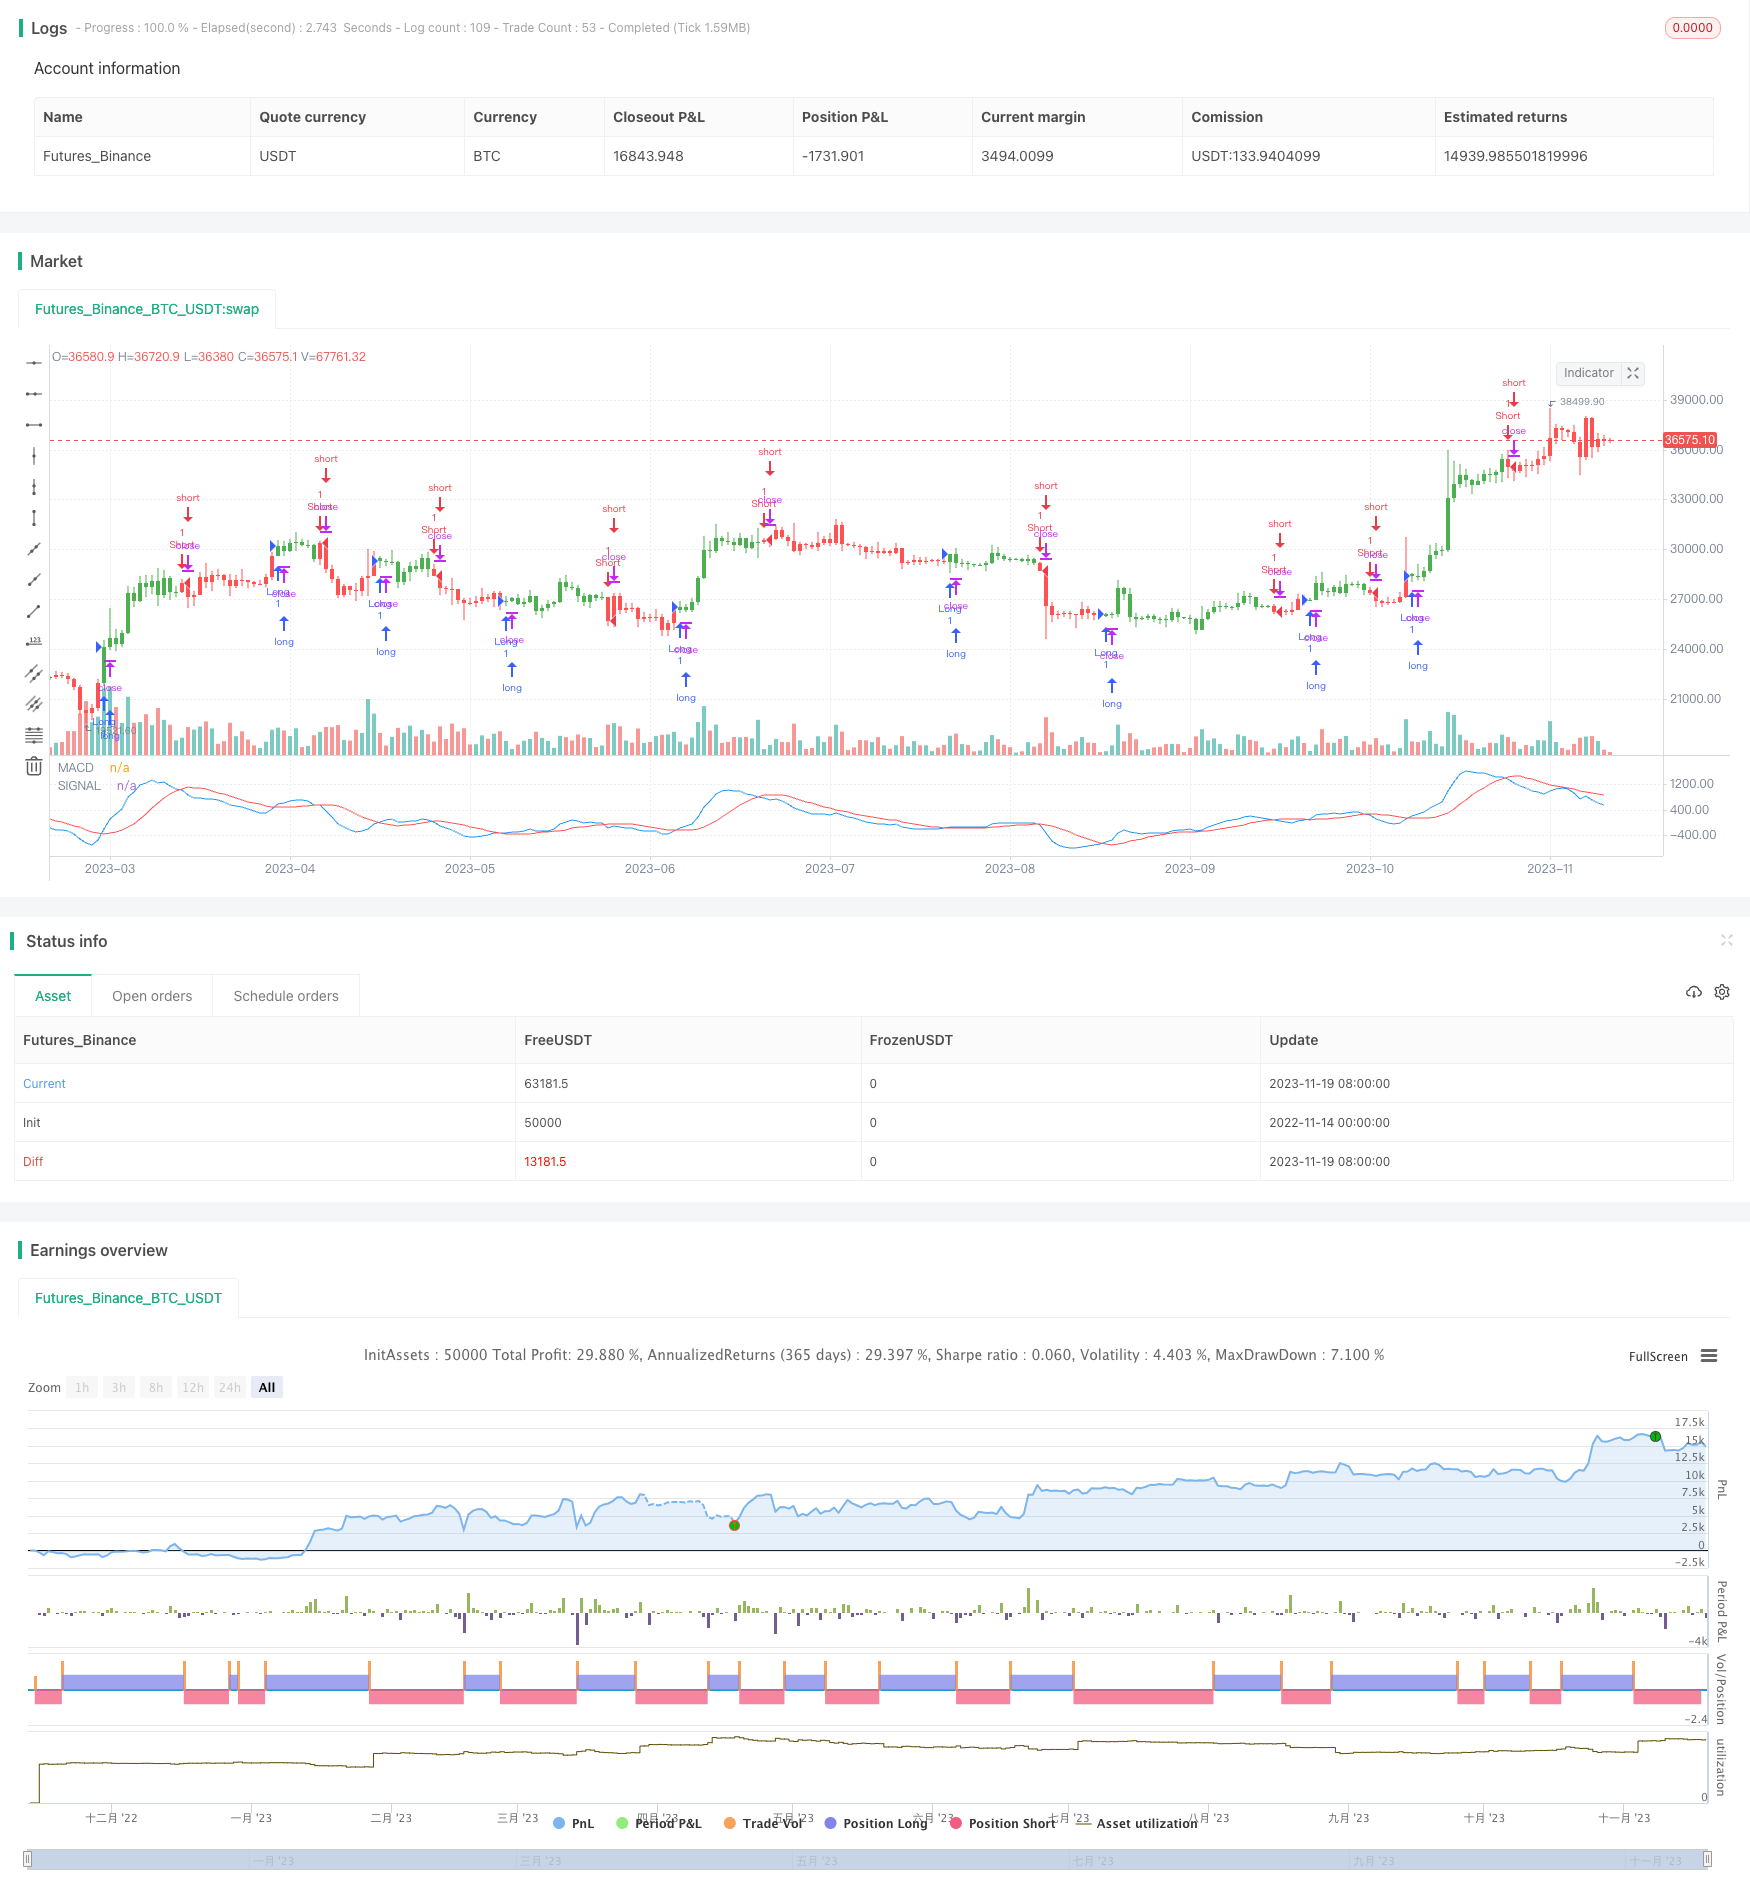
动态均线趋势交叉策略是一种基于MACD(移动平均收敛发散指标)的交易系统。该策略依据短期与长期移动平均线的差异来判断市场趋势,从而作出买入或卖出的决策。其主要思想是通过监测短期和长期趋势之间的关系,来预测市场的潜在变化。
策略原理
该策略使用了两个不同周期的指数移动平均线(EMA):快速EMA(8日)和慢速EMA(16日)。MACD值由这两条EMA的差值构成。此外,策略还引入了一个信号线,即MACD的简单移动平均线(11日)。当MACD线上穿信号线时,代表多头趋势,策略执行买入操作;当MACD线下穿信号线时,代表空头趋势,执行卖出操作。
在代码层面,策略首先计算快速和慢速EMA,然后得出MACD值。随后,计算MACD的SMA,作为信号线。通过比较MACD和信号线的位置,策略确定当前的持仓状态。此外,策略还提供了反向交易的选项,允许用户在相反的信号出现时进入市场。
策略优势
动态均线趋势交叉策略的主要优势在于其简洁性和对市场趋势变化的敏感性。通过使用不同周期的EMA,该策略能够有效捕捉到短期和长期趋势之间的偏差,从而及时响应市场变化。此外,信号线的加入进一步提高了策略的准确性,使投资者能够更快地识别趋势转变。
风险分析
尽管动态均线趋势交叉策略在多数情况下表现良好,但它也存在一些风险。最主要的风险是在市场波动性较大或趋势不明显时,该策略可能产生误导性信号。此外,策略对历史数据的依赖也可能导致延迟反应。为减轻这些风险,投资者可以结合其他技术指标或市场分析来辅助决策。
优化方向
该策略的优化方向主要包括调整EMA周期长度、引入其他技术指标以及考虑市场波动性因素。调整周期长度可以使策略更适应不同市场条件。引入如RSI、布林带等其他指标可以提供更全面的市场视角。考虑市场波动性因素,如通过ATR调整交易策略,可以增强策略的适应性和稳健性。
总结
动态均线趋势交叉策略是一种以MACD为核心的量化交易策略。它通过分析短期与长期趋势的关系,来把握市场动向。虽然这种策略简洁有效,但也需要注意其局限性和潜在风险。通过不断优化和结合其他分析工具,投资者可以更好地利用这一策略,实现有效的市场操作。
||
Overview
The Dynamic Moving Average Trend Crossover Strategy is a trading system based on the Moving Average Convergence Divergence (MACD) indicator. This strategy relies on the difference between short-term and long-term moving averages to make buy or sell decisions, with the main idea being the monitoring of the relationship between short-term and long-term trends to predict potential market changes.
Strategy Principle
This strategy utilizes two different period Exponential Moving Averages (EMA): a fast EMA (8 days) and a slow EMA (16 days). The MACD value is derived from the difference between these two EMAs. Additionally, the strategy incorporates a signal line, which is the Simple Moving Average (SMA) of the MACD over 11 days. A buy signal is generated when the MACD line crosses above the signal line, indicating a bullish trend, and a sell signal when it crosses below, indicating a bearish trend.
At the code level, the strategy calculates the fast and slow EMAs, then derives the MACD value. Subsequently, the MACD’s SMA is calculated as the signal line. The position is determined by comparing the position of the MACD to the signal line. Moreover, the strategy offers a reverse trading option, allowing entry into the market on opposite signals.
Strategy Advantages
The main advantage of the Dynamic Moving Average Trend Crossover Strategy lies in its simplicity and sensitivity to changes in market trends. By using EMAs of different periods, this strategy effectively captures deviations between short-term and long-term trends, thus responding timely to market changes. The addition of the signal line further enhances the accuracy of the strategy, enabling investors to identify trend reversals more quickly.
Risk Analysis
While the Dynamic Moving Average Trend Crossover Strategy performs well in many situations, it also carries certain risks. The primary risk is the generation of misleading signals in highly volatile markets or during unclear trends. Additionally, reliance on historical data may lead to delayed responses. To mitigate these risks, investors can combine the strategy with other technical indicators or market analyses for decision-making.
Optimization Directions
Optimization of this strategy can include adjusting the lengths of the EMA periods, incorporating additional technical indicators, and considering market volatility factors. Adjusting the period lengths can make the strategy more adaptable to different market conditions. Introducing other indicators, such as
RSI or Bollinger Bands, can provide a more comprehensive view of the market. Considering market volatility factors, such as adjusting the strategy with ATR, can enhance the adaptability and robustness of the strategy.
Conclusion
The Dynamic Moving Average Trend Crossover Strategy is a quantitative trading strategy centered around the MACD. It aims to grasp market movements by analyzing the relationship between short-term and long-term trends. While this strategy is straightforward and effective, it is important to be aware of its limitations and potential risks. By continuously optimizing and integrating other analytical tools, investors can better utilize this strategy for effective market operations. [/trans]
Strategy Arguments
| Argument | Default | Description |
|---|---|---|
| v_input_1 | 8 | fastLength |
| v_input_2 | 16 | slowLength |
| v_input_3 | 11 | signalLength |
| v_input_4 | false | Trade reverse |
Source (PineScript)
/*backtest
start: 2022-11-14 00:00:00
end: 2023-11-20 00:00:00
period: 1d
basePeriod: 1h
exchanges: [{"eid":"Futures_Binance","currency":"BTC_USDT"}]
*/

//@version=2
////////////////////////////////////////////////////////////
//  Copyright by HPotter v1.0 06/09/2017
// MACD – Moving Average Convergence Divergence. The MACD is calculated
// by subtracting a 26-day moving average of a security's price from a
// 12-day moving average of its price. The result is an indicator that
// oscillates above and below zero. When the MACD is above zero, it means
// the 12-day moving average is higher than the 26-day moving average.
// This is bullish as it shows that current expectations (i.e., the 12-day
// moving average) are more bullish than previous expectations (i.e., the
// 26-day average). This implies a bullish, or upward, shift in the supply/demand
// lines. When the MACD falls below zero, it means that the 12-day moving average
// is less than the 26-day moving average, implying a bearish shift in the
// supply/demand lines.
// A 9-day moving average of the MACD (not of the security's price) is usually
// plotted on top of the MACD indicator. This line is referred to as the "signal"
// line. The signal line anticipates the convergence of the two moving averages
// (i.e., the movement of the MACD toward the zero line).
// Let's consider the rational behind this technique. The MACD is the difference
// between two moving averages of price. When the shorter-term moving average rises
// above the longer-term moving average (i.e., the MACD rises above zero), it means
// that investor expectations are becoming more bullish (i.e., there has been an
// upward shift in the supply/demand lines). By plotting a 9-day moving average of
// the MACD, we can see the changing of expectations (i.e., the shifting of the
// supply/demand lines) as they occur.
//  You can change long to short in the Input Settings
//  WARNING:
//  - For purpose educate only
//  - This script to change bars colors.
////////////////////////////////////////////////////////////
strategy(title="MACD Crossover", shorttitle="MACD Crossover")
fastLength = input(8, minval=1)
slowLength = input(16,minval=1)
signalLength=input(11,minval=1)
reverse = input(false, title="Trade reverse")
// hline(0, color=purple, linestyle=dashed)
fastMA = ema(close, fastLength)
slowMA = ema(close, slowLength)
macd = fastMA - slowMA
signal = sma(macd, signalLength)
pos = iff(signal < macd , 1,
	   iff(signal > macd, -1, nz(pos[1], 0)))
possig = iff(reverse and pos == 1, -1,
          iff(reverse and pos == -1, 1, pos))
if (possig == 1)
    strategy.entry("Long", strategy.long)
if (possig == -1)
    strategy.entry("Short", strategy.short)
barcolor(possig == -1 ? red: possig == 1 ? green : blue )
plot(signal, color=red, title="SIGNAL")
plot(macd, color=blue, title="MACD")
Detail
https://www.fmz.com/strategy/432810
Last Modified
2023-11-21 17:18:20