
14 KiB
Name
价格平均线交叉策略Cross-Moving-Average-Price-Strategy
Author
ChaoZhang
Strategy Description
[trans]
概述
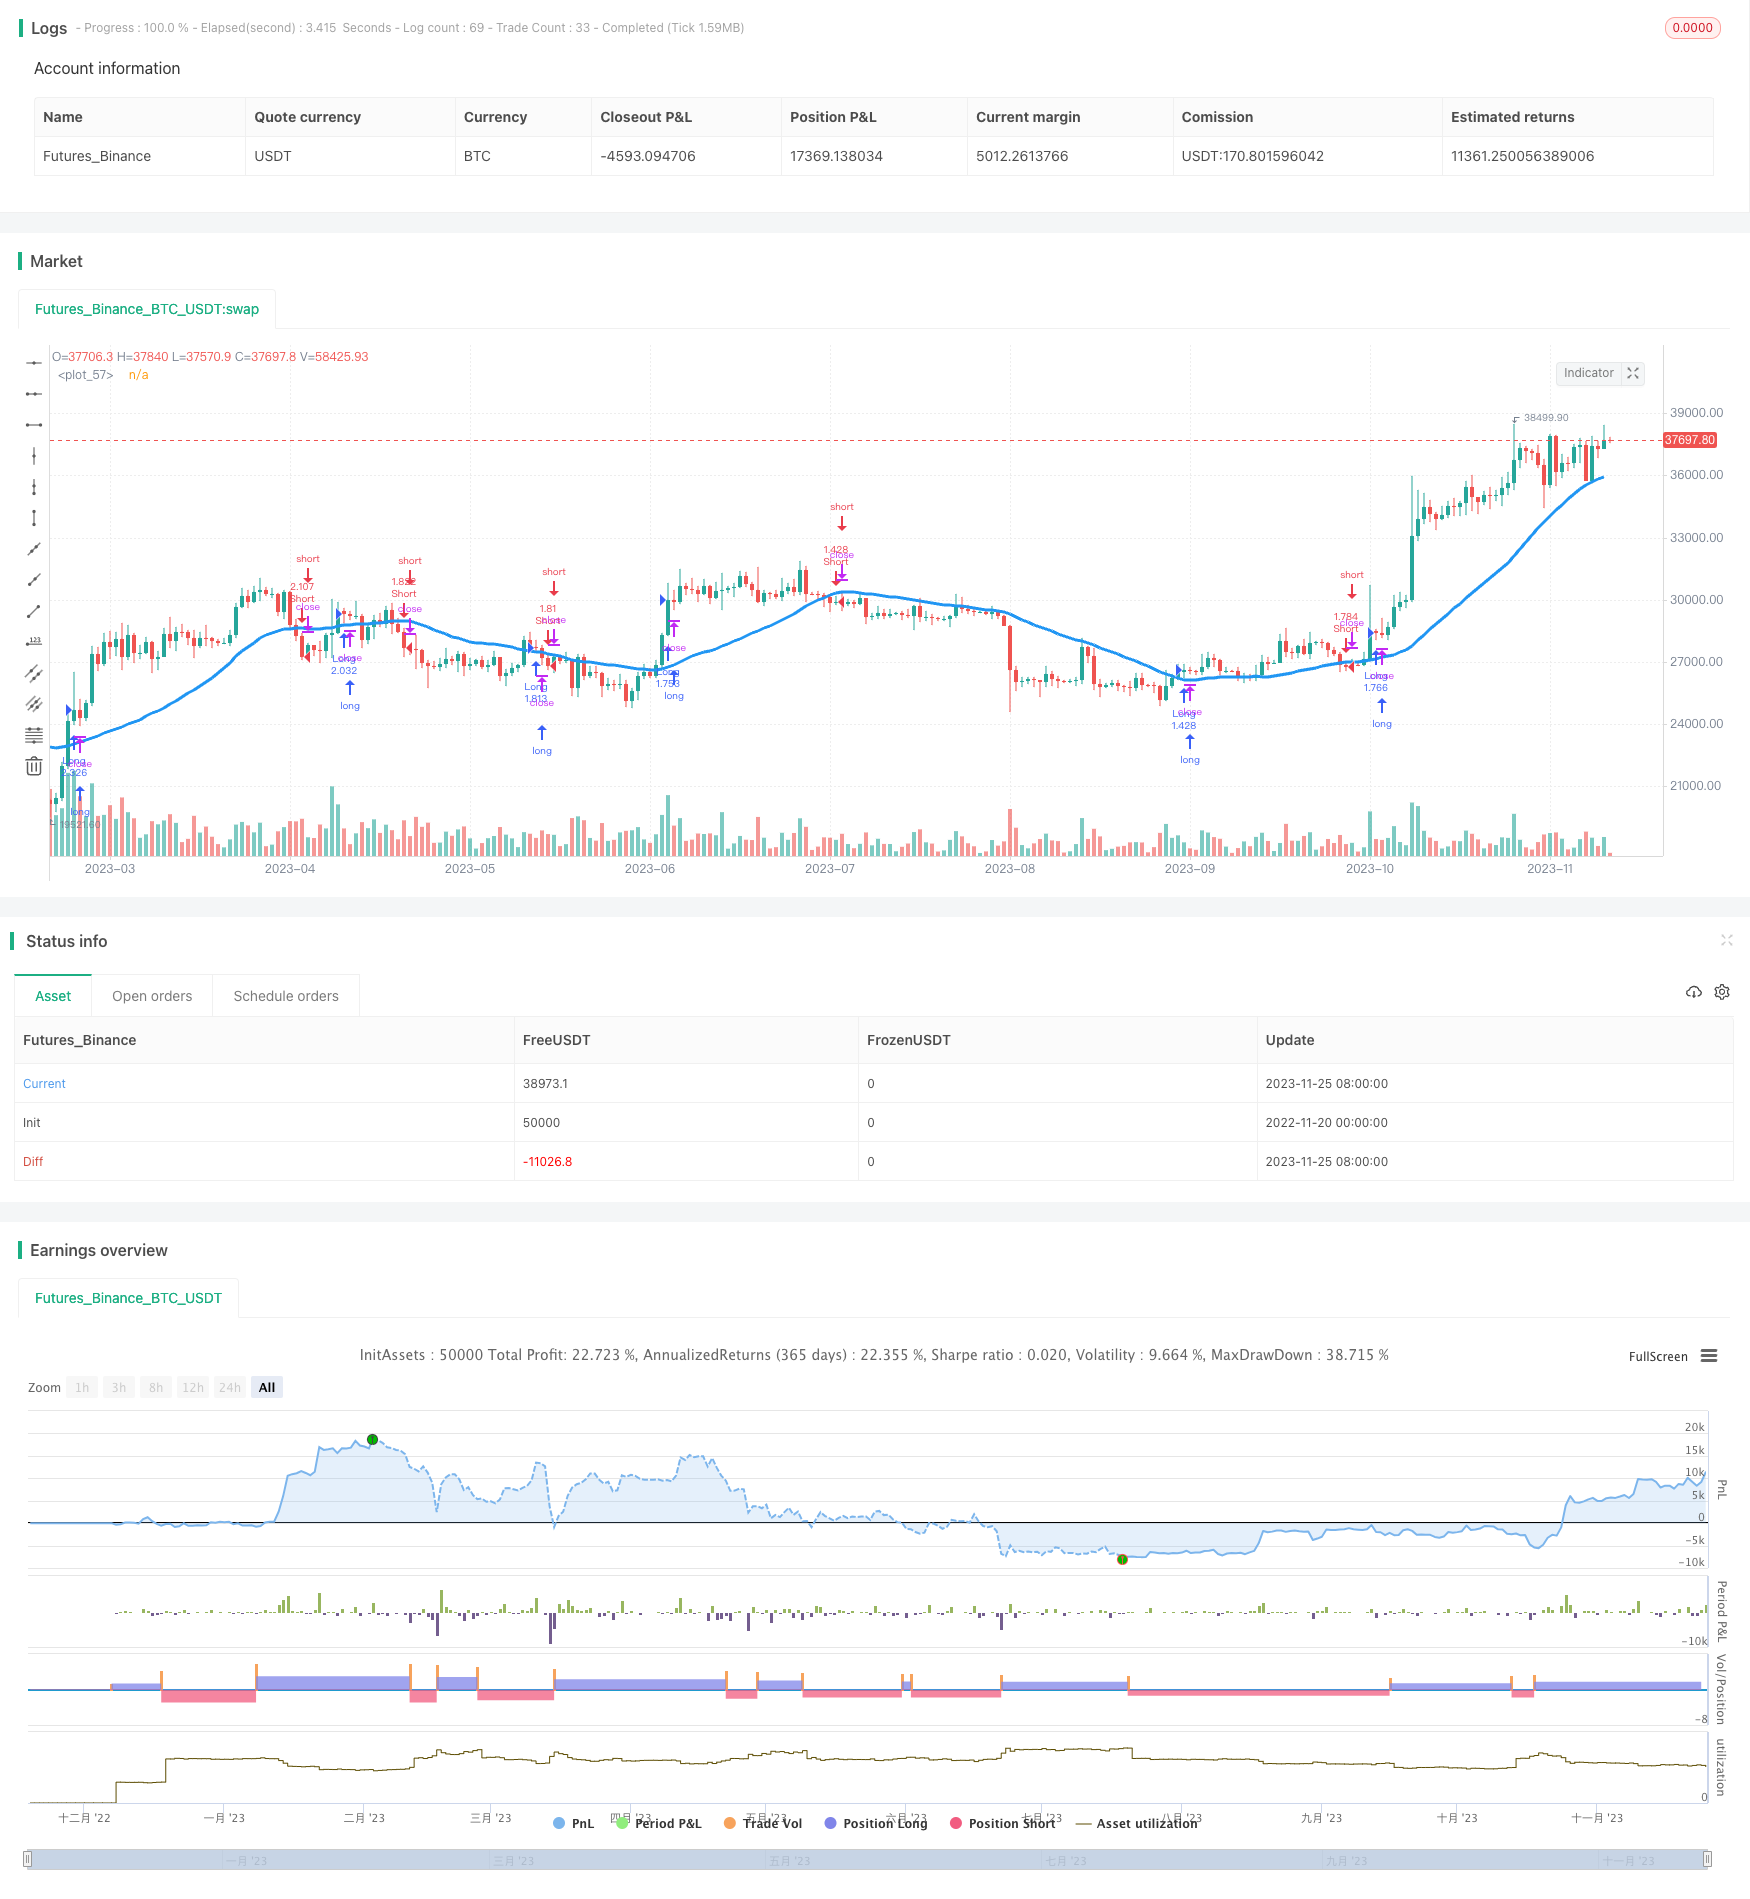
该策略本质上是一种均线交叉策略。通过计算价格的移动平均线,并设定一定的长短期移动平均线,当短期移动平均线从下方上穿越长期移动平均线时做多;当短期移动平均线从上方下穿长期移动平均线时做空。
策略原理
价格平均线交叉策略的核心思想是:价格的移动平均线能够有效反映价格变化的趋势。策略通过设置两条不同周期的移动平均线,以及一定的交易逻辑,来判断行情趋势的变化从而产生交易信号。
该策略计算出一条较长期的均线以及一条较短期的均线。长线主要判断大趋势,短线用于捕捉大趋势过程中的中短期波动。策略的交易信号主要来源于短线对长线的交叉:短线上穿长线为做多信号,短线下穿长线为做空信号。此外,策略还对信号进行了进一步的过滤处理,以避免出现假信号。
具体来说,该策略采用7种不同类型的移动平均线,包括SMA、EMA、VWMA等,用户可以选择移动平均线的类型。移动平均线的长度也可以灵活设置。此外,策略还提供了一定的交易时间段限制和仓位管理机制。通过这些设定,用户可以灵活调整策略的参数以适应不同品种和市场环境。
优势分析
价格平均线交叉策略的主要优势有以下几个方面:
-
策略逻辑清晰简单,易于理解和实现,适合初学者学习。
-
策略原理稳健,基于充分验证的均线交易法则,历经市场实践检验。
-
策略参数灵活可调,用户可以根据自己对市场的判断和偏好选择合适的参数。
-
策略具备一定的风险控制机制,能减少亏损单的持有时间并防止不必要的反向开仓。
-
策略包含多种平均线类型,用户可以选择最适合自己交易品种的移动平均线类型。
-
策略支持在特定交易时间段开启交易逻辑,避免主要假日市场的异常波动。
风险分析
虽然价格平均线交叉策略有诸多优势,但在实际交易中也存在一定的风险,主要体现在以下两个方面:
-
由于大部分移动平均线存在滞后性,交叉信号有可能出现在价格反转完成后的晚期,容易被套住。
-
参数设置不当的情况下,交叉信号可能过于频繁,使交易活跃度过高而产生较多交易成本。
针对上述风险,可以通过以下方式加以控制和应对:
-
通过设置适度的止损幅度,控制单笔亏损风险。
-
增加过滤条件,降低交易频率,防止过度交易。例如设置价格通道或价格波动幅度条件等。
-
优化移动平均线的参数,选择最适合自身交易品种和周期的参数组合。测试不同市场条件下策略的稳定性。
优化方向
该价格平均线交叉策略还有进一步优化的空间,主要可以从以下几个方面入手:
-
增加过激行情下的保护机制。例如在价格剧烈波动时暂停交易,避开市场异常期。
-
增加更多过滤条件和组合交易信号,提高信号的质量和稳定性。例如结合其它技术指标识别趋势性较强的交叉。
-
采用动态的参数体系。根据市场条件和品种特性自动调整移动平均线长度、交易开关等关键参数,而不是使用固定的数值。
-
在复合多品种套利等高级策略中应用该平均线交叉信号。与其它信息组合,进行深度策略优化。
以上这些建议都可以使该策略的适用环境更广,交易效果更佳,更好地综合风险回报。
总结
本文对Noro's CrossMA简单均线交叉策略进行了详细的代码解析和解读。我们分析了它的策略思想、原理结构、主要优势以及可能的改进方向。该策略整体来说逻辑清晰,简单实用,参数调整灵活,可适应于多种交易环境。我们还剖析了策略中存在的问题和风险,给出了针对性的处理建议。相信通过这些综合分析和讨论,可以使交易者更深入理解该类型策略,并有助于其不断优化实盘交易系统。
||
Overview
This strategy is essentially a moving average cross strategy. By calculating the moving average of prices and setting certain short-term and long-term moving averages, go long when the short-term moving average crosses above the long-term moving average from the bottom; go short when the short-term moving average crosses below the long-term moving average from the top.
Principles
The core idea of price moving average cross strategy is: the moving average of price can effectively reflect the trend of price change. The strategy judges the change of market trend through setting two moving averages of different cycles and certain trading logic to generate trading signals.
The strategy calculates a longer-term moving average and a shorter-term one. The long line mainly judges the major trend, and the short line is used to capture medium-term fluctuations during the major trend. The trading signals of the strategy mainly come from the cross of the short line over the long line: the long signal when the short line crosses above the long line, and the short signal when the short line crosses below. In addition, the strategy filters the signals to avoid false signals.
Specifically, the strategy uses 7 different types of moving averages, including SMA, EMA, VWMA, etc. Users can select the moving average type. The length of the moving average can also be flexibly set. In addition, the strategy also provides restrictions on certain trading time periods and position management mechanisms. Through these settings, users can flexibly adjust the parameters of the strategy to adapt to different varieties and market environments.
Advantage Analysis
The main advantages of price moving average cross strategy are as follows:
-
The strategy logic is clear and simple, easy to understand and implement, suitable for beginners to learn.
-
The principle of strategy is robust, based on fully verified rules of moving average trading, and has been practically tested in markets.
-
The parameters of the strategy are flexible and adjustable. Users can choose appropriate parameters according to their own judgments and preferences on the market.
-
The strategy has certain risk control mechanisms to reduce the holding time of losing orders and prevent unnecessary reverse positions.
-
The strategy contains multiple types of moving averages. Users can select the most suitable moving average type for their trading varieties.
-
The strategy supports enabling trading logic during specific trading time periods to avoid abnormal fluctuations in major holiday markets.
Risk Analysis
Although the price moving average cross strategy has many advantages, there are still some risks in actual trading, which are mainly reflected in the following two aspects:
-
Due to the lag of most moving averages, cross signals may appear in the later stage after the price reversal is completed, which is easy to be trapped.
-
In case of improper parameter settings, cross signals may be too frequent, resulting in too high trading activity and more trading costs.
In response to the above risks, controls and coping methods are carried out in following ways:
-
Control the risk of single loss by setting appropriate stop loss range.
-
Reduce trading frequency and prevent over-trading by adding filter conditions. For example, setting up price channel or price fluctuation range conditions.
-
Optimize parameters of moving average to select the most suitable combination of parameters for your own trading varieties and cycles. Test the stability of strategy under different market conditions.
Optimization
There is still room for further optimization of this price moving average crossover strategy. It can be done in following aspects:
-
Increase protection mechanism under extreme market conditions. For example, suspend trading temporarily during violent price fluctuations to avoid abnormal market conditions.
-
Increase more filter conditions and combined trading signals to improve signal quality and stability. For example, identify trendy crossovers combined with other technical indicators.
-
Adopt dynamic parameter system. According to market conditions and characteristics of varieties, automatically adjust key parameters such as moving average length, trading switch, etc. instead of using fixed values.
-
Apply this moving average crossover signal in advanced strategies like composite variety arbitrage. Combine it with other information for in-depth strategy optimization.
These suggestions above can broaden the applicable environment and effectiveness of this strategy and achieve better risk-reward tradeoff.
Conclusion
This article makes a detailed code analysis and interpretation of the simple moving average crossover strategy - Noro's CrossMA. We analyze its strategy idea, principle structure, main advantages and possible improvement directions. Overall, this strategy has clear logic and is simple and practical. The flexible parameter adjustment can adapt to many trading environments. We also dissect existing problems and risks in the strategy and give targeted advice. It is believed that through these comprehensive analysis and discussions, traders can better understand such types of strategies and help them to continuously optimize real trading systems.
[/trans]
Strategy Arguments
| Argument | Default | Description |
|---|---|---|
| v_input_1 | true | long |
| v_input_2 | true | short |
| v_input_3 | 100 | Lot, % |
| v_input_4 | 0 | MA type: SMA |
| v_input_5_close | 0 | MA Source: close |
| v_input_6 | 30 | MA length |
| v_input_7 | false | MA offset |
| v_input_8 | true | Anti-saw filter |
| v_input_9 | true | Show MA |
| v_input_10 | false | Show background |
| v_input_11 | 1900 | From Year |
| v_input_12 | 2100 | To Year |
| v_input_13 | true | From Month |
| v_input_14 | 12 | To Month |
| v_input_15 | true | From day |
| v_input_16 | 31 | To day |
Source (PineScript)
/*backtest
start: 2022-11-20 00:00:00
end: 2023-11-26 00:00:00
period: 1d
basePeriod: 1h
exchanges: [{"eid":"Futures_Binance","currency":"BTC_USDT"}]
*/

//Noro
//2019

//@version=4
strategy(title = "Noro's CrossMA", shorttitle = "CrossMA", overlay = true, default_qty_type = strategy.percent_of_equity, default_qty_value = 100.0, pyramiding = 0, commission_value = 0.1)

needlong = input(true, "long")
needshort = input(true, "short")
lotsize = input(100, defval = 100, minval = 1, maxval = 10000, title = "Lot, %")
type = input(defval = "SMA", options = ["SMA", "EMA", "VWMA", "DEMA", "TEMA", "KAMA", "PCMA"], title = "MA type")
src = input(close, defval = close, title = "MA Source")
len = input(30, defval = 30, minval = 1, title = "MA length")
off = input(00, defval = 00, minval = 0, title = "MA offset")
anti = input(true, defval = true, title = "Anti-saw filter")
showma = input(true, defval = true, title = "Show MA")
showbg = input(false, defval = false, title = "Show background")
fromyear = input(1900, defval = 1900, minval = 1900, maxval = 2100, title = "From Year")
toyear = input(2100, defval = 2100, minval = 1900, maxval = 2100, title = "To Year")
frommonth = input(01, defval = 01, minval = 01, maxval = 12, title = "From Month")
tomonth = input(12, defval = 12, minval = 01, maxval = 12, title = "To Month")
fromday = input(01, defval = 01, minval = 01, maxval = 31, title = "From day")
today = input(31, defval = 31, minval = 01, maxval = 31, title = "To day")

//DEMA
dema = 2 * ema(src, len) - ema(ema(close, len), len)

//TEMA
xPrice = close
xEMA1 = ema(src, len)
xEMA2 = ema(xEMA1, len)
xEMA3 = ema(xEMA2, len)
tema = 3 * xEMA1 - 3 * xEMA2 + xEMA3

//KAMA
xvnoise = abs(src - src[1])
nfastend = 0.20
nslowend = 0.05
nsignal = abs(src - src[len])
nnoise = sum(xvnoise, len)
nefratio = iff(nnoise != 0, nsignal / nnoise, 0)
nsmooth = pow(nefratio * (nfastend - nslowend) + nslowend, 2)
kama = 0.0
kama := nz(kama[1]) + nsmooth * (src - nz(kama[1]))

//PriceChannel
lasthigh = highest(src, len)
lastlow = lowest(src, len)
center = (lasthigh + lastlow) / 2

sma_1 = sma(src, len)
ema_1 = ema(src, len)
vwma_1 = vwma(src, len)
ma2 = type == "SMA" ? sma_1 : type == "EMA" ? ema_1 : type == "VWMA" ? vwma_1 : type == "DEMA" ? dema : type == "TEMA" ? tema : type == "KAMA" ? kama : type == "PCMA" ? center : 0
ma = ma2[off]

macol = showma ? color.blue : na
plot(ma, color = macol, linewidth = 3, transp = 0)

//Background
trend = 0
trend := anti == false and close > ma ? 1 : anti == false and close < ma ? -1 : low > ma ? 1 : high < ma ? -1 : trend[1]
bgcol = showbg ? trend == 1 ? color.lime : trend == -1 ? color.red : na : na
bgcolor(bgcol, transp = 70)

//Trading
size = strategy.position_size
truetime = time > timestamp(fromyear, frommonth, fromday, 00, 00) and time < timestamp(toyear, tomonth, today, 23, 59)
lot = 0.0
lot := size != size[1] ? strategy.equity / close * lotsize / 100 : lot[1]
if trend == 1 and trend[1] == -1
    strategy.entry("Long", strategy.long, lot, when = needlong and truetime)
if trend == -1 and trend[1] == 1
    strategy.entry("Short", strategy.short, lot, when = needshort and truetime)
if size > 0 and needshort == false and trend == -1
    strategy.close_all()
if size < 0 and needlong == false and trend == 1
    strategy.close_all()
if time > timestamp(toyear, tomonth, today, 23, 59)
    strategy.close_all()
    strategy.cancel("Long")
    strategy.cancel("Short")
Detail
https://www.fmz.com/strategy/433441
Last Modified
2023-11-27 16:52:19