
201 lines
6.3 KiB
Markdown
201 lines
6.3 KiB
Markdown
|
|
> Name
|
|
|
|
Bollinger带均值回归交易策略Bollinger-Band-Mean-Reversion-Trading-Strategy
|
|
|
|
> Author
|
|
|
|
ChaoZhang
|
|
|
|
> Strategy Description
|
|
|
|
|
|
[trans]
|
|
|
|
## 概述
|
|
|
|
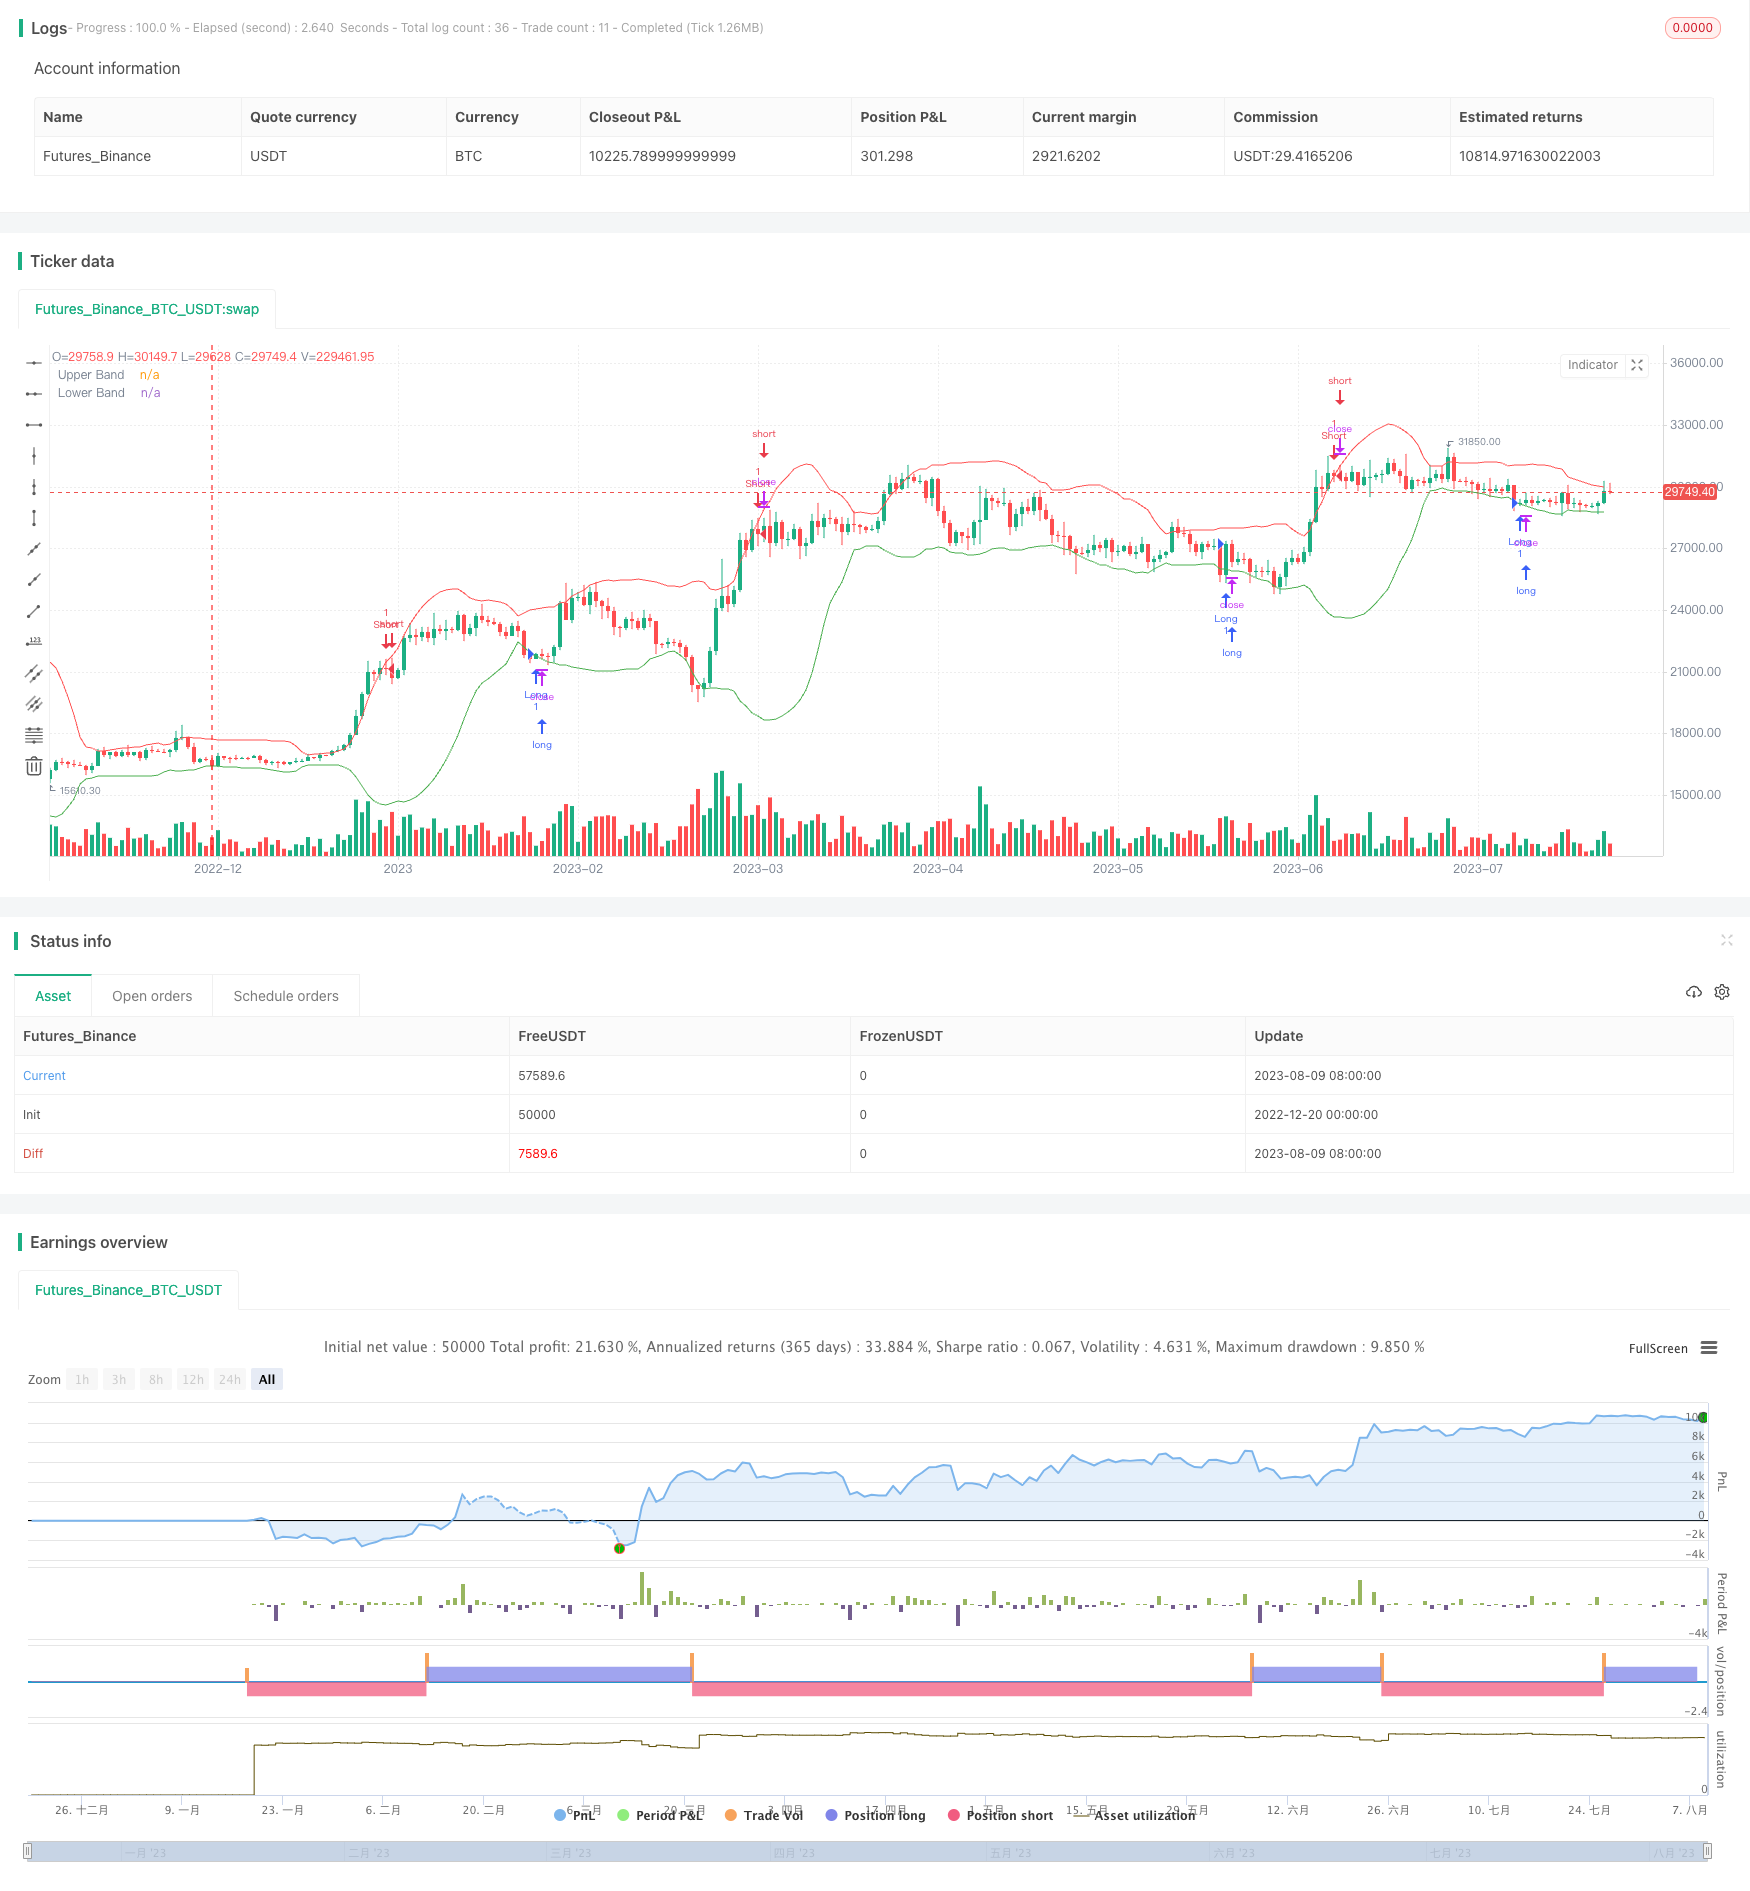
该策略是一种基于Bollinger带的均值回归交易策略。它结合了均值回归交易和风险管理机制,旨在在趋势性市场中捕捉短期反转机会。
|
|
|
|
## 策略原理
|
|
|
|
该策略使用20日Bollinger带以识别价格的过度扩展区域。当价格接近上轨时,做空;当价格接近下轨时,做多。这样可以在价格反转的时候获利。
|
|
|
|
此外,策略还设置了基于ATR的止损位和止盈位。止损位设置为价格突破均线时的价格再减去2倍ATR;止盈位为价格再加上3倍ATR。这可以有效控制每笔交易的风险。
|
|
|
|
具体来说,策略包括以下步骤:
|
|
|
|
1. 计算20日Bollinger带的上轨、下轨和均线
|
|
2. 计算14日ATR指标
|
|
3. 当价格上穿下轨时做多;当价格下穿上轨时做空
|
|
4. 做多时,设置止损为价格减去2倍ATR,止盈为价格加上3倍ATR
|
|
5. 做空时,设置止损为价格加上2倍ATR,止盈为价格减去3倍ATR
|
|
|
|
## 优势分析
|
|
|
|
该策略主要有以下优势:
|
|
|
|
1. 使用Bollinger带可以有效判断价格的过度扩展区域
|
|
2. 结合均值回归交易,可以在反转时获利
|
|
3. 设置ATR止损止盈,可以严格控制风险
|
|
4. 回测效果良好,历史数据中多次获利
|
|
|
|
## 风险分析
|
|
|
|
该策略也存在一些风险:
|
|
|
|
1. 反转失败风险。价格波动可能不遵循均值回归,反转信号发出后价格继续走势
|
|
2. 止损被跳过风险。市场突发事件可能导致价格跳空,从而跳过预设的止损位
|
|
3. 参数优化风险。不同市场情况下,参数设置需要调整,否则会影响策略效果
|
|
|
|
对策:
|
|
1. 严格遵循止损规则,控制单笔损失
|
|
2. 优化参数,调整至当下市场情况
|
|
3. 采用期权或其他工具,对冲跳空风险
|
|
|
|
## 优化方向
|
|
|
|
该策略还可以从以下方面进行优化:
|
|
|
|
1.测试不同均线系统,寻找最佳参数组合
|
|
|
|
2.加入过滤条件,在趋势判断准确后再进行交易
|
|
|
|
3.调整ATR的倍数,优化止损止盈的幅度
|
|
|
|
4.加入与市场结构相关的动态退出机制
|
|
|
|
这将有助于进一步提高策略的稳定性和收益率。
|
|
|
|
## 总结
|
|
|
|
总的来说,该Bollinger带均值回归策略结合趋势判断和风险控制,是一种效果较好的短线交易策略。通过不断优化和丰富,有望获得稳定而高质量的超额收益。
|
|
|
|
||
|
|
|
|
## Overview
|
|
|
|
This is a mean reversion trading strategy based on Bollinger Bands. It combines mean reversion trading and risk management mechanisms to capture short-term reversal opportunities in trending markets.
|
|
|
|
## Strategy Logic
|
|
|
|
The strategy uses 20-day Bollinger Bands to identify overextended price areas. It goes short when price nears the upper band and goes long when price nears the lower band, profiting from eventual reversals.
|
|
|
|
It also sets stop loss and take profit based on ATR. The stop loss is set at price breaking the moving average minus 2 times ATR. Take profit is set at price plus 3 times ATR. This effectively controls the risk per trade.
|
|
|
|
Specifically, the strategy includes:
|
|
|
|
1. Calculate 20-day Bollinger Bands upper band, lower band and moving average
|
|
2. Calculate 14-day ATR
|
|
3. Long when price crosses above lower band; Short when price crosses below upper band
|
|
4. Set stop loss at price minus 2 times ATR and take profit at price plus 3 times ATR when long
|
|
5. Set stop loss at price plus 2 times ATR and take profit at price minus 3 times ATR when short
|
|
|
|
## Advantage Analysis
|
|
|
|
The main advantages are:
|
|
|
|
1. Bollinger Bands effectively identify overextended price areas
|
|
2. Profit from reversals through mean reversion
|
|
3. ATR stops set risk controls
|
|
4. Positive backtest results with multiple profitable trades
|
|
|
|
## Risk Analysis
|
|
|
|
Potential risks include:
|
|
|
|
1. Failed reversal risk if price continues trending
|
|
2. Stop loss skipped risk from price gaps
|
|
3. Parameter optimization required for changing markets
|
|
|
|
Solutions:
|
|
|
|
1. Strictly follow stop loss rules to limit loss per trade
|
|
2. Optimize parameters to suit current markets
|
|
3. Use options or other tools to hedge gap risk
|
|
|
|
## Optimization Directions
|
|
|
|
The strategy can be further optimized by:
|
|
|
|
1. Testing different moving averages for best parameters
|
|
2. Adding filters to improve trend determination
|
|
3. Adjusting ATR multiples to fine tune stops and limits
|
|
4. Incorporating dynamic exit mechanisms based on market regimes
|
|
|
|
This will further enhance the stability and return profile.
|
|
|
|
## Summary
|
|
|
|
In summary, the Bollinger Band mean reversion strategy with trend filters and risk management has demonstrated positive results. With continuous optimization and enhancements, it holds potential for steady and high-quality excess returns.
|
|
|
|
[/trans]
|
|
|
|
> Strategy Arguments
|
|
|
|
|
|
|
|
|Argument|Default|Description|
|
|
|----|----|----|
|
|
|v_input_1|20|Bollinger Bands Length|
|
|
|v_input_2|2|Bollinger Bands Multiplier|
|
|
|v_input_3|2|Stop Loss ATR Multiplier|
|
|
|v_input_4|3|Take Profit ATR Multiplier|
|
|
|
|
|
|
> Source (PineScript)
|
|
|
|
``` pinescript
|
|
/*backtest
|
|
start: 2022-12-20 00:00:00
|
|
end: 2023-08-10 00:00:00
|
|
period: 1d
|
|
basePeriod: 1h
|
|
exchanges: [{"eid":"Futures_Binance","currency":"BTC_USDT"}]
|
|
*/
|
|
|
|
//@version=4
|
|
strategy("Mean Reversion with Risk Management", overlay=true)
|
|
|
|
// Inputs for Bollinger Bands and Risk Management
|
|
length = input(20, minval=1, title="Bollinger Bands Length")
|
|
mult = input(2.0, title="Bollinger Bands Multiplier")
|
|
stopLossATRMult = input(2.0, title="Stop Loss ATR Multiplier")
|
|
takeProfitATRMult = input(3.0, title="Take Profit ATR Multiplier")
|
|
|
|
// Bollinger Bands Calculation
|
|
src = close
|
|
basis = sma(src, length)
|
|
dev = mult * stdev(src, length)
|
|
upper = basis + dev
|
|
lower = basis - dev
|
|
plot(upper, "Upper Band", color=color.red)
|
|
plot(lower, "Lower Band", color=color.green)
|
|
|
|
// ATR for Stop Loss and Take Profit
|
|
atr = atr(14)
|
|
|
|
// Trading Conditions
|
|
longCondition = crossover(src, lower)
|
|
shortCondition = crossunder(src, upper)
|
|
|
|
// Order Execution with Stop Loss and Take Profit
|
|
if (longCondition)
|
|
sl = src - stopLossATRMult * atr
|
|
tp = src + takeProfitATRMult * atr
|
|
strategy.entry("Long", strategy.long, stop=sl, limit=tp)
|
|
|
|
if (shortCondition)
|
|
sl = src + stopLossATRMult * atr
|
|
tp = src - takeProfitATRMult * atr
|
|
strategy.entry("Short", strategy.short, stop=sl, limit=tp)
|
|
|
|
```
|
|
|
|
> Detail
|
|
|
|
https://www.fmz.com/strategy/436790
|
|
|
|
> Last Modified
|
|
|
|
2023-12-27 17:18:26
|