
9.8 KiB
Name
顺势突破-动量止损策略Momentum-Breakout-Strategy-with-Volatility-Stop
Author
ChaoZhang
Strategy Description
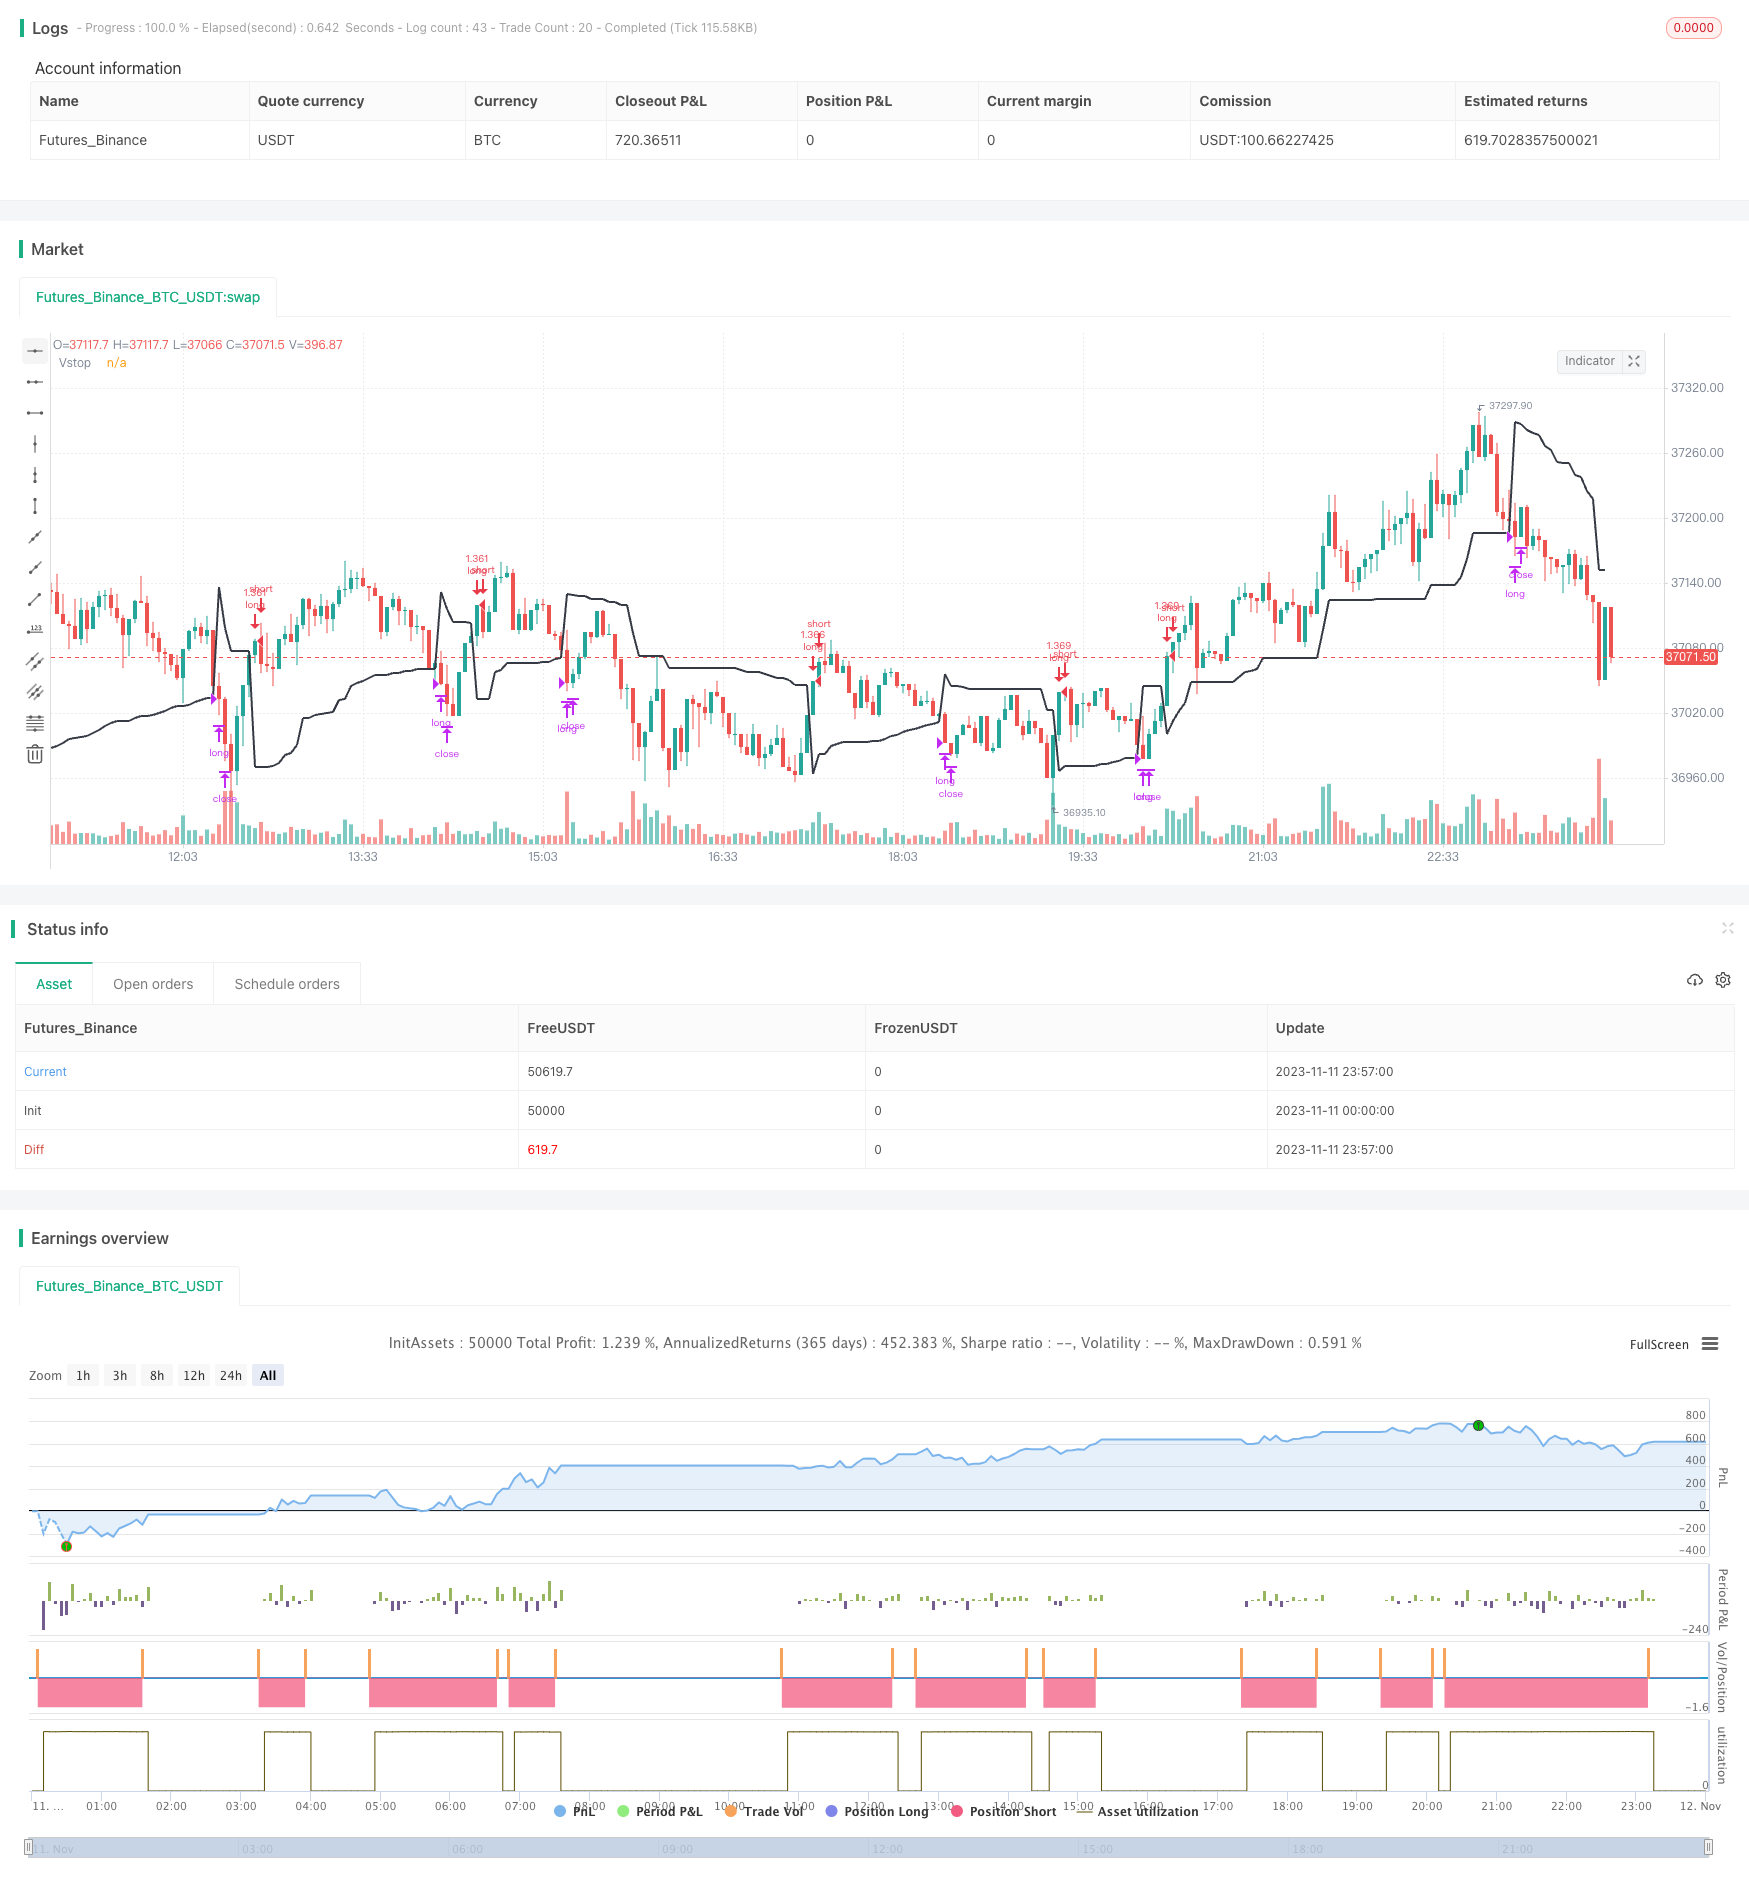 [trans]
概述
这个策略是基于突破和动量止损指标设计的中长线趋势跟踪策略。策略利用价格突破动态止损线来判断趋势方向,在价格突破止损线时进入场内,然后利用止损线来跟踪趋势并锁定利润。策略旨在抓取中长线趋势,同时利用动态止损来控制风险。
策略原理
该策略使用动态止损指标Volatility Stop来判断趋势方向并跟踪止损。Volatility Stop根据价格的波动范围计算出一个动态的止损线。具体计算方法是:
- 计算价格的ATR(平均真实波动幅度)
- 根据ATR值乘以一个止损系数得到止损线
- 当价格上涨时,记录最高价,止损线为最高价减去ATR乘以系数
- 当价格下跌时,记录最低价,止损线为最低价加上ATR乘以系数
这样,止损线就会随着价格波动而上下波动,形成一个动态的通道。
当价格突破止损线时,表示趋势发生反转,策略就会打开仓位:
- 当价格由下向上突破止损线时,策略会开多仓
- 当价格由上向下突破止损线时,策略会开空仓
在仓位开启后,策略会利用止损线来跟踪止损:
- 多仓的止损线为最高价减去ATR乘以系数
- 空仓的止损线为最低价加上ATR乘以系数
当价格重新触碰到止损线时,策略就会平仓止损。
这样,策略就可以顺势而为,及时跟踪趋势反转,同时利用止损来控制风险。
优势分析
该策略具有以下优势:
- 可以及时抓住趋势反转,顺势而为,避免错过机会
- 利用动态止损,可以根据市场波动调整止损位置,使止损更加合理
- 止损位置会随着走势而更新,可以最大限度锁定利润
- 在趋势中乘胜追击,可以获得较大的趋势获利
- 有效控制风险,避免亏损过大
风险分析
该策略也存在一些风险:
- 在震荡行情中,可能会出现止损频繁被触发的情况
- 需要合理设置止损系数,太小会过于敏感,太大会失去止损意义
- 需要关注交易手续费的影响,频繁交易会占用收益
- 可能会漏失部分趋势运行初期的利润
- 需要注意止损线离价格过远时带来的风险
对策:
- 可以通过回测优化止损系数,找到最佳参数
- 适当拉长交易时间周期,降低交易频率
- 可以考虑加入 filtrter 过滤器,避免过于频繁交易
- 可以适当放宽止损线距离,但不能太大
优化方向
该策略可以从以下方面进行进一步优化:
- 优化止损系数,找到最佳参数组合
- 添加过滤器,避免在震荡行情中被套牢
- 结合多个时间周期进行验证,提高信号质量
- 优化仓位管理,逐步加大仓位
- 考虑动态调整交易时间周期
- 结合股票基本面选股,把握主流趋势
总结
该顺势突破-动量止损策略整体来说是一种非常实用的趋势跟踪策略。它可以抓住趋势反转机会,顺势而为,同时利用动态止损有效控制风险。如果参数优化得当,在趋势行情中可以获得较好收益。但该策略也需要注意一些问题,如止损过于敏感、交易频率过高等。通过进一步优化,该策略可以成为一个高效稳定的量化交易系统。
||
Overview
This is a trend-following strategy based on breakout and volatility stop. The strategy identifies trend direction by price breakout of dynamic stop loss line. It enters trade when price penetrates the stop loss line and uses the stop loss line to track trends and lock in profits. The strategy aims to capture mid-long term trends while controlling risk with dynamic stops.
Strategy Logic
The strategy utilizes Volatility Stop indicator to determine trend direction and track stop loss. Volatility Stop calculates a dynamic stop loss line based on price fluctuation range. The specific steps are:
- Calculate ATR (Average True Range) of price
- Get stop loss line by multiplying ATR with a stop loss coefficient
- When price goes up, record highest price, stop loss line is highest price minus ATR * coefficient
- When price goes down, record lowest price, stop loss line is lowest price plus ATR * coefficient
The stop loss line fluctuates up and down with price, forming a dynamic channel.
When price penetrates the stop loss line, it signals a trend reversal. The strategy will open position:
- When price breaks above stop loss line, go long
- When price breaks below stop loss line, go short
After opening position, the strategy tracks stop loss with the line:
- For long, stop loss is highest price minus ATR * coefficient
- For short, stop loss is lowest price plus ATR * coefficient
When price hits the stop loss line again, the position will be closed.
This way, the strategy can follow trends in a timely manner while controlling risk with stops.
Advantage Analysis
The strategy has the following advantages:
- Can capture trend reversals in a timely manner and follow the trend
- Uses dynamic stop loss to adjust stop position based on market volatility
- Stop loss updates with trend to lock in maximum profits
- Rides the trend to achieve significant profit
- Effectively controls risk and avoids huge losses
Risk Analysis
There are also some risks to consider:
- Stop loss may be triggered frequently during ranging markets
- Need to set proper stop loss coefficient, too small may be too sensitive
- Trading fees may eat up profits with frequent trading
- May miss some profits at early stage of trends
- Risk when stop loss is too far from price
Solutions:
- Optimize stop loss coefficient through backtest to find best parameter
- Use longer time frames to lower trade frequency
- Add filter to avoid over-trading
- Allow some flexibility in stop distance but not too large
Optimization Directions
The strategy can be further optimized in the following aspects:
- Optimize stop loss coefficient to find best parameter combination
- Add filters to avoid whipsaws in ranging market
- Combine multiple timeframes for signal verification
- Optimize position sizing, gradually increase size
- Consider dynamic adjustment of time frame
- Combine with stock fundamentals to catch main trends
Summary
Overall this momentum breakout strategy with volatility stop is a very practical trend following system. It can capture trend reversal opportunities and follow the trend while controlling risk effectively with dynamic stops. With proper parameter tuning, it can achieve good return during trending markets. But some issues need to be addressed like over-sensitive stops, high trading frequency etc. Further optimizations can turn it into an efficient and robust quant trading strategy.
[/trans]
Strategy Arguments
| Argument | Default | Description |
|---|---|---|
| v_input_1 | true | From Month |
| v_input_2 | true | From Day |
| v_input_3 | 2021 | From Year |
| v_input_4 | true | Thru Month |
| v_input_5 | true | Thru Day |
| v_input_6 | 2112 | Thru Year |
| v_input_7 | true | Show Date Range |
| v_input_8 | 20 | Length |
| v_input_9_close | 0 | Source: close |
| v_input_10 | 3 | vStop Multiplier |
Source (PineScript)
/*backtest
start: 2023-11-11 00:00:00
end: 2023-11-12 00:00:00
period: 3m
basePeriod: 1m
exchanges: [{"eid":"Futures_Binance","currency":"BTC_USDT"}]
*/

// This source code is subject to the terms of the Mozilla Public License 2.0 at https://mozilla.org/MPL/2.0/
//@version=4
strategy(shorttitle='Volatility Stop Strategy',title='Volatility Stop Strategy (by Coinrule)', overlay=true, initial_capital = 100, process_orders_on_close=true, default_qty_type = strategy.percent_of_equity, default_qty_value = 100, commission_type=strategy.commission.percent, commission_value=0.1)

// Works better on 3h, 1h, 2h, 4h
// Best time frame 2H

//Backtest dates
fromMonth = input(defval = 1,    title = "From Month",      type = input.integer, minval = 1, maxval = 12)
fromDay   = input(defval = 1,    title = "From Day",        type = input.integer, minval = 1, maxval = 31)
fromYear  = input(defval = 2021, title = "From Year",       type = input.integer, minval = 1970)
thruMonth = input(defval = 1,    title = "Thru Month",      type = input.integer, minval = 1, maxval = 12)
thruDay   = input(defval = 1,    title = "Thru Day",        type = input.integer, minval = 1, maxval = 31)
thruYear  = input(defval = 2112, title = "Thru Year",       type = input.integer, minval = 1970)

showDate  = input(defval = true, title = "Show Date Range", type = input.bool)

start     = timestamp(fromYear, fromMonth, fromDay, 00, 00)        // backtest start window
finish    = timestamp(thruYear, thruMonth, thruDay, 23, 59)        // backtest finish window
window()  => time >= start and time <= finish ? true : false       // create function "within window of time"

length = input(20, "Length", minval = 2)
src = input(close, "Source")
factor = input(3.0, "vStop Multiplier", minval = 0.25, step = 0.25)
volStop(src, atrlen, atrfactor) =>
    var max     = src
    var min     = src
    var uptrend = true
    var stop    = 0.0
    atrM        = nz(atr(atrlen) * atrfactor, tr)
    max         := max(max, src)
    min         := min(min, src)
    stop        := nz(uptrend ? max(stop, max - atrM) : min(stop, min + atrM), src)
    uptrend     := src - stop >= 0.0
    if uptrend != nz(uptrend[1], true)
        max    := src
        min    := src
        stop   := uptrend ? max - atrM : min + atrM
    [stop, uptrend]

[vStop, uptrend] = volStop(src, length, factor)


//Entry


strategy.entry(id="long", long = true, when = crossover(close, vStop) and window())

//Exit
strategy.close("long", when = crossunder(close, vStop))

plot(vStop,"Vstop", color.black, linewidth=2)
Detail
https://www.fmz.com/strategy/431962
Last Modified
2023-11-13 17:20:51