
9.6 KiB
Name
金叉死叉趋势追踪策略Golden-Dead-Cross-Trend-Tracking-Strategy
Author
ChaoZhang
Strategy Description
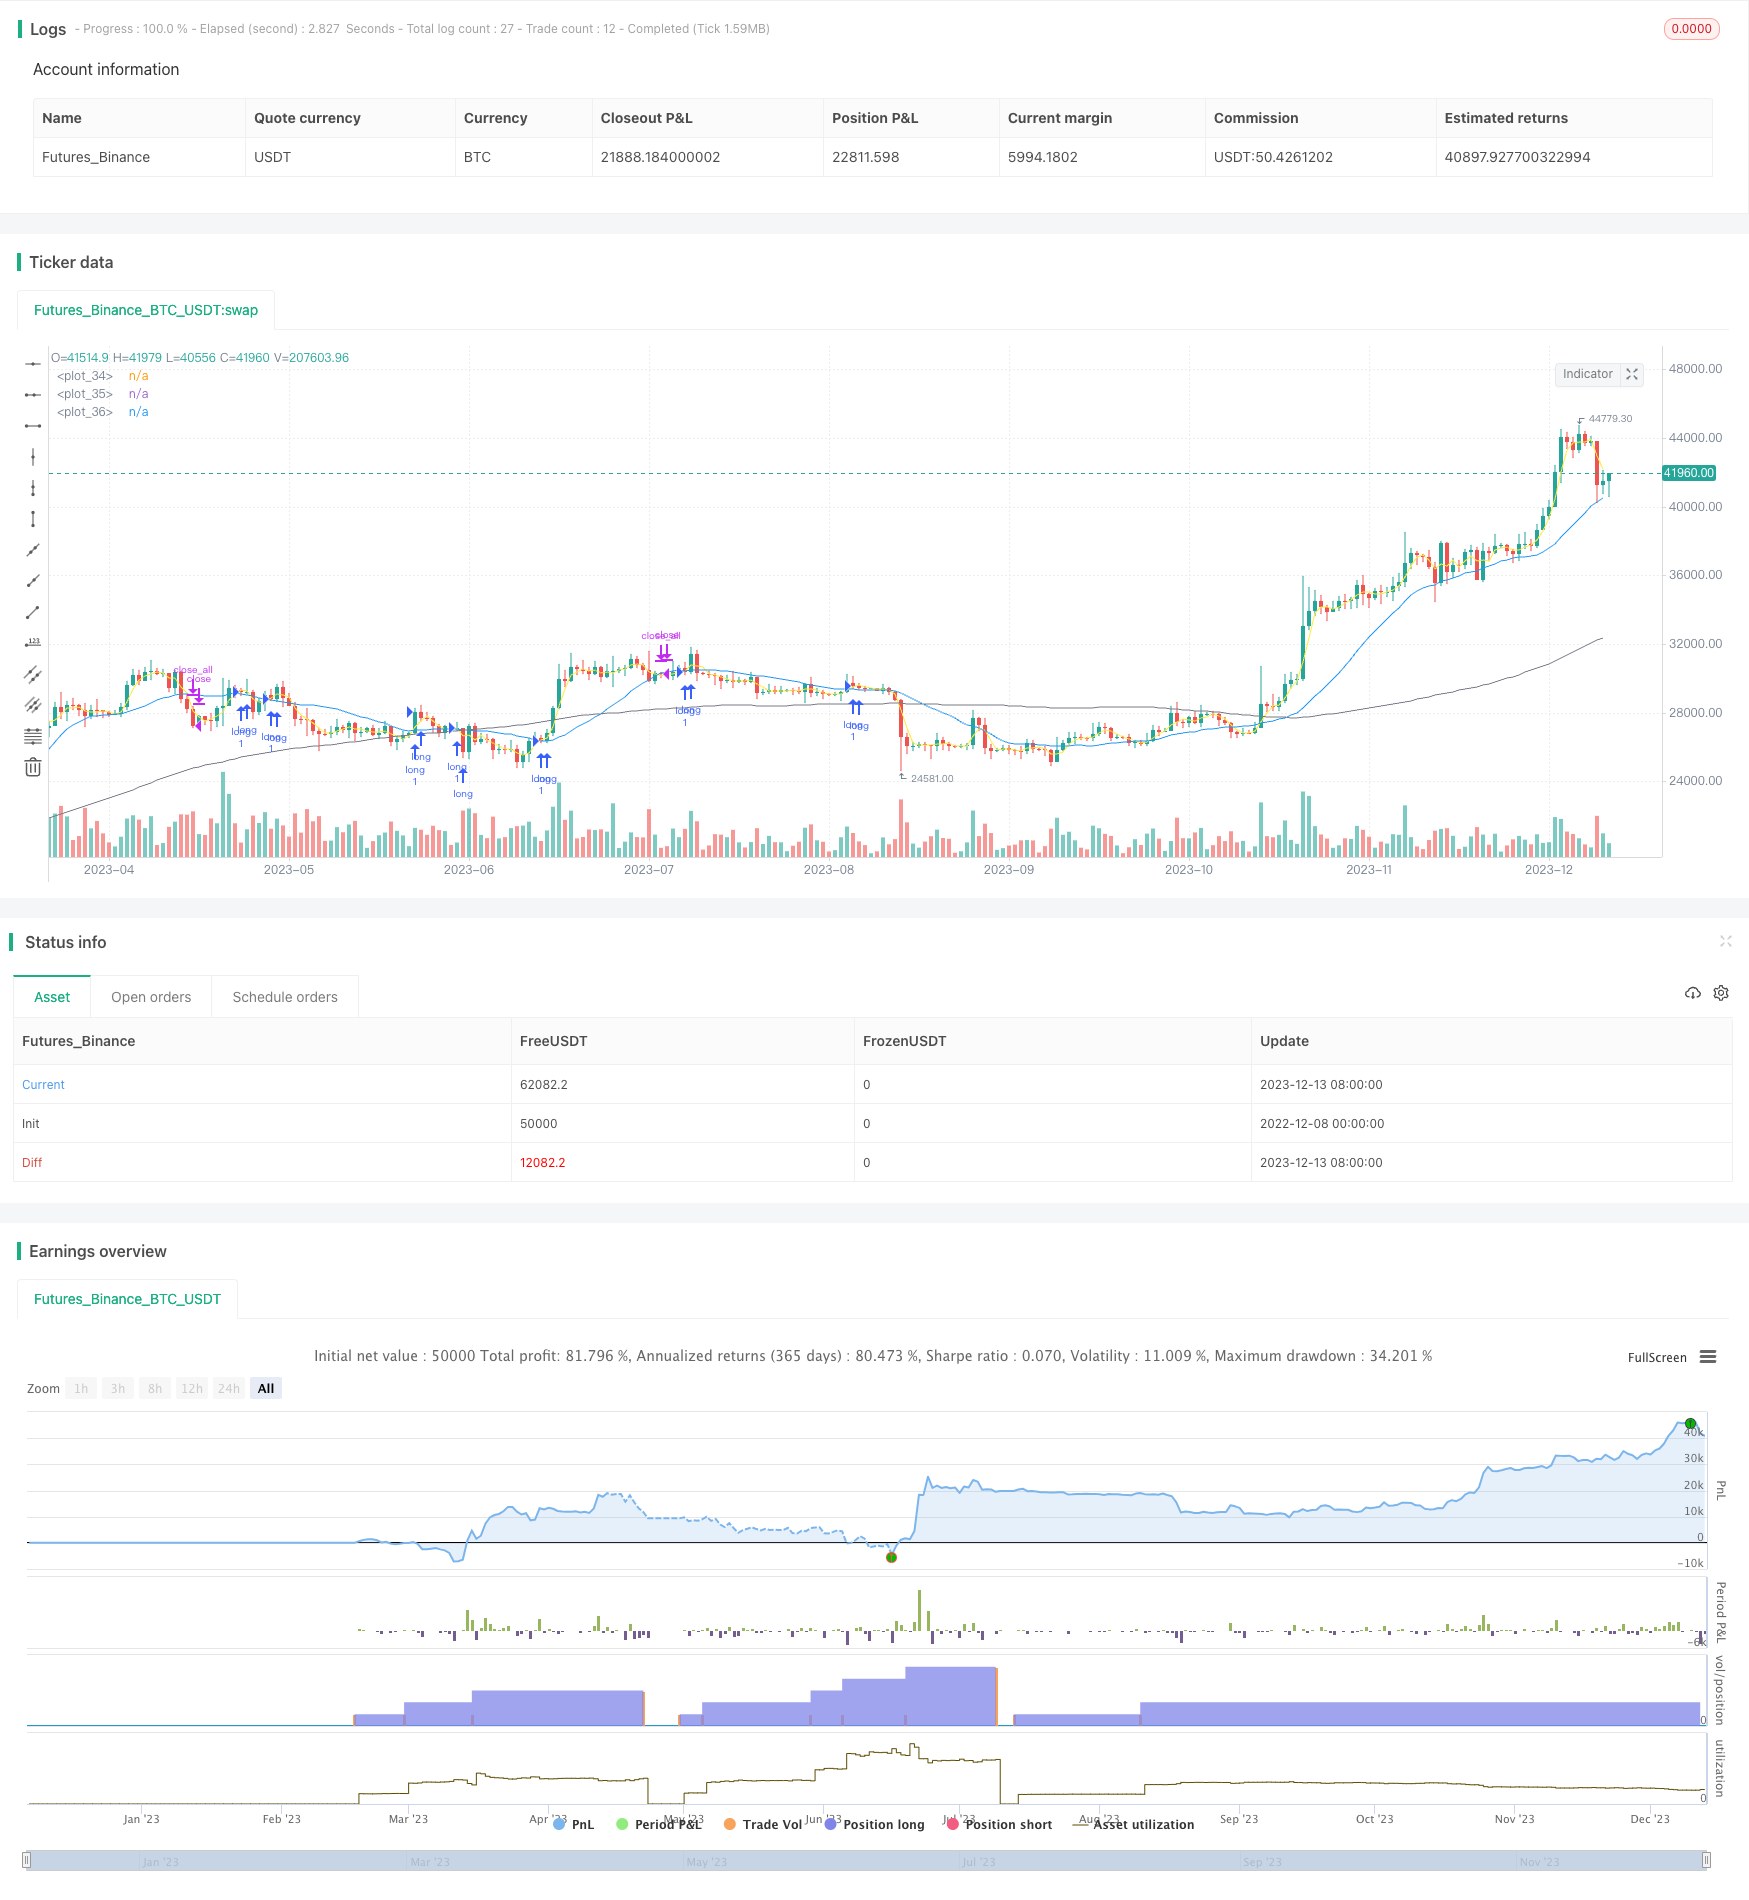
[trans]
概述
金叉死叉趋势追踪策略通过计算短期移动平均线和长期移动平均线的交叉来判断入市和出场时机。该策略同时结合大级别的趋势判断,在趋势向上时才入场做多,在趋势向下时会主动止损退出。
策略原理
该策略的核心指标是短期移动平均线和长期移动平均线。短期线一般选择5日、10日等较短的周期,能比较敏感地反映价格的最近变化。长期线一般选择20日、60日等较长的周期,能反映价格的主要趋势。当短期线从下方上穿长期线时产生金叉信号,代表行情进入多头趋势;当短期线从上方下穿长期线时产生死叉信号,代表行情进入空头阶段。
该策略同时使用更长周期的移动平均线来判断大级别的趋势方向。只有当大趋势向上时,才在金叉时机入场做多。在做多之后,会根据设置的止盈条件来止盈。当价格上涨幅度达到设置的止盈点时,会主动止盈离场。
在空头阶段,该策略则利用死叉信号来止损。当短期移动平均线从上往下突破长期移动平均线形成死叉时,如果此时持仓已经有一定程度的盈利,则会选择止损离场,去除空头带来的风险。
策略优势
金叉死叉策略判断入场和出场的规则简单清晰,容易理解和实现。同时结合趋势判断,能减少趋势交易中被套的风险。策略具有如下优势:
1. 入场准确,跟踪强势
金叉形成时,代表短期行情进入多头,价格可能出现一波突破和上涨。此时入场,能准确捕捉行情可能出现的突破机会。同时仅在大趋势向上时才入场,避免逆势做多被套。
2. 止盈方式合理,保证部分利润
设置固定比例的止盈幅度,并在达到时主动止盈。这种止盈方式简单实用,能够在行情大幅向上后及时离场,实现部分利润。
3. 止损及时,控制风险
在空头趋势到来时,利用死叉信号判定趋势反转,从而选择止损。及时止损能最大限度避免空头阶段带来的损失,对风险控制有效。
策略风险
该策略的主要风险来自于两方面:
1. 金叉死叉信号判断失误风险
在复杂的市场环境下,仅仅依靠金叉死叉这种简单指标来判断多空,可能会出现一定的误信号。复杂行情中Price Action的模式判断要比指标信号更为准确和立体。
2. 止盈止损点设置不当带来的风险
固定比例的止盈止损条件无法完全适应市场的变化。如果止盈幅度设置过小,会较早离场导致利润损失。如果止损点设置过大,则可能带来更大的损失。
为了应对这些风险,可以通过以下方式进行优化:
-
结合更多指标信号构建判断系统,提升识别趋势和关键点的能力。如使用成本线、通道线等。
-
利用动态止盈止损来代替静态比例。将止盈止损设置为可随行情变化调整的判定条件。
总结
金叉死叉趋势追踪策略,运用简单指标作为多空判断依据,原理容易理解。同时结合趋势来过滤信号,减少被套风险。具有判断清晰、动态止盈、及时止损等优点。但金叉死叉信号准确性有待提高,止盈止损方式也需要进一步优化,这是该策略面临的主要问题和改进方向。
||
Overview
The golden dead cross trend tracking strategy determines the timing of entry and exit by calculating the crossovers between short-term and long-term moving averages. At the same time, it also combines the judgment of larger time frame trends. It would only go long when the major trend goes up to avoid going against the trend.
Strategy Logic
The core indicators of this strategy are the short-term and long-term moving averages. The short-term line usually chooses relatively short periods like 5-day and 10-day to sensitively reflect the recent price changes. The long-term line usually chooses relatively long periods like 20-day and 60-day to reflect the major trend. When the short-term line goes above the long-term line, a golden cross is formed, indicating an uptrend. When the short-term line goes below the long-term line, a dead cross is formed, indicating a downtrend.
This strategy also uses an even longer period moving average to determine the direction of the major trend. It would only go long on golden crosses when the major trend is up. After going long, it would lock in profits based on the configured profit target. When the price rise hits the profit target, it would actively lock in profits and exit.
In downtrends, this strategy uses dead crosses to cut losses. When the short-term MA crosses below the long-term MA forming a dead cross, if the current position already has some profits at that point, it would choose to cut losses and exit to avoid risks associated with downtrends.
Advantages
The rules of using golden dead crosses are simple and clear, easy to understand and implement. Also, combining with trend analysis helps reduce the risk of being caught in trend trades. The advantages are:
1. Accurate entry, tracking strengths
The golden cross indicates the short-term trend has turned bullish and prices may breakout and rise. Entering at this point allows accurately capturing potential breakout opportunities. Also, only going long when the major trend is up avoids going against the trend.
2. Reasonable profit-taking, ensuring partial profits
By setting a fixed percentage as the profit target and actively taking profits when it is reached, this profit-taking approach is simple and practical to lock in partial profits after big rises.
3. Timely stop loss, controlling risks
Using dead crosses to determine trend reversal and cut losses in downtrends allows maximum avoiding risks and losses during downtrends, effectively controlling risks.
Risks
The main risks come from two aspects:
1. Inaccurate signal risks
In complex market environments, purely relying on simple indicators like golden dead crosses to determine trends can lead to some inaccurate signals. Price action patterns can be more accurate in complex environments.
2. Improper profit target and stop loss risks
Fixed percentage profit targets and stop losses cannot fully adapt to market changes. If profit percentage is too low, it would exit too early leading to lost profits. If stop loss percentage is too high, it may lead to larger losses.
To address these risks, some optimization methods include:
-
Using more indicators like baseline, channel lines to improve trend and key points recognition accuracy.
-
Use dynamic profit targets and stop losses instead of fixed percentages, with the ability to adjust based on market changes.
Conclusion
The golden dead cross trend tracking strategy uses simple indicators for trend determination, which is easy to understand. It also filters signals using trend analysis to reduce being caught in traps. It has the advantages of clear rules, dynamic profit-taking and timely stop losses. But the accuracy of cross signals needs improvement and profit targets and stop loss mechanisms require further optimization, which are the main problems and improvement directions.
[/trans]
Strategy Arguments
| Argument | Default | Description |
|---|---|---|
| v_input_int_1 | 3 | 단기 이평 |
| v_input_int_2 | 19 | 장기 이평 |
| v_input_float_1 | 3 | 최소수익률% |
| v_input_int_3 | 100 | (?추세 이평) 추세 이평 |
| v_input_bool_1 | true | 추세용 이평 사용 |
| v_input_bool_2 | true | (?기간 백테스트)특정 기간 백테스트 |
| v_input_1 | timestamp(1 Jan 2021) | 시작날짜 |
| v_input_2 | timestamp(1 Jan 2022) | 종료날짜 |
Source (PineScript)
/*backtest
start: 2022-12-08 00:00:00
end: 2023-12-14 00:00:00
period: 1d
basePeriod: 1h
exchanges: [{"eid":"Futures_Binance","currency":"BTC_USDT"}]
*/

// This source code is subject to the terms of the Mozilla Public License 2.0 at https://mozilla.org/MPL/2.0/
// © Ta3MooChi
//@version=5
strategy("전략", overlay=true,process_orders_on_close = true, pyramiding = 100)

short_ma = ta.sma(close,input.int(3, "단기 이평", minval = 1))
long_ma = ta.sma(close, input.int(19,"장기 이평", minval = 1))

trend_ma = ta.sma(close, input.int(100," 추세 이평", minval = 20, group = "추세 이평"))
up_trend = (trend_ma > trend_ma[1])
use_trend_ma = input.bool(true, title = "추세용 이평 사용", group = "추세 이평" )
inTrendMa = not use_trend_ma or up_trend

useDateFilter = input.bool(true, title = "특정 기간 백테스트", group = "기간 백테스트")
backtestStartDate = input(timestamp("1 Jan 2021"), title = "시작날짜", group = "기간 백테스트")
backtestEndDate = input(timestamp("1 Jan 2022"), title = "종료날짜", group = "기간 백테스트")
inTradeWindow = true

longStopPerc = 1 + input.float(3, "최소수익률%", minval = 1)*0.01

longcondition = ta.crossover(short_ma, long_ma)
shortcondition = ta.crossunder(short_ma, long_ma)

if (longcondition) and inTradeWindow and inTrendMa
    strategy.entry("long", strategy.long)

if (shortcondition) and (close > strategy.position_avg_price*longStopPerc) and inTradeWindow
    strategy.close_all()

if not inTradeWindow and inTradeWindow[1]
    strategy.cancel_all()
    strategy.close_all(comment = "매매 종료")

plot(short_ma,color = color.yellow)
plot(long_ma,color = color.blue)
plot(trend_ma,color = color.gray)
Detail
https://www.fmz.com/strategy/435513
Last Modified
2023-12-15 16:10:24