
11 KiB
Name
自适应移动平均线策略Malas-Adaptive-Moving-Average-Strategy
Author
ChaoZhang
Strategy Description
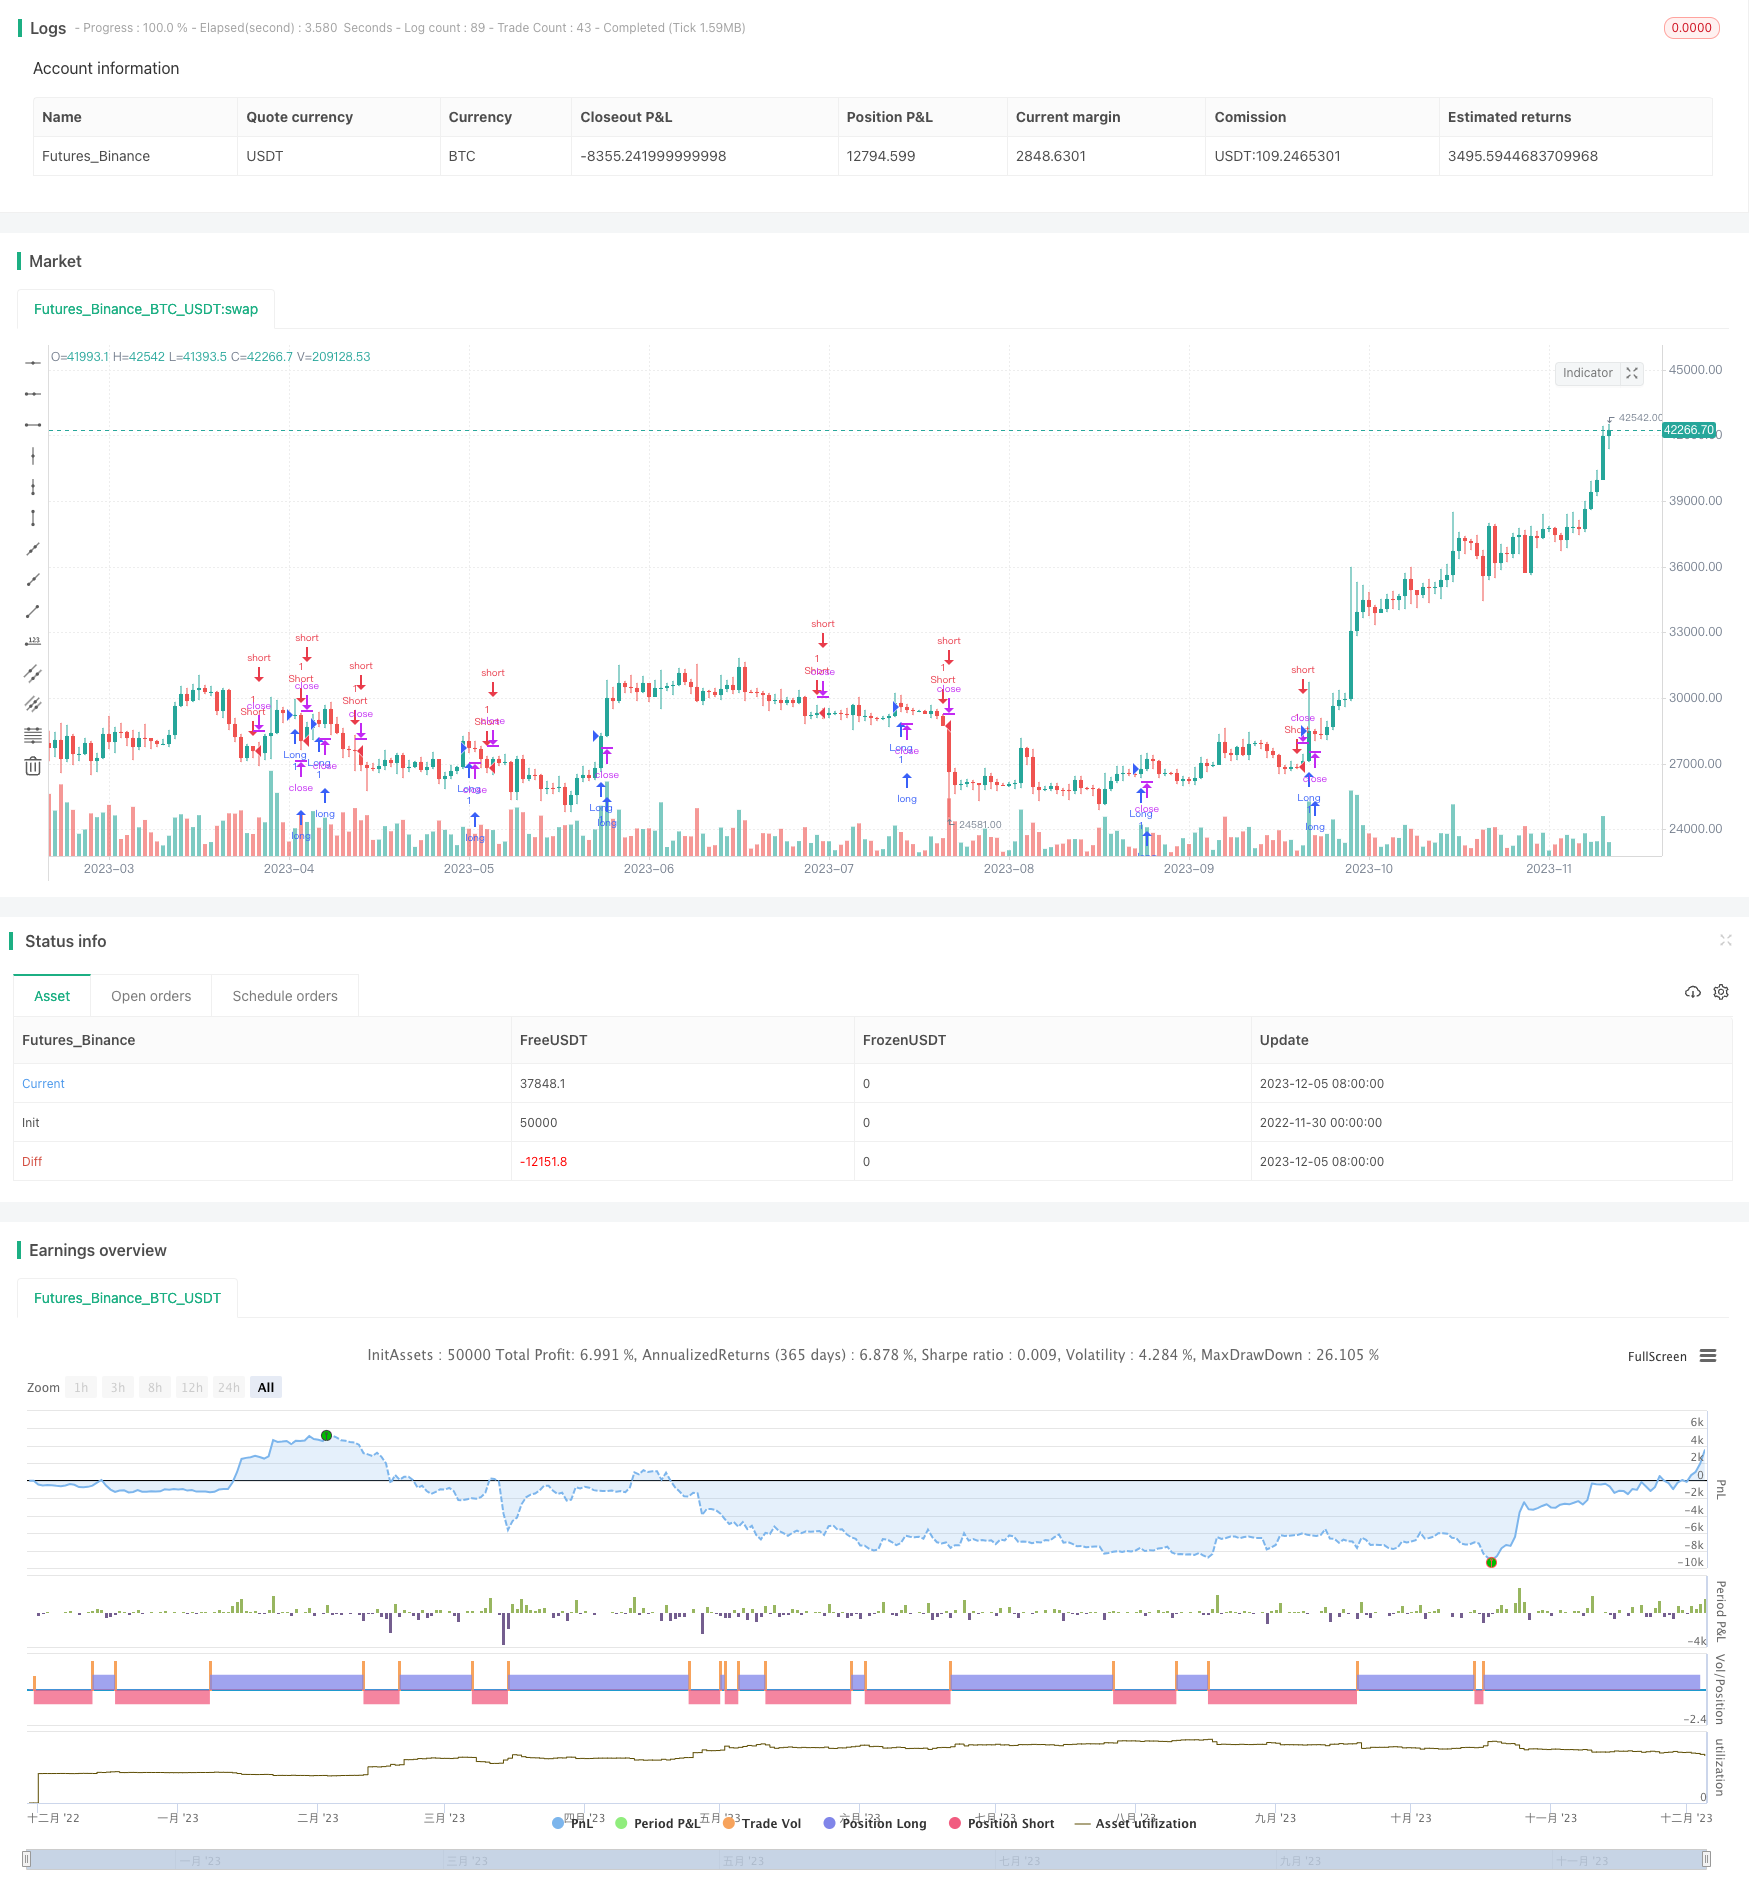 [trans]
概述
自适应移动平均线策略(Mala Adaptive Moving Average Strategy)是一个基于John Ehlers的MESA自适应移动平均线指标的量化交易策略。该策略运用正弦波进行交易决策,在低点买入,高点卖出,通过滑动调节参数使正弦波能够自适应不同品种和市场环境。
策略原理
自适应移动平均线策略使用正弦波生成器来产生交易信号。正弦波由一个转动的矢量(这称为相量)在竖直轴上投下的阴影确定。矢量转过360度时,完成一个周期。当矢量通过某个角度时就产生买入信号,通过另一个角度时产生卖出信号。这样,交易决策就是由频域中的角度定义的,而不是时域中的波形特征,可以使策略更加鲁棒,适应不同品种和市场环境。
具体来说,该策略首先对价格进行平滑和去趋势化处理,然后计算正弦波的两个分量:同相分量I和正交分量Q。这两个分量通过相位平移进行叠加和滤波,得到最终的Re和Im。Re和Im反映正弦波的频率信息,通过atan(Im/Re)可以推导出周期period。根据期望的周期范围确定一个平滑的周期smoothperiod。周期和相位信息确定MAMA和FAMA曲线,其交叉产生交易信号。参数alpha通过周期和相位变化率deltaphase动态调节,在一定范围内上下波动,使指标能够自适应市场环境的变化。
优势分析
自适应移动平均线策略具有以下优势:
-
使用正弦波和相位作为交易信号,使策略更加鲁棒,不受时域波形的影响。
-
周期和参数可以动态调整适应市场变化,具有很强的自适应能力。
-
MAMA和FAMA曲线只依赖价格本身的特征,没有滞后,可以及时捕捉趋势转换。
-
通过参数設定可以调整策略的灵敏度,适合不同风格的交易者。
-
策略逻辑清晰简单,容易理解和修改,适合用于研究和教学。
风险分析
自适应移动平均线策略也存在以下风险:
-
由于依赖正弦曲线周期和相位,当价格出现异常扭曲时会产生错误信号。
-
在周期判断时设置了硬性边界,这会使周期变化不够平滑。
-
相位和周期的蜂窝效应会使曲线在关键点附近震荡,可能错过最佳 Entries 和 Exits。
-
当市场波动加剧时,参数和曲线的自适应能力会下降。
-
作为技术指标,策略容易在重要技术位置出现假突破和错误信号。
这些风险可以通过设置更平滑的参数,结合其他指标进行过滤,调整持仓规模等方法加以缓解。
优化方向
自适应移动平均线策略可以从以下几个方面进行优化:
-
改进周期和参数的计算方法,使其变化更加平滑自然。例如可以引入统计方法对价格进行更好的建模。
-
结合波动率、成交量等指标对信号进行过滤,提高准确率。也可以结合基本面理解信号的可靠性。
-
优化参数设置和滑点控制,降低交易成本,提高系统的稳健性。
-
引入机器学习和遗传算法等方法动态优化参数,使系统参数不断演化和更新。
-
设定不同的 Entries 和 Exits,结合趋势和反转系统,建立组合,提高持续盈利能力。
总结
自适应移动平均线策略运用正弦波分析产生交易信号,通过动态调节参数使得系统能够自主适应市场环境的变化,具有较强的鲁棒性和广泛的适用性。相比其他自适应移动平均线策略,它有更高的实战性和稳定性。但该策略作为一个技术策略,在关键技术位也会出现错误信号,这需要引入其他辅助工具进行过滤优化。通过不断完善,该策略有望成为一个值得推荐的自适应交易系统。
||
Overview
The Mala Adaptive Moving Average Strategy is a quantitative trading strategy based on the MESA Adaptive Moving Average indicator developed by John Ehlers. The strategy uses sine waves to make trading decisions, buying at lows, selling at highs. By sliding adjustment of parameters, the sine wave can adapt itself to different products and market environments.
Strategy Logic
The Mala Adaptive Moving Average strategy uses a sine wave generator to produce trading signals. The sine wave is determined by the shadow cast on the vertical axis by a rotating vector (called the phasor). When the vector rotates 360 degrees, one cycle is completed. Buying signals are generated when the vector passes one angle, and selling signals when it passes another angle. Thus, trading decisions are defined in terms of angles in the frequency domain rather than waveform characteristics in the time domain, making the strategy more robust across different futures contracts and market conditions.
Specifically, the strategy first smoothes and detrends the price, then calculates two components of the sine wave: the in-phase component I and the quadrature component Q. These two components are superimposed and filtered by phase shifting to obtain the final Re and Im. Re and Im reflect the frequency information of the sine wave. The period period can be derived from atan(Im/Re). A smoothed period smoothperiod is determined based on the expected period range. The period and phase information determine the MAMA and FAMA curves, the crossovers of which produce trading signals. The parameter alpha is dynamically adjusted within a certain range based on period and phase change rate deltapahse, allowing the indicator to adapt itself to changes in market conditions.
Advantage Analysis
The Mala Adaptive Moving Average Strategy has the following advantages:
-
Using sine waves and phases as trading signals makes the strategy more robust, unaffected by waveform characteristics in the time domain.
-
The adaptability of periods and parameters enables strong adaptiveness to market changes.
-
MAMA and FAMA curves depend solely on price features without lag, capturing trend reversals in a timely manner.
-
Sensitivity of the strategy can be adjusted through parameter tuning to suit different trading styles.
-
The clear and simple logic facilitates comprehension, modification and application for research and teaching.
Risk Analysis
The Mala Adaptive Moving Average Strategy also carries the following risks:
-
Relying on sine curve periods and phases, abnormal price distortions may generate incorrect signals.
-
Hard boundaries set in period estimation cause insufficient smoothness in period changes.
-
Phase locking and period locking around key points lead to oscillations of the curves, potentially missing optimal entries and exits.
-
Adaptability of parameters and curves decreases during intensified market volatility.
-
As a technical indicator, the strategy tends to produce false breakouts and wrong signals around important technical levels.
These risks could be alleviated through more smoothed parameters, signal filtering with other indicators, position sizing adjustment, etc.
Optimization Directions
The Mala Adaptive Moving Average Strategy can be improved in the following aspects:
-
Improve period and parameter calculation for more natural smoothness, e.g., introducing statistical methods for better price modeling.
-
Filter signals with volatility, volume and fundamentals to enhance accuracy.
-
Optimize parameter settings and slippage control to reduce trading costs and improve robustness.
-
Introduce machine learning and genetic algorithms for dynamic parameter optimization.
-
Develop combinations with trend and mean-reversion systems based on different entries and exits to improve profitability.
Conclusion
The Mala Adaptive Moving Average Strategy uses sine wave analysis to generate trading signals, automatically adapting itself to market changes through dynamic parameter tuning, making it quite robust and widely applicable. Compared to other adaptive moving average strategies, it demonstrates higher practicability and stability. But as a technical strategy, it is subject to wrong signals around important technical levels, requiring filtering and optimization with auxiliary tools. With continuous improvement, this strategy has the potential to become a recommended adaptive trading system.
[/trans]
Strategy Arguments
| Argument | Default | Description |
|---|---|---|
| v_input_1 | 0.5 | fastlimit |
| v_input_2 | 0.05 | slowlimit |
Source (PineScript)
/*backtest
start: 2022-11-30 00:00:00
end: 2023-12-06 00:00:00
period: 1d
basePeriod: 1h
exchanges: [{"eid":"Futures_Binance","currency":"BTC_USDT"}]
*/

// This source code is subject to the terms of the Mozilla Public License 2.0 at https://mozilla.org/MPL/2.0/
// © dongyun

//@version=4
strategy("自适应移动平均的MESA系统", overlay=true)

fastlimit = input(0.5,'')
slowlimit = input(0.05,'')

smooth = 0.0
detrender = 0.0
I1 = 0.0
Q1 = 0.0
JI = 0.0
JQ = 0.0
I2 = 0.0
Q2 = 0.0
Re = 0.0
Im = 0.0
period = 0.0
smoothperiod = 0.0
phase = 0.0
deltaphase = 0.0
alpha = 0.0
MAMA = 0.0
FAMA = 0.0
price = 0.0

price := (high + low)/2
PI = 2 * asin(1)

if (bar_index > 5)
	smooth := (4*price + 3*price[1] + 2*price[2] + price[3])/10
	detrender := (.0962*smooth + .5769*nz(smooth[2]) - .5769*nz(smooth[4]) - .0962*nz(smooth[6]))*(.075*nz(period[1]) + .54)

	// compute InPhase and Quadrature components
	Q1 := (.0962*detrender + .5769*nz(detrender[2]) - .5769*nz(detrender[4]) - .0962*nz(detrender[6]))*(.075*nz(period[1]) + .54)

	I1 := nz(detrender[3])

	// advance the pulse of i1 and q1 by 90 degrees
	JI := (.0962*I1 + .5769*nz(I1[2]) - .5769*nz(I1[4]) - .0962*nz(I1[6]))*(.075*nz(period[1]) + .54)
	JQ := (.0962*Q1 + .5769*nz(Q1[2]) - .5769*nz(Q1[4]) - .0962*nz(Q1[6]))*(.075*nz(period[1]) + .54)

	//phase addition for 3-bar averaging
	I2 := I1 - JQ
	Q2 := Q1 + JI

	//smooth the i and q components before applying
	I2 := .2*I2 + .8*nz(I2[1])
	Q2 := .2*Q2 + .8*nz(Q2[1])

	// hymodyne discriminator
	Re := I2*I2[1] + Q2*nz(Q2[1])
	Im := I2*Q2[1] + Q2*nz(I2[1])
	Re := .2*Re + .8*nz(Re[1])
	Im := .2*Im + .8*nz(Im[1])

	if (Im != 0 and Re != 0)
		period := 2 * PI/atan(Im/Re)

	if (period > 1.5 * nz(period[1]))
		period := 1.5*nz(period[1])

	if (period < .67*nz(period[1]))
		period := .67*nz(period[1])

	if (period < 6)
		period := 6

	if (period > 50)
		period := 50

	period := .2*period + .8*nz(period[1])
	smoothperiod := .33*period + .67*nz(smoothperiod[1])

	if (I1 != 0)
		phase := (180/PI) * atan(Q1/I1)

	deltaphase := nz(phase[1]) - phase

	if (deltaphase < 1)
		deltaphase := 1

	alpha := fastlimit/deltaphase
	if(alpha < slowlimit)
		alpha := slowlimit

	MAMA := alpha*price + (1 - alpha)*nz(MAMA[1])
	FAMA := .5*alpha*MAMA + (1 - .5*alpha)*nz(FAMA[1])

	if (FAMA < MAMA)
		strategy.entry("Long", strategy.long)
	else
		if (FAMA > MAMA)
			strategy.entry("Short", strategy.short)
Detail
https://www.fmz.com/strategy/434527
Last Modified
2023-12-07 11:08:18