
6.2 KiB
Name
突破通道趋势追踪策略Trend-Tracking-Strategy-Based-on-Channel-Breakouts
Author
ChaoZhang
Strategy Description
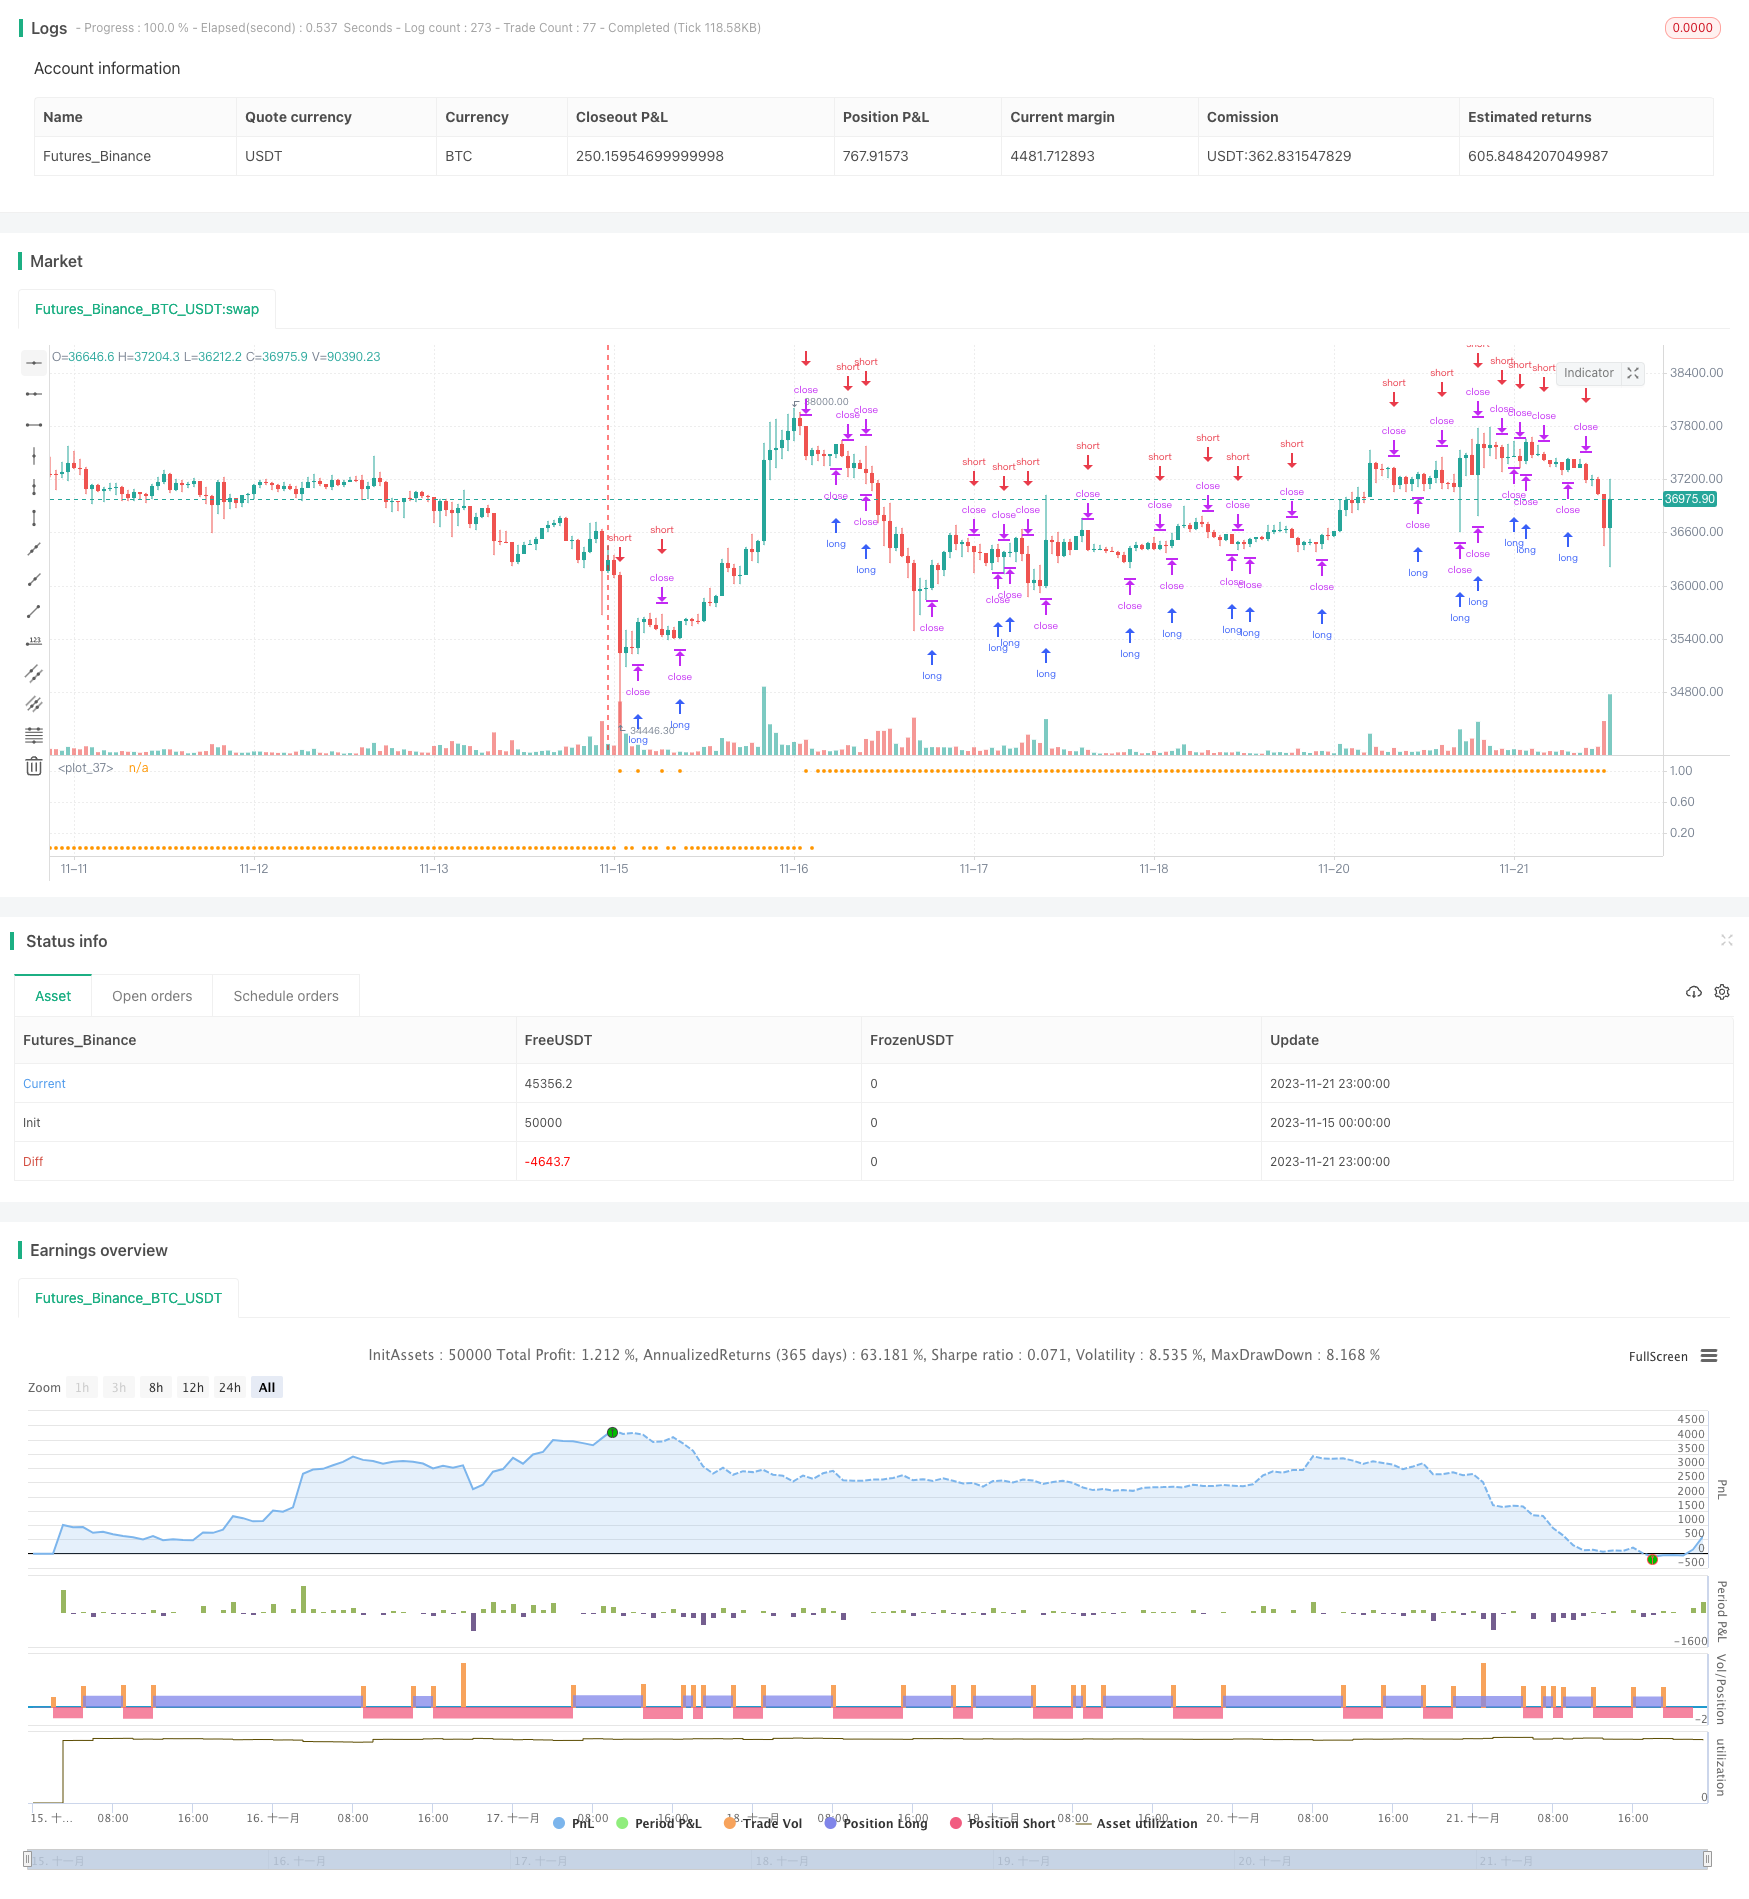 [trans]
概述
这个策略是基于通道突破理论设计的趋势追踪策略。它通过计算一定周期的最高价和最低价构建通道,当价格突破通道时产生交易信号。该策略适用于趋势性行情,可以捕捉价格的趋势方向,进行趋势追踪。
策略原理
该策略首先计算长度为length的周期内的最高价和最低价,构建通道上轨和下轨。当收盘价突破上轨时,做多;当收盘价突破下轨时,做空。平仓条件为收盘价回落到通道内。
该策略同时绘制长度为length*2的EMA指标判断趋势方向。当价格突破通道上轨时,如果EMA处于上升趋势,则增强做多决策的效力。
优势分析
- 该策略能够捕捉价格趋势,适合趋势性行情,收益潜力大。
- 通过通道来判断突破,可以减少假突破的概率,提高信号质量。
- 结合EMA判断可避免逆势交易,确保追踪主趋势。
风险分析
- 突破通道策略容易在价格震荡时产生频繁交易,可能带来较大的交易费用。
- 当趋势反转时,该策略无法及时平仓,可能带来较大亏损。
- 该策略对参数设置敏感,不同的参数会带来完全不同的结果。
优化方向
- 可以结合其他指标判断趋势,避免假突破。例如MACD,RSI等。
- 可以通过机器学习算法自动优化参数,提高参数鲁棒性。
- 可以设置止损来控制最大回撤。
总结
该策略整体来说是一个 based on channel breakouts to capture trends 的简单趋势追踪策略。它具有较强的趋势追踪能力,可以在趋势行情中获得不错的收益。但也存在一定的风险,需要进一步优化以提高稳定性。通过参数调整、止损设置以及结合其他指标判断,可以将该策略运用于实盘交易。
||
Overview
This strategy is a trend tracking strategy designed based on the channel breakout theory. It constructs a channel using highest price and lowest price over a certain period and generates trading signals when price breaks out of the channel. This strategy is suitable for trending markets and can capture the trend direction of the price for trend tracking.
Strategy Logic
The strategy first calculates the highest price and lowest price over a length period to construct the upper band and lower band of the channel. When the closing price breaks through the upper band, a long position is opened. When the closing price breaks through the lower band, a short position is opened. The position will be closed when price falls back into the channel.
The strategy also plots an EMA indicator with length *2 to determine the trend direction. When price breaks through the upper band, if EMA is in an upward trend, the long decision is strengthened.
Advantage Analysis
- The strategy can capture price trends and is suitable for trending markets with high profit potential.
- Using channel breakouts to generate signals can reduce false breakouts and improve signal quality.
- Combining with EMA to avoid trading against the trend and ensuring tracking the main trend.
Risk Analysis
- Breakout strategies tend to generate frequent trades during price consolidation, possibly incurring high trading costs.
- The strategy cannot exit positions promptly when trend reverses, which may lead to large losses.
- The strategy is sensitive to parameter settings and different parameters can lead to completely different results.
Optimization Directions
- Incorporate other indicators such as MACD, RSI to avoid false breakouts.
- Use machine learning algorithms to automatically optimize parameters and improve robustness.
- Set stop loss to control maximum drawdown.
Summary
In summary, this is a simple trend tracking strategy based on channel breakouts to capture trends. It has strong trend tracking capability and can achieve good returns in trending markets. But it also has some risks and needs further optimization to improve stability. Through parameter tuning, stop loss setting and combining with other indicators, this strategy can be applied to live trading.
[/trans]
Strategy Arguments
| Argument | Default | Description |
|---|---|---|
| v_input_1 | 2 | Length |
Source (PineScript)
/*backtest
start: 2023-11-15 00:00:00
end: 2023-11-22 00:00:00
period: 1h
basePeriod: 15m
exchanges: [{"eid":"Futures_Binance","currency":"BTC_USDT"}]
*/

//@version=3


initial_capital = 1000,
default_qty_value = 90,
default_qty_type = strategy.percent_of_equity,
pyramiding = 0,
commission_value = 0.002,
commission_type = strategy.commission.percent,
calc_on_every_tick = true
length_val = 2
max_bars_back = 1440
risk_max_drawdown = 9


strategy("Channel Break",max_bars_back=max_bars_back,initial_capital = initial_capital,default_qty_value = default_qty_value,default_qty_type = default_qty_type,pyramiding = pyramiding,commission_value = commission_value,commission_type = commission_type,calc_on_every_tick = calc_on_every_tick)
// strategy.risk.max_drawdown(risk_max_drawdown, strategy.percent_of_equity)

length = input(title="Length",  minval=1, maxval=1000, defval=length_val)

upBound = highest(high, length)
downBound = lowest(low, length)

//plot (upBound)
//plot (downBound)
//plot (close, color=red)
//plot (ema(close,length * 2), color=green)
//
if (not na(close[length]) and time>timestamp(2018, 02, 24, 0, 00) )
    strategy.entry("Buy", strategy.long, stop=upBound + syminfo.mintick, comment="Buy")
    strategy.entry("Short", strategy.short, stop=downBound - syminfo.mintick, comment="Short")

position = strategy.position_size


//plot(position , title="equity", color=red,style=cross,linewidth=4)
plot(variance(position,2)>0?1:0,style=circles,linewidth=4)

message = ""

if (position > 0)
    message = "BTCUSD L: " + tostring(strategy.position_size)
    na(position)

if (position < 0)
    message = "BTCUSD S: " + tostring(strategy.position_size)
    na(position)

alertcondition(variance(strategy.position_size,2) > 0, "test", message )
Detail
https://www.fmz.com/strategy/432994
Last Modified
2023-11-23 14:04:59