
188 lines
9.4 KiB
Markdown
188 lines
9.4 KiB
Markdown
|
|
> Name
|
|
|
|
基于价格极值点的趋势性交易策略Trend-Trading-Strategy-Based-on-Price-Extremum
|
|
|
|
> Author
|
|
|
|
ChaoZhang
|
|
|
|
> Strategy Description
|
|
|
|
|
|
|
|
[trans]
|
|
|
|
## 概述
|
|
|
|
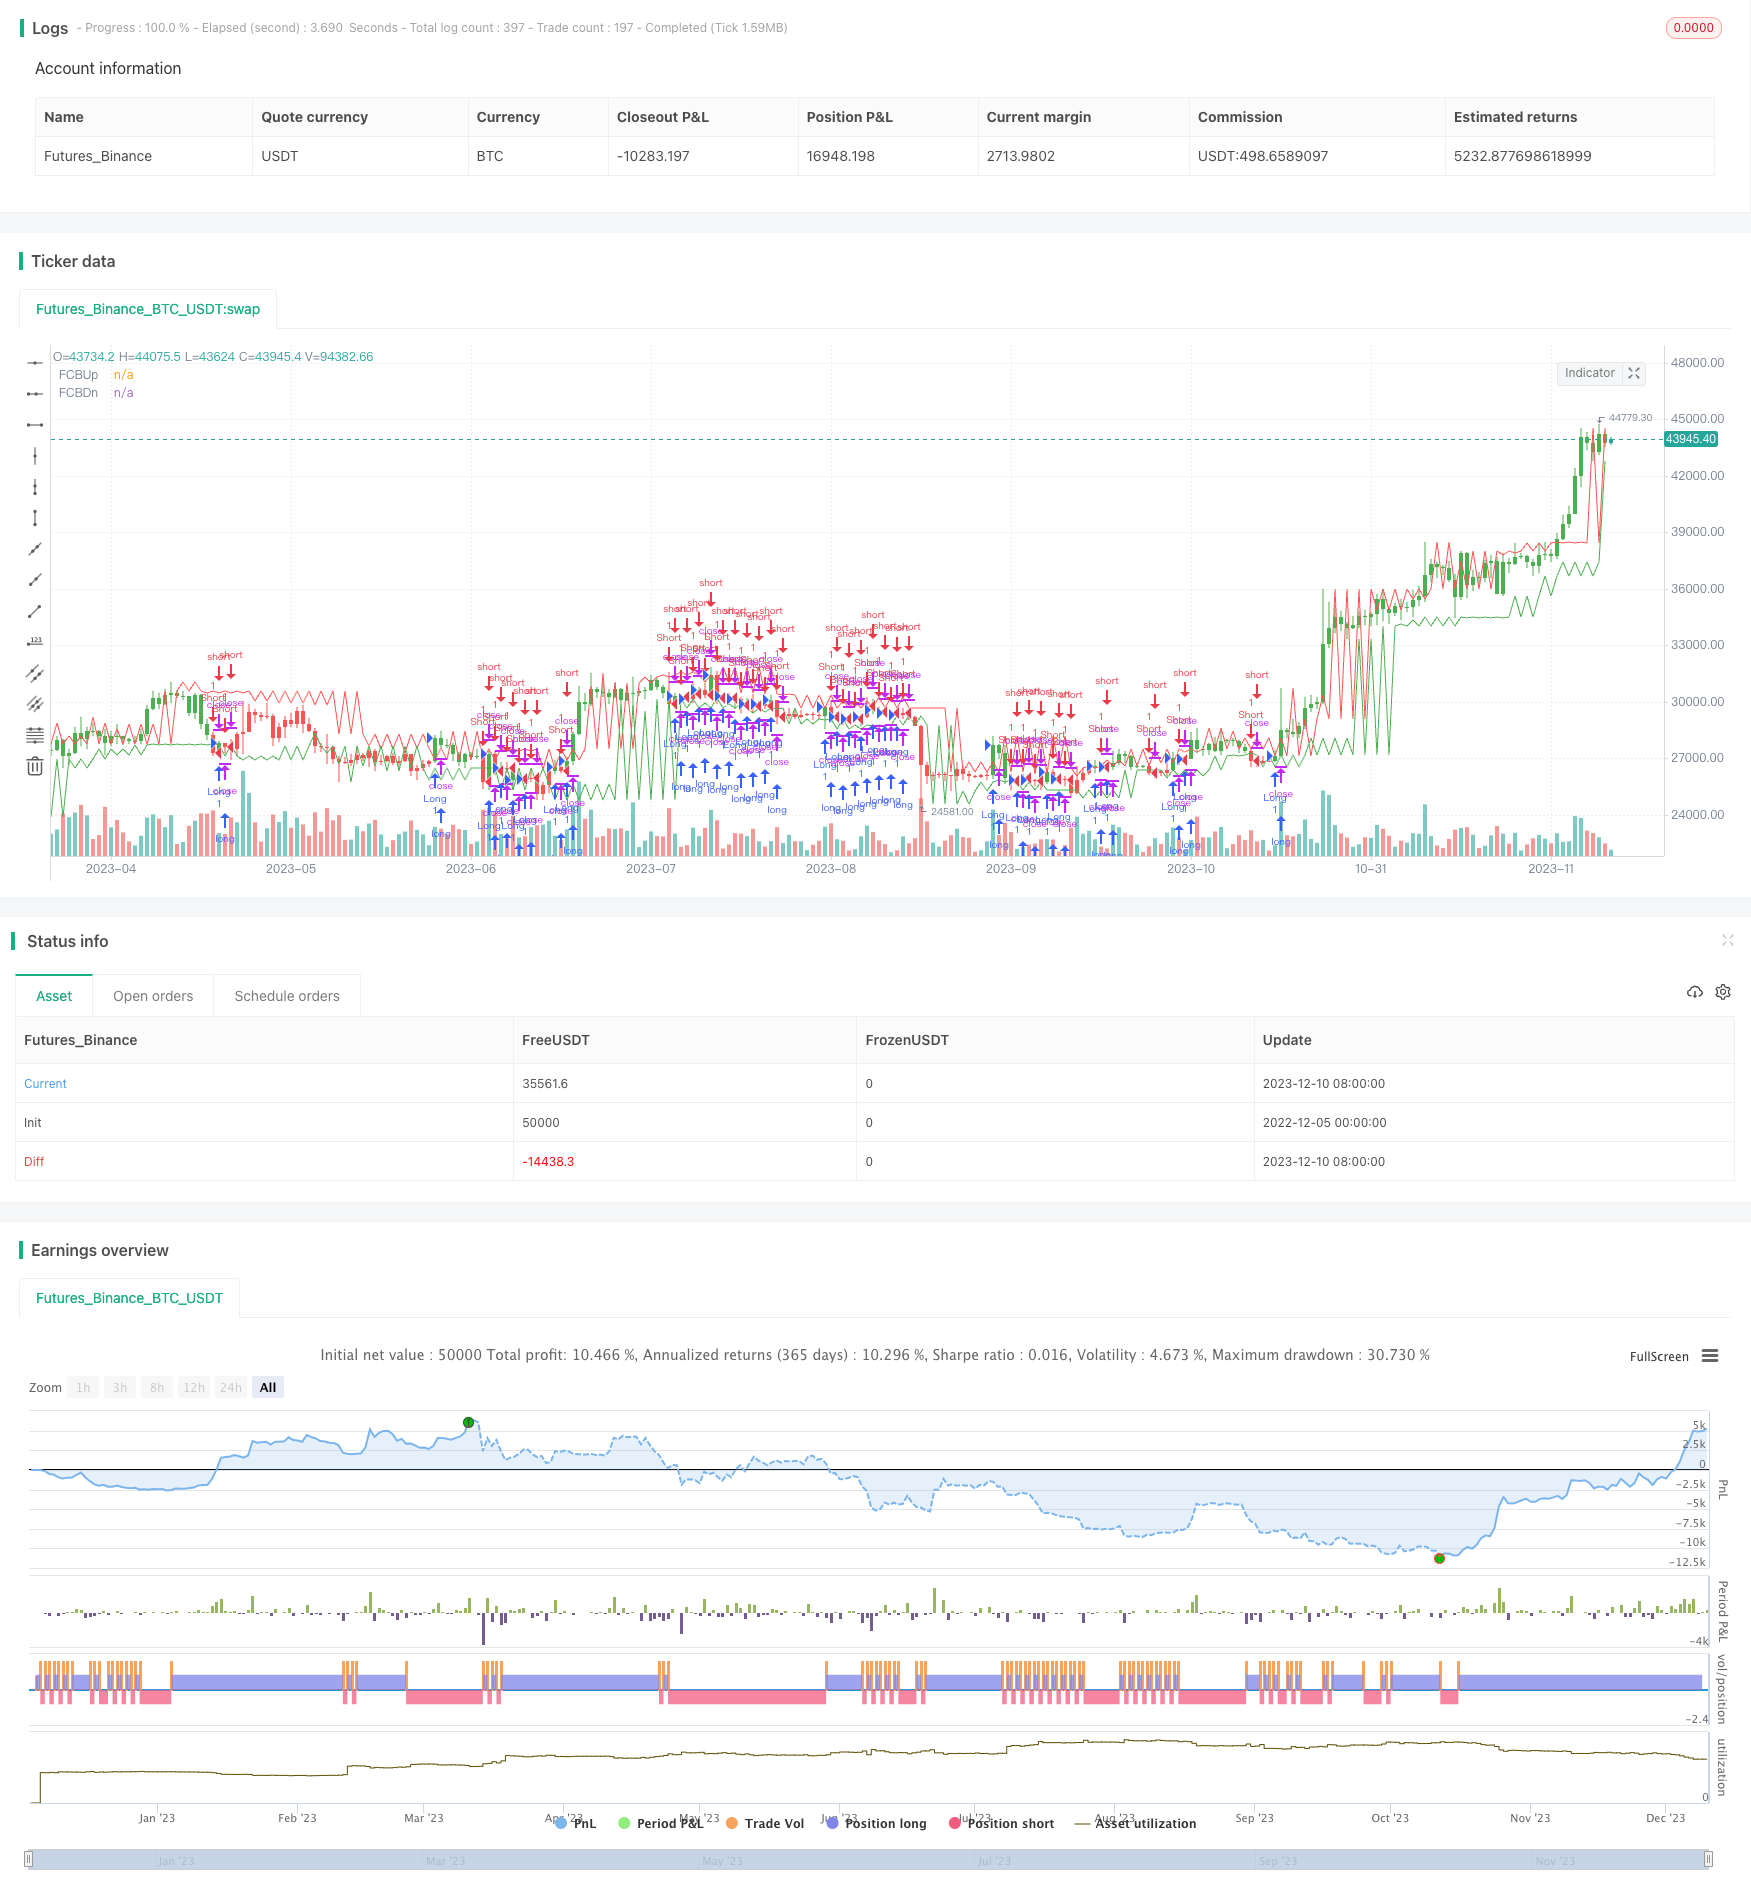
该策略通过计算一定周期内的价格极大值点和极小值点,形成上下轨,判断当前价格位于上轨之上或者下轨之下时,进行长仓或者短仓操作。策略主要判定价格的趋势性,在趋势增强的时候进行交易。
|
|
|
|
## 策略原理
|
|
|
|
该策略的核心指标是计算一定周期内的价格极大值点和极小值点。具体计算方法是:
|
|
|
|
上轨:从左到右扫描周期内的K线,找到一个极大值高点,再判断其左边第1根K线到最左端和右边到最后第1根K线是否都是低于该极大值高点的,如果是则确认该点为区间顶点。
|
|
|
|
下轨:从左到右扫描周期内的K线,找到一个极小值低点,再判断其左边第1根K线到最左端和右边到最后第1根K线是否都是高于该极小值低点的,如果是则确认该点为区间底点。
|
|
|
|
重复这样的计算,可以得到一定周期内价格的上下轨。当价格上穿上轨时做多,下穿下轨时做空。这样就形成一个基于价格极值点判定趋势性的交易策略。
|
|
|
|
## 优势分析
|
|
|
|
该策略判断趋势的方式比较原始直接,通过价格极值判断趋势增强的部分,可以有效过滤震荡场景,避免在震荡中交易。策略交易信号产生的位置比较有优势,容易形成趋势追踪。此外,策略取信号的方式比较严格,可以减少错误信号。
|
|
|
|
## 风险分析
|
|
|
|
该策略取信号比较严格,可能会漏掉较多交易机会。此外,极值点需要一定时间积累形成,会比较滞后,需要适当优化参数。在参数不当时,也很可能会产生错误信号。
|
|
|
|
可以适当减少极值点判断的严格程度,允许一定程度上的波动,这样可以减少误判风险。此外可以结合其他指标进行确认,避免错误信号。
|
|
|
|
## 优化方向
|
|
|
|
该策略判断上下轨的周期可以适当优化,使其能够更好地捕捉趋势。此外判断极值点时的扫描区间也可以进行调整。
|
|
|
|
为减少错过交易机会的可能,可以适当放宽极值点的判断条件,允许一定幅度的波动。
|
|
|
|
可以尝试结合其他指标进行确认,如量能指标、移动平均线等,避免因单一指标判断而产生的错误信号风险。
|
|
|
|
|
|
## 总结
|
|
|
|
该策略通过价格极值点判断价格趋势特征的方式比较直接有效,可以有效过滤震荡,判断趋势增强的时机,从而进行趋势交易。策略优势在于信号产生位置好,可以追捕趋势。不足之处在于信号可能比较滞后,较难捕捉转折。通过参数以及条件的优化,该策略可以成为一个较为可靠的趋势判断工具。
|
|
|
|
||
|
|
|
|
## Overview
|
|
|
|
This strategy calculates the maximum and minimum price points over a certain period to form upper and lower bands. When the current price breaks through the upper or lower band, long or short positions are taken. The strategy mainly judges the trend of prices and trades when the trend strengthens.
|
|
|
|
## Strategy Logic
|
|
|
|
The core indicator of this strategy is to calculate the maximum and minimum price points over a period. The specific calculation methods are:
|
|
|
|
Upper Band: Scan the K-line in the period from left to right to find a maximum high point, and then determine whether the 1st K-line on its left to the utmost left and the 1st K-line on its right to the utmost right are both lower than this maximum high point. If so, this point is confirmed as the top of the range.
|
|
|
|
Lower Band: Scan the K-line in the period from left to right to find a minimum low point, and then determine whether the 1st K-line on its left to the utmost left and the 1st K-line on its right to the utmost right are both higher than this minimum low point. If so, this point is confirmed as the bottom of the range.
|
|
|
|
By repeating this calculation, the upper and lower bands of prices over a period can be obtained. Take long positions when prices break through the upper band and take short positions when prices break through the lower band. This forms a trend trading strategy based on determining trend by price extremum points.
|
|
|
|
|
|
## Advantage Analysis
|
|
|
|
The way this strategy judges the trend is quite straightforward by determining the strengthening part of the trend through price extremum points, which can effectively filter out consolidation scenarios and avoid trading in consolidations. The signal generation position of the strategy has advantages and can easily form trend tracking. In addition, the strategy takes signals in a relatively strict way, which can reduce erroneous signals.
|
|
|
|
## Risk Analysis
|
|
|
|
The strategy takes signals quite strictly, which may miss more trading opportunities. In addition, extremum points need some time to accumulate and form, which will be relatively lagging. The parameters need proper optimization. When the parameters are improper, erroneous signals are also very likely to occur.
|
|
|
|
The strictness of judging the extremum points can be moderately reduced to allow some fluctuations to reduce the risk of misjudgment. In addition, confirmation can be made with other indicators to avoid wrong signals.
|
|
|
|
## Optimization Directions
|
|
|
|
The cycle for determining the upper and lower bands can be properly optimized to better capture the trend. In addition, the scanning range for judging extremum points can also be adjusted.
|
|
|
|
To reduce the possibility of missing trading opportunities, the conditions for determining extremum points can be moderately loosened to allow some fluctuation.
|
|
|
|
Attempts can be made to confirm with other indicators such as volume indicators, moving averages, etc. to avoid the risk of wrong signals resulting from single indicator judgment.
|
|
|
|
## Conclusion
|
|
|
|
The way this strategy judges trend characteristics by price extremum points is quite straightforward and effective. It can effectively filter out consolidation and determine the strengthening time of trends for trend trading. The advantage of the strategy lies in good signal generation position to chase trends. The shortcoming is that the signals may have some lag and it is difficult to capture turns. Through the optimization of parameters and conditions, this strategy can become a relatively reliable trend judging tool.
|
|
|
|
[/trans]
|
|
|
|
> Strategy Arguments
|
|
|
|
|
|
|
|
|Argument|Default|Description|
|
|
|----|----|----|
|
|
|v_input_1|true|Pattern|
|
|
|v_input_2|false|Trade reverse|
|
|
|
|
|
|
> Source (PineScript)
|
|
|
|
``` pinescript
|
|
/*backtest
|
|
start: 2022-12-05 00:00:00
|
|
end: 2023-12-11 00:00:00
|
|
period: 1d
|
|
basePeriod: 1h
|
|
exchanges: [{"eid":"Futures_Binance","currency":"BTC_USDT"}]
|
|
*/
|
|
|
|
//@version=2
|
|
////////////////////////////////////////////////////////////
|
|
// Copyright by HPotter v1.0 19/02/2018
|
|
// Stock market moves in a highly chaotic way, but at a larger scale, the movements
|
|
// follow a certain pattern that can be applied to shorter or longer periods of time
|
|
// and we can use Fractal Chaos Bands Indicator to identify those patterns. Basically,
|
|
// the Fractal Chaos Bands Indicator helps us to identify whether the stock market is
|
|
// trending or not. When a market is trending, the bands will have a slope and if market
|
|
// is not trending the bands will flatten out. As the slope of the bands decreases, it
|
|
// signifies that the market is choppy, insecure and variable. As the graph becomes more
|
|
// and more abrupt, be it going up or down, the significance is that the market becomes
|
|
// trendy, or stable. Fractal Chaos Bands Indicator is used similarly to other bands-indicator
|
|
// (Bollinger bands for instance), offering trading opportunities when price moves above or
|
|
// under the fractal lines.
|
|
//
|
|
// The FCB indicator looks back in time depending on the number of time periods trader selected
|
|
// to plot the indicator. The upper fractal line is made by plotting stock price highs and the
|
|
// lower fractal line is made by plotting stock price lows. Essentially, the Fractal Chaos Bands
|
|
// show an overall panorama of the price movement, as they filter out the insignificant fluctuations
|
|
// of the stock price.
|
|
//
|
|
// You can change long to short in the Input Settings
|
|
// WARNING:
|
|
// - For purpose educate only
|
|
// - This script to change bars colors.
|
|
////////////////////////////////////////////////////////////
|
|
fractalUp(pattern) =>
|
|
p = high[pattern+1]
|
|
okl = 1
|
|
okr = 1
|
|
for i = pattern to 1
|
|
okl := iff(high[i] < high[i+1] and okl == 1 , 1, 0)
|
|
for i = pattern+2 to pattern*2+1
|
|
okr := iff(high[i] < high[i-1] and okr == 1, 1, 0)
|
|
res = iff(okl == 1 and okr == 1, p, res[1])
|
|
res
|
|
|
|
fractalDn(pattern) =>
|
|
p = low[pattern+1]
|
|
okl = 1
|
|
okr = 1
|
|
for i = pattern to 1
|
|
okl := iff(low[i] > low[i+1] and okl == 1 , 1, 0)
|
|
for i = pattern+2 to pattern*2+1
|
|
okr := iff(low[i] > low[i-1] and okr == 1, 1, 0)
|
|
res = iff(okl == 1 and okr == 1, p, res[1])
|
|
res
|
|
|
|
strategy(title="Fractal Chaos Bands", overlay = true)
|
|
Pattern = input(1, minval=1)
|
|
reverse = input(false, title="Trade reverse")
|
|
xUpper = fractalUp(Pattern)
|
|
xLower = fractalDn(Pattern)
|
|
pos = iff(close > xUpper, 1,
|
|
iff(close < xLower, -1, nz(pos[1], 0)))
|
|
possig = iff(reverse and pos == 1, -1,
|
|
iff(reverse and pos == -1, 1, pos))
|
|
if (possig == 1)
|
|
strategy.entry("Long", strategy.long)
|
|
if (possig == -1)
|
|
strategy.entry("Short", strategy.short)
|
|
barcolor(possig == -1 ? red: possig == 1 ? green : blue )
|
|
plot(xUpper, color=red, title="FCBUp")
|
|
plot(xLower, color=green, title="FCBDn")
|
|
```
|
|
|
|
> Detail
|
|
|
|
https://www.fmz.com/strategy/435123
|
|
|
|
> Last Modified
|
|
|
|
2023-12-12 14:36:14
|