
397 lines
14 KiB
Markdown
397 lines
14 KiB
Markdown
|
|
> Name
|
|
|
|
双重均线布林带趋势跟随策略Dual-Moving-Average-Bollinger-Bands-Trend-Following-Strategy
|
|
|
|
> Author
|
|
|
|
ChaoZhang
|
|
|
|
> Strategy Description
|
|
|
|
|
|
[trans]
|
|
|
|
|
|
## 概述
|
|
|
|
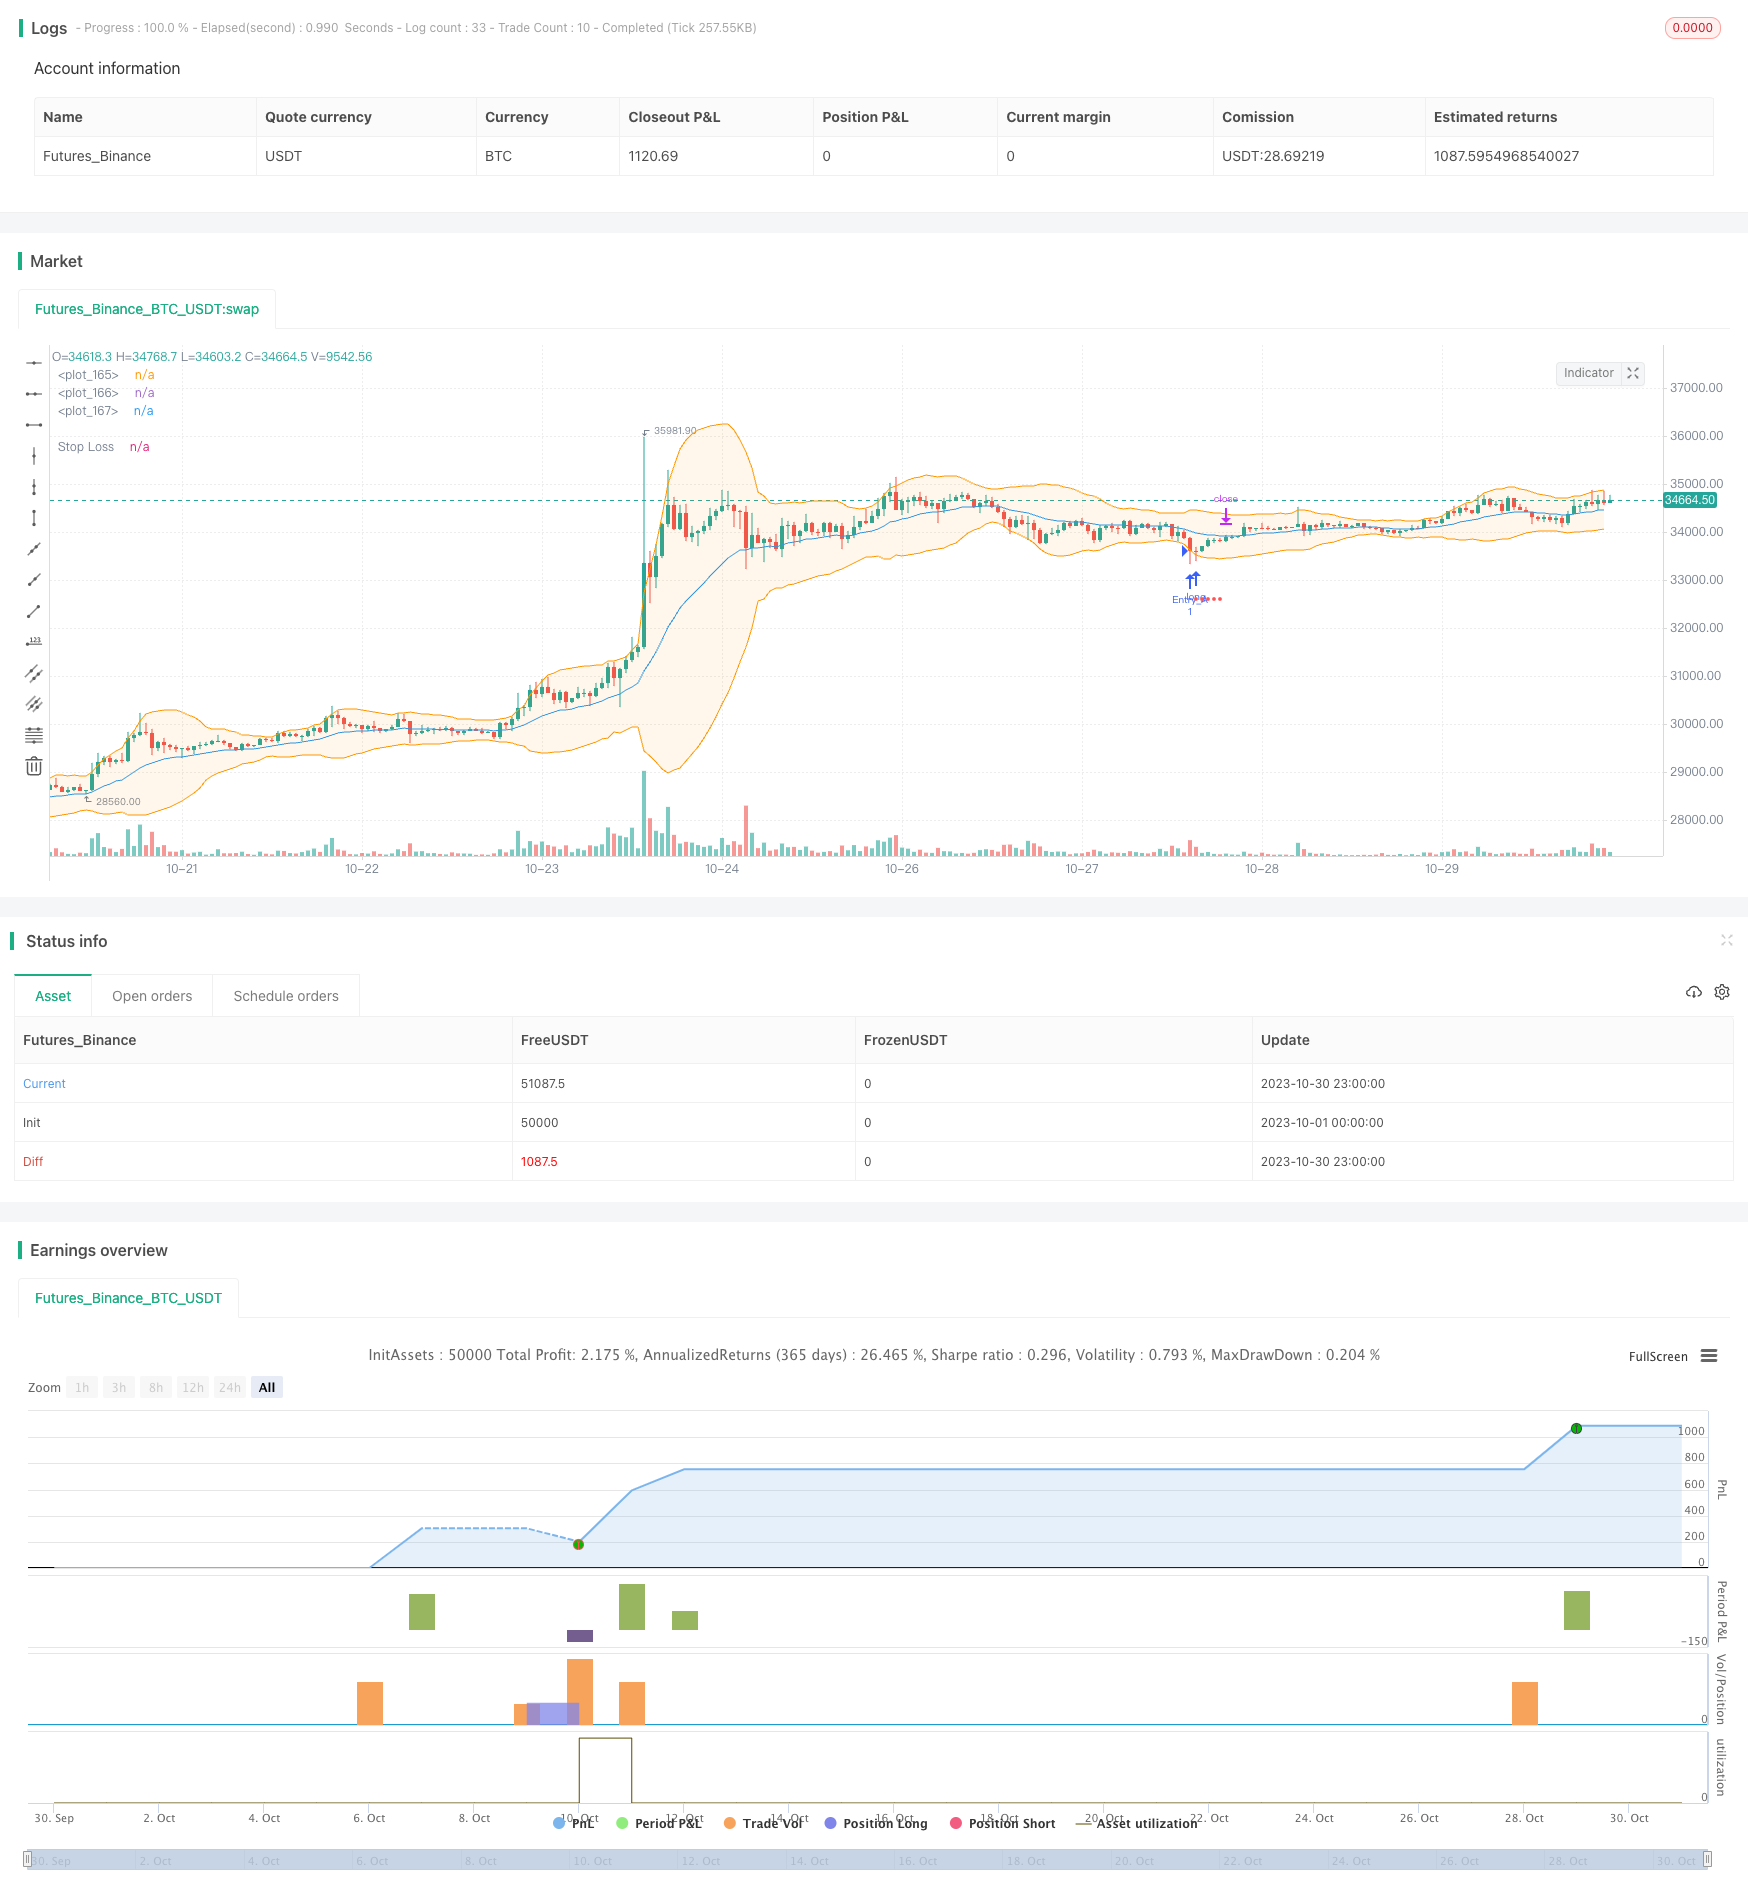
本策略基于布林带的双重均线进行趋势跟随的交易决策。其利用布林带上下轨的收敛和发散来判断趋势的变化,在布林带下轨附近买入,在上轨附近卖出,实现低买高卖,获利离场。
|
|
|
|
## 策略原理
|
|
|
|
该策略同时应用布林带的简单布林带和增强布林带两个版本。
|
|
|
|
简单布林带使用收盘价的SMA计算中轨,增强布林带使用收盘价的EMA计算中轨。
|
|
|
|
上下轨均通过中轨±N倍标准差计算得到。
|
|
|
|
策略根据布林带上下轨之间的距离(spread)来判断趋势,当spread小于设定阈值时,表示正在进入趋势区间,可以进行趋势跟随交易。
|
|
|
|
具体来说,当价格接近下轨时买入做多,接近上轨时卖出平仓。止损方式为固定止损百分比,同时可选择启用追踪止损。
|
|
|
|
目标利润取决于选择在中轨或上轨附近平仓。
|
|
|
|
该策略还可选择只在确保盈利的情况下卖出,防止亏损。
|
|
|
|
## 优势分析
|
|
|
|
该策略具有以下优势:
|
|
|
|
1. 双重布林带结合,提高决策效率
|
|
|
|
应用简单布林带和增强布林带,可以比较两种布林带的效果,选择更优版本,提高决策效率。
|
|
|
|
2. 根据布林带通道宽度判断趋势程度
|
|
|
|
当布林带通道收窄时,表示进入趋势行情,这时跟随趋势交易胜率更高。
|
|
|
|
3. 灵活的止盈止损方式
|
|
|
|
采用固定百分比止损以控制单笔损失。同时可选择中轨或上轨附近止盈,以及启用追踪止损来锁定更多利润。
|
|
|
|
4. 防止亏损的保护机制
|
|
|
|
只在确保盈利的情况下卖出,可以防止亏损的扩大。
|
|
|
|
## 风险分析
|
|
|
|
该策略也存在以下风险:
|
|
|
|
1. 回撤风险
|
|
|
|
跟随趋势交易本身存在一定回撤风险,需要承受连续亏损的心理压力。
|
|
|
|
2. 震荡行情风险
|
|
|
|
当布林带通道较宽时,表示行情可能进入震荡,此时该策略交易效果不佳,需要暂停交易等待趋势重新形成。
|
|
|
|
3. 止损被触发风险
|
|
|
|
固定百分比止损可能过于激进,需要调整为更温和的止损方式如ATR止损。
|
|
|
|
## 优化方向
|
|
|
|
该策略可以从以下方面进行优化:
|
|
|
|
1. 优化布林带参数
|
|
|
|
可以测试不同的均线参数、标准差倍数,找到更适合不同市场的布林带参数组合。
|
|
|
|
2. 结合其他指标过滤
|
|
|
|
可在布林带信号基础上,加入如MACD、KD等指标的过滤,减少震荡市的交易。
|
|
|
|
3. 优化止盈止损策略
|
|
|
|
可以测试不同的游动止损方式,或基于振幅、ATR等指标优化止损点。
|
|
|
|
4. 优化资金管理
|
|
|
|
优化每笔交易的仓位管理,并测试不同补仓策略。
|
|
|
|
## 总结
|
|
|
|
本策略整合双重布林带指标的优势,根据布林带通道宽度判断趋势程度,在趋势期间进行低吸高抛的跟踪交易。同时设置科学的止损机制来控制风险。该策略可通过参数优化和结合其他指标过滤来进一步提高稳定性。
|
|
|
|
||
|
|
|
|
|
|
## Overview
|
|
|
|
This strategy makes trading decisions based on dual moving average Bollinger Bands to follow the trend. It uses the convergence and divergence of the upper and lower rails of Bollinger Bands to determine trend changes, buying near the lower rail and selling near the upper rail, to achieve buying low and selling high.
|
|
|
|
## Strategy Logic
|
|
|
|
The strategy applies both simple Bollinger Bands and enhanced Bollinger Bands.
|
|
|
|
Simple Bollinger Bands use SMA of close prices for the middle band, while enhanced Bollinger Bands use EMA of close prices.
|
|
|
|
The upper and lower bands are calculated by middle band ± N standard deviations.
|
|
|
|
The strategy judges the strength of the trend based on the spread between the upper and lower bands. When the spread is below a threshold, it indicates the beginning of a trending period for trend following.
|
|
|
|
Specifically, when price approaches the lower band, it longs. When price approaches the upper band, it closes the position. The stop loss method is fixed percentage. Trailing stop can also be enabled.
|
|
|
|
Take profit depends on closing near the middle band or upper band.
|
|
|
|
The strategy can also choose to only sell at a profit to prevent losses.
|
|
|
|
## Advantage Analysis
|
|
|
|
The advantages of this strategy:
|
|
|
|
1. Dual Bollinger Bands improves efficiency
|
|
|
|
By comparing simple and enhanced Bollinger Bands, it can choose the better version for higher efficiency.
|
|
|
|
2. Spread judges trend strength
|
|
|
|
When spread narrows, it indicates a strengthening trend. Following the trend has a higher win rate.
|
|
|
|
3. Flexible profit taking and stop loss
|
|
|
|
Fixed percentage stop loss controls single trade loss. Take profit near middle or upper band. Trailing stop locks in more profit.
|
|
|
|
4. Protective mechanism against losses
|
|
|
|
Only selling at a profit prevents loss from expanding.
|
|
|
|
## Risk Analysis
|
|
|
|
The risks include:
|
|
|
|
1. Drawdown risk
|
|
|
|
Trend following itself carries drawdown risks. Need to endure consecutive losses mentally.
|
|
|
|
2. Whipsaw risk
|
|
|
|
When bands are wide, market may turn sideways. The strategy is less effective. Need to pause trading until trend resumes.
|
|
|
|
3. Stop loss triggered risk
|
|
|
|
Fixed percentage stop loss may be too aggressive. Need more moderate stop like ATR stop.
|
|
|
|
## Optimization Directions
|
|
|
|
The strategy can optimize on:
|
|
|
|
1. Bollinger Bands parameters
|
|
|
|
Test different MA lengths, standard deviation multiples to find optimal combinations for different markets.
|
|
|
|
2. Add filters
|
|
|
|
Add filters like MACD, KD on top of Bollinger signal to reduce trades during whipsaw markets.
|
|
|
|
3. Profit taking and stop loss
|
|
|
|
Test different trailing stop methods. Or optimize stop loss based on volatility, ATR etc.
|
|
|
|
4. Money management
|
|
|
|
Optimize position sizing per trade. Test different add-on strategies.
|
|
|
|
## Conclusion
|
|
|
|
This strategy combines the strengths of dual Bollinger Bands, judging trend strength by band width and trading pullbacks during trends. It also sets proper stop loss to control risks. Further improvements can be made through parameter optimization and adding filters.
|
|
|
|
[/trans]
|
|
|
|
> Strategy Arguments
|
|
|
|
|
|
|
|
|Argument|Default|Description|
|
|
|----|----|----|
|
|
|v_input_1|false|(?Select Strategy System)Trade on Simple Bollinger Bands |
|
|
|v_input_2|true|Trade on Augmented Bollinger Bands|
|
|
|v_input_3|20|(?Technical Inputs)Periods for Moving Average|
|
|
|v_input_4|2|Std|
|
|
|v_input_5|20000|(?Strategy Inputs)Max Spread Tolerance Beetween Bands|
|
|
|v_input_6_close|0|Entry data source: close|high|low|open|hl2|hlc3|hlcc4|ohlc4|
|
|
|v_input_7_high|0|Exit data source: high|close|low|open|hl2|hlc3|hlcc4|ohlc4|
|
|
|v_input_8|0|Profit to band:: middle|opposite|
|
|
|v_input_9|3|Stop Loss %|
|
|
|v_input_10|false|Activate trailing stop?|
|
|
|v_input_11|6|Trailing %|
|
|
|v_input_12|false|Only sell in profit (Stop Loss still active) |
|
|
|v_input_13|true|(?Date Control)===> From|
|
|
|v_input_14|2010|from year|
|
|
|v_input_15|true|from month|
|
|
|v_input_16|true|from day|
|
|
|v_input_17|true|===> To|
|
|
|v_input_18|2030|To year|
|
|
|v_input_19|true|To month|
|
|
|v_input_20|true|To day|
|
|
|
|
|
|
> Source (PineScript)
|
|
|
|
``` pinescript
|
|
/*backtest
|
|
start: 2023-10-01 00:00:00
|
|
end: 2023-10-31 00:00:00
|
|
period: 1h
|
|
basePeriod: 15m
|
|
exchanges: [{"eid":"Futures_Binance","currency":"BTC_USDT"}]
|
|
*/
|
|
|
|
// This source code is subject to the terms of the Mozilla Public License 2.0 at https://mozilla.org/MPL/2.0/
|
|
// © JCGMarkets
|
|
|
|
//@version=4
|
|
strategy("B.Bands | Augmented | Intra-range | Long-Only", shorttitle = "BB|A|IR|L", initial_capital=5000, commission_value=0.075, slippage = 1, overlay = true)
|
|
|
|
//Technical Indicators Data
|
|
show_simp = input(false, title="Trade on Simple Bollinger Bands ", type= input.bool, group="Select Strategy System")
|
|
show_augm = input(true, title="Trade on Augmented Bollinger Bands", type= input.bool, group="Select Strategy System")
|
|
periods = input(20, title="Periods for Moving Average", type =input.integer, minval = 2, step = 1, group="Technical Inputs")
|
|
std = input(2, title="Std", type = input.float, minval=0.1 , step = 0.1, group="Technical Inputs")
|
|
|
|
// Strategy data
|
|
max_spread_bb = input(20000.0, title="Max Spread Tolerance Beetween Bands", type=input.float, step=0.1, group="Strategy Inputs")
|
|
entry_source = input(close, title="Entry data source", type=input.source, group="Strategy Inputs")
|
|
exit_source = input(high, title="Exit data source", type=input.source, group="Strategy Inputs")
|
|
take_profit = input("middle", title = "Profit to band:", options = ["middle", "opposite"], group="Strategy Inputs")
|
|
stop_loss = input(3.00, title="Stop Loss %", type=input.float, step=0.05, group="Strategy Inputs")
|
|
trailing = input(false, title="Activate trailing stop?", type = input.bool, group="Strategy Inputs")
|
|
stop_perc = input(6.00, title="Trailing %", type=input.float, step=0.125, group="Strategy Inputs") * 0.01
|
|
sell_profit = input(false, title="Only sell in profit (Stop Loss still active) ", type= input.bool, group="Strategy Inputs")
|
|
|
|
|
|
var SL = 0.0
|
|
var SLT= 0.0
|
|
|
|
|
|
//Simple BB Calculation -> adapt if needed with different std for upper-lower, sma-ema, etc
|
|
middle_sim = sma(close, periods)
|
|
|
|
//Augmented BB Calculation -> adapt if needed with different std for upper lower, etc
|
|
middle_augm = ema(close, periods)
|
|
middle_upp = ema(high, periods)
|
|
middle_low = ema(low, periods)
|
|
|
|
//Multiplier
|
|
dev = stdev(close, periods) * std
|
|
|
|
//Upper & Lower Bands
|
|
upper = (middle_sim + dev)
|
|
lower = (middle_sim - dev)
|
|
|
|
//Augmented Bands
|
|
upper_augm = (middle_upp + dev)
|
|
lower_augm = (middle_low - dev)
|
|
|
|
//Bands Spread
|
|
spread = upper - lower
|
|
spread_augm = upper_augm - lower_augm
|
|
|
|
//From date
|
|
filter_from = input( true, title="===> From", group="Date Control")
|
|
from_y = input( 2010, title = "from year", group="Date Control")
|
|
from_m = input( 1, title = "from month", minval =1, maxval=12, group="Date Control")
|
|
from_d = input( 1, title = "from day", minval=1, maxval=31, group="Date Control")
|
|
|
|
//To date
|
|
filter_to = input( true, title="===> To", group="Date Control")
|
|
to_y = input( 2030, title = "To year", group="Date Control")
|
|
to_m = input( 1, title = "To month", minval =1, maxval=12, group="Date Control")
|
|
to_d = input( 1, title = "To day", minval=1, maxval=31, group="Date Control")
|
|
|
|
// Date Condition
|
|
In_date() => true
|
|
|
|
in_position = strategy.position_size > 0
|
|
|
|
// Trailing stop
|
|
SLT := if in_position and In_date()
|
|
stop_inicial = entry_source * (1 - stop_perc)
|
|
max(stop_inicial, SLT[1])
|
|
else
|
|
0
|
|
|
|
slts = (low <= SLT) and (trailing == true)
|
|
|
|
|
|
//Essential Trade logics
|
|
entry_long = (entry_source <= lower) and (spread < max_spread_bb)
|
|
entry_long_augm = (entry_source <= lower_augm) and (spread_augm < max_spread_bb)
|
|
|
|
// Simple Bollinger Conditions
|
|
|
|
if (not in_position and show_simp and In_date())
|
|
if entry_long
|
|
// Trigger buy order
|
|
position_size = round( strategy.equity / close ) // All available equity for this strategy example
|
|
strategy.entry("Entry", strategy.long, qty = position_size )
|
|
SL := close * (1 - (stop_loss / 100)) // You could determine wether or not implement stop loss with bool input and if condition here.
|
|
|
|
|
|
if in_position and show_simp and not sell_profit and In_date()
|
|
//Exits if not sell in profit
|
|
if take_profit == "middle"
|
|
strategy.exit("Target", "Entry", limit = middle_sim, stop = SL, comment="Exit")
|
|
if take_profit == "opposite"
|
|
strategy.exit("Target", "Entry", limit = upper, stop = SL, comment="Exit")
|
|
|
|
if in_position and show_simp and sell_profit and In_date()
|
|
//Exits if sell in profit
|
|
if take_profit == "middle"
|
|
strategy.exit("Target", "Entry", limit = (strategy.openprofit > 0 ? middle_sim: na), stop = SL, comment="Exit")
|
|
if take_profit == "opposite"
|
|
strategy.exit("Target", "Entry", limit = (strategy.openprofit > 0 ? upper: na), stop = SL, comment="Exit")
|
|
|
|
|
|
|
|
if in_position and show_simp and slts and In_date()
|
|
//Trailing activation
|
|
strategy.close("Entry", comment="SLT")
|
|
|
|
if not In_date()
|
|
//Exit due out of date range
|
|
strategy.close("Entry", comment="Out of date range")
|
|
|
|
|
|
|
|
// Augmented Bollinger Conditions
|
|
|
|
if (not in_position and show_augm and In_date())
|
|
if entry_long_augm
|
|
// Trigger buy order
|
|
position_size = round( strategy.equity / close )
|
|
strategy.entry("Entry_A", strategy.long, qty = position_size )
|
|
SL := close * (1 - (stop_loss / 100) )
|
|
|
|
if in_position and show_augm and not sell_profit and In_date()
|
|
//Exits and not sell in profit
|
|
if take_profit == "middle"
|
|
strategy.exit("Target", "Entry_A", limit = middle_augm, stop = SL, comment="Exit")
|
|
if take_profit == "opposite"
|
|
strategy.exit("Target", "Entry_A", limit = upper_augm, stop = SL, comment="Exit")
|
|
|
|
|
|
if in_position and show_augm and sell_profit and In_date()
|
|
//Exit only in profit
|
|
if take_profit == "middle"
|
|
strategy.exit("Target", "Entry_A", limit = (strategy.openprofit > 0 ? middle_augm:na), stop = SL, comment="Exit")
|
|
if take_profit == "opposite"
|
|
strategy.exit("Target", "Entry_A", limit = (strategy.openprofit > 0 ? upper_augm: na) , stop = SL, comment="Exit")
|
|
|
|
|
|
if in_position and show_augm and slts and In_date()
|
|
//Trigger trailing
|
|
strategy.close("Entry_A", comment="SLT")
|
|
|
|
if not In_date()
|
|
//Out of date trigger
|
|
strategy.close("Entry_A", comment= "Out of date range")
|
|
|
|
|
|
|
|
|
|
// Plotting
|
|
|
|
plot(in_position ? SL > 0 ? SL : na : na , style = plot.style_circles, color = color.red, title = "Stop Loss")
|
|
plot(in_position ? trailing ? SLT > 0 ? SLT : na : na : na , style = plot.style_circles, color = color.blue, title = "Trailing Stop" )
|
|
|
|
s = plot(show_simp ? upper : na , color = color.aqua)
|
|
plot(show_simp ? middle_sim : na , color=color.red)
|
|
i = plot(show_simp ? lower : na , color = color.aqua)
|
|
fill(s,i, color=color.new(color.aqua,90))
|
|
|
|
|
|
plot(show_augm ? middle_augm : na , color=color.blue)
|
|
s_a = plot( show_augm ? upper_augm : na, color=color.orange)
|
|
i_a = plot( show_augm ? lower_augm : na, color= color.orange)
|
|
fill(s_a,i_a, color=color.new(color.orange, 90))
|
|
```
|
|
|
|
> Detail
|
|
|
|
https://www.fmz.com/strategy/430749
|
|
|
|
> Last Modified
|
|
|
|
2023-11-01 14:15:11
|