
242 lines
14 KiB
Markdown
242 lines
14 KiB
Markdown
|
|
> Name
|
|
|
|
SPARK动态仓位与双重指标交易策略-SPARK-Dynamic-Position-Sizing-and-Dual-Indicator-Trading-Strategy
|
|
|
|
> Author
|
|
|
|
ChaoZhang
|
|
|
|
> Strategy Description
|
|
|
|
|
|
|
|
[trans]
|
|
#### 概述
|
|
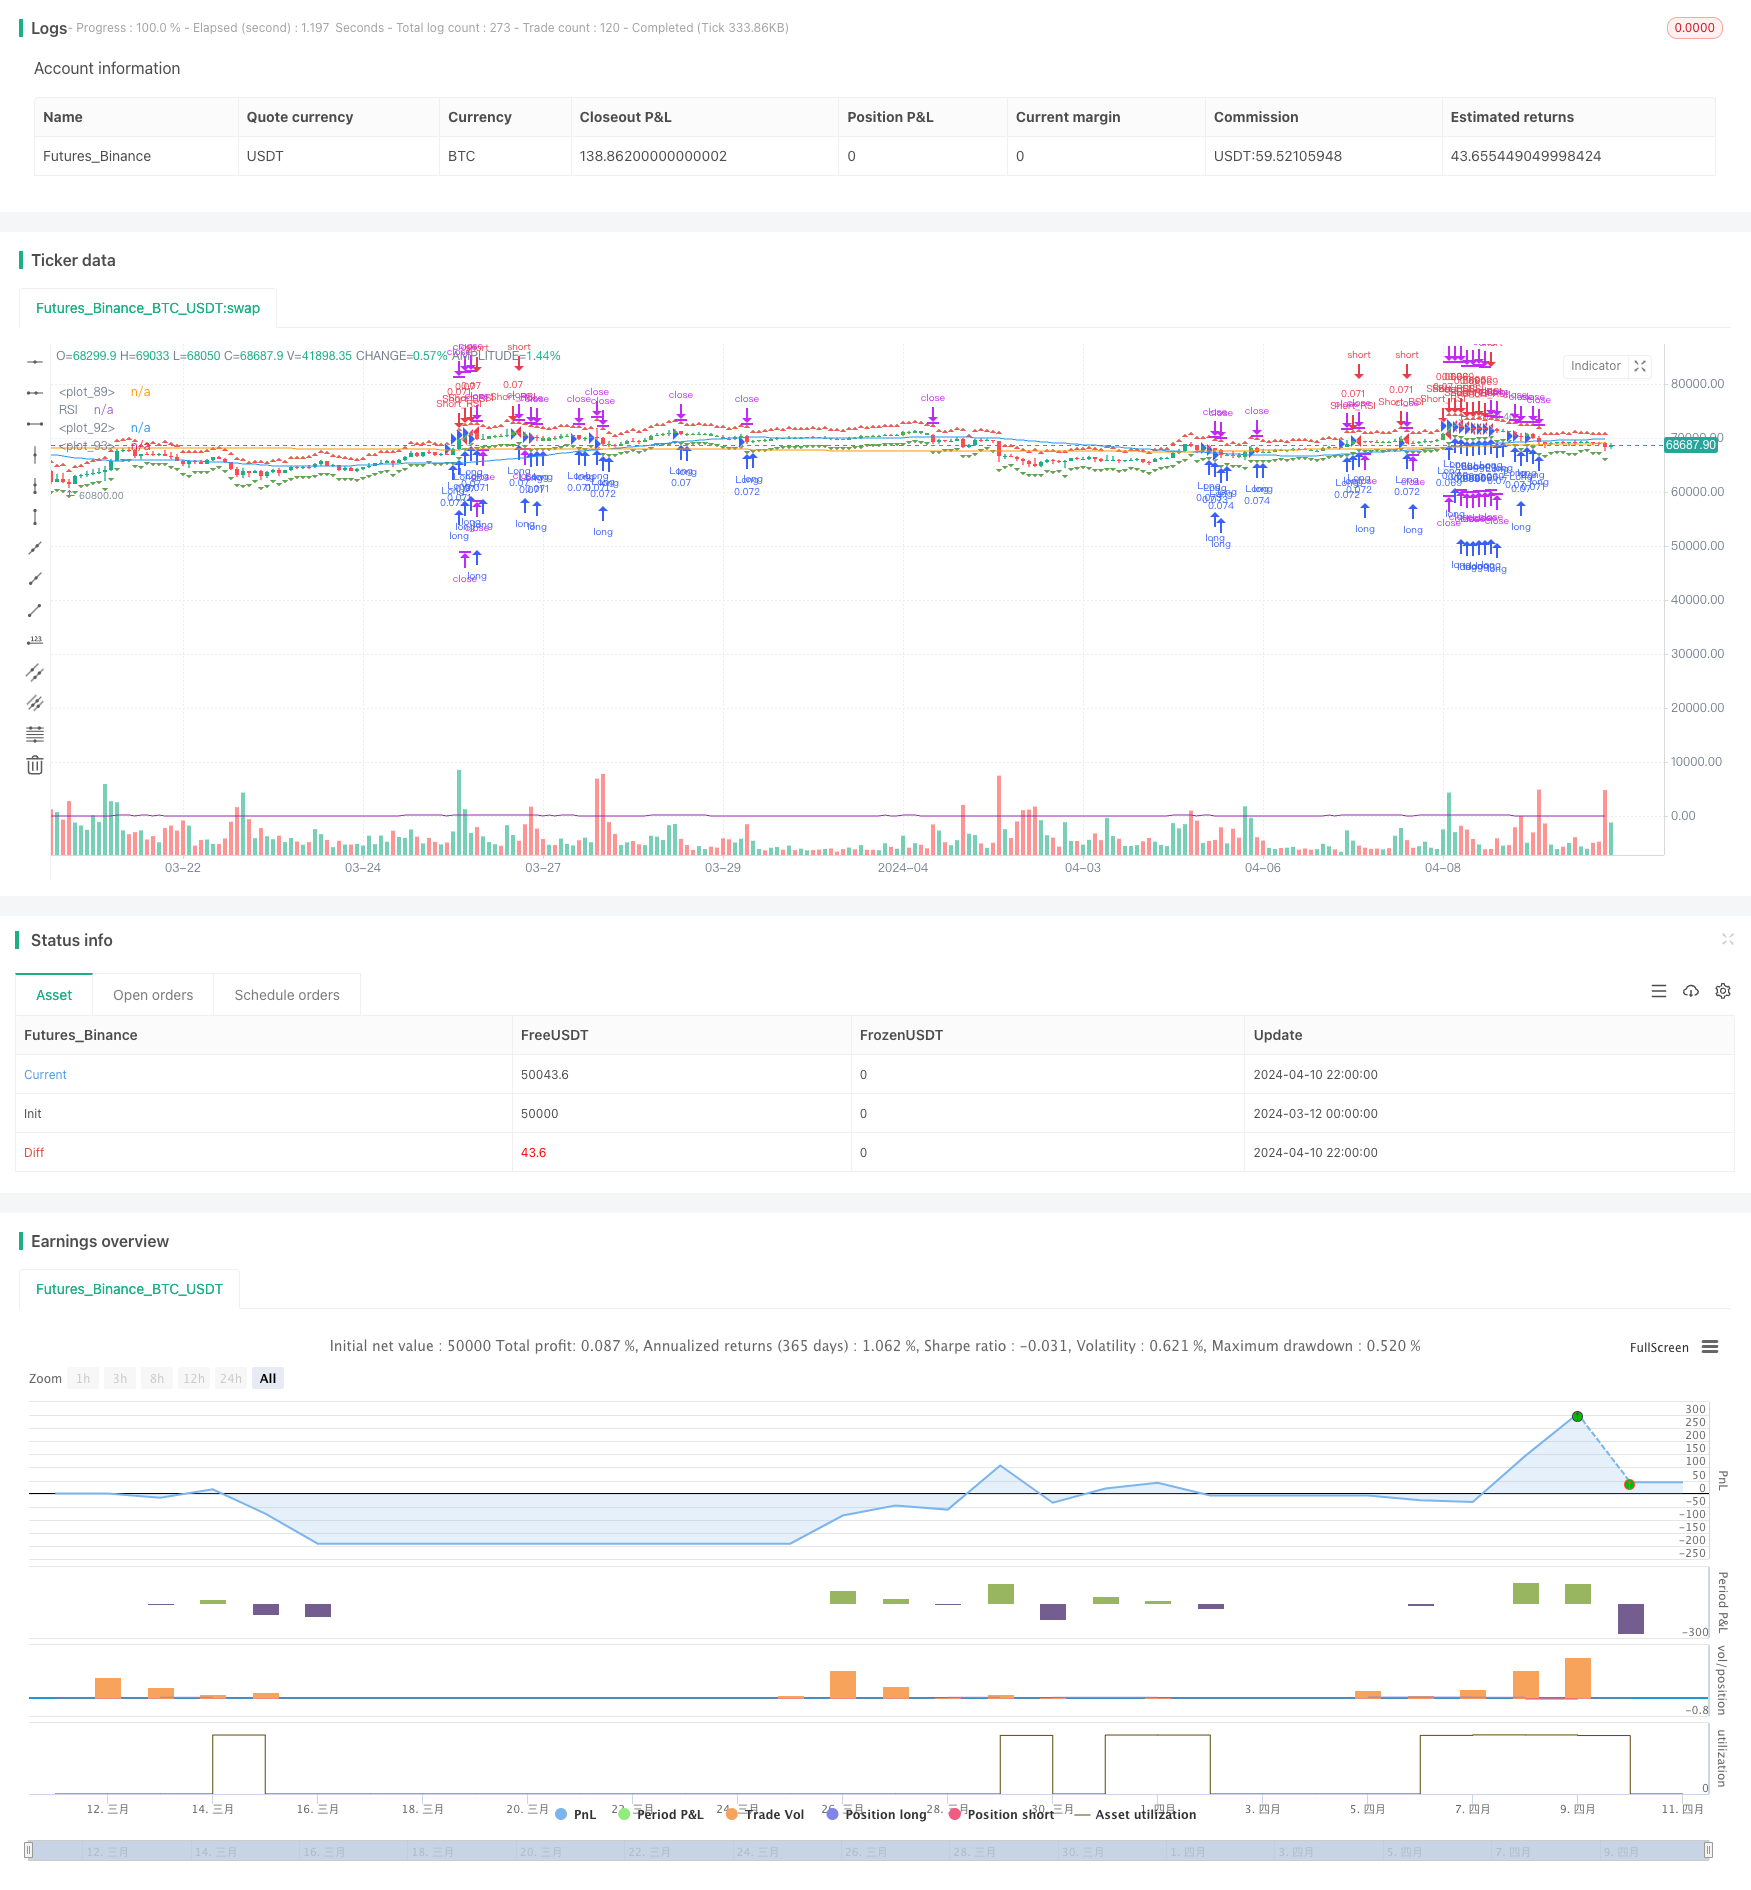
SPARK策略是一个结合动态仓位调整和双重指标确认的量化交易策略。该策略利用SuperTrend指标和相对强弱指数(RSI)来识别潜在的进场和出场点,同时使用动态仓位调整机制来优化资金分配。策略还提供了灵活的止盈止损设置,以及最小交易频率控制和方向性偏好选择等自定义参数。
|
|
|
|
#### 策略原理
|
|
SPARK策略的核心是SuperTrend指标和RSI指标的结合应用。SuperTrend指标通过比较收盘价与动态支撑阻力位置关系来判断趋势方向,而RSI指标则用于识别市场超买超卖状态。当SuperTrend和RSI指标同时满足特定条件时,策略将发出进场信号。
|
|
|
|
策略使用动态仓位调整机制来优化每笔交易的资金分配。通过设置投资组合百分比和杠杆率,策略可以根据当前市场状况和账户余额自动计算最佳仓位大小。此外,策略还提供了灵活的止盈止损设置,可以选择固定百分比或动态计算方式。
|
|
|
|
#### 策略优势
|
|
1. 双重指标确认:通过结合SuperTrend和RSI两个指标,SPARK策略可以更准确地识别潜在的进场和出场点,减少误判的可能性。
|
|
2. 动态仓位调整:策略采用动态仓位调整机制,可以根据投资组合百分比和杠杆率自动优化每笔交易的资金分配,提高资金利用效率。
|
|
3. 灵活的风险管理:策略提供了灵活的止盈止损设置,可以根据个人风险偏好选择固定百分比或动态计算方式,实现精确的风险控制。
|
|
4. 自定义参数:策略允许用户调整多个输入参数,如ATR长度、乘数、RSI阈值等,以适应不同的市场条件和交易偏好。
|
|
|
|
#### 策略风险
|
|
1. 市场风险:尽管SPARK策略采用了双重指标确认和动态仓位调整机制,但在极端市场条件下仍可能面临损失风险。
|
|
2. 参数优化风险:策略的性能在很大程度上取决于输入参数的选择。不恰当的参数设置可能导致策略表现不佳。
|
|
3. 过拟合风险:如果策略参数过度优化,可能导致策略在未来市场条件下表现不佳。
|
|
|
|
#### 策略优化方向
|
|
1. 引入更多指标:考虑引入其他技术指标,如MACD、布林带等,以进一步提高信号确认的准确性。
|
|
2. 优化止盈止损机制:探索更高级的止盈止损策略,如移动止损、动态止盈等,以更好地保护利润和限制损失。
|
|
3. 自适应参数调整:开发自适应机制,根据市场状况动态调整策略参数,以适应不断变化的市场环境。
|
|
|
|
#### 总结
|
|
SPARK策略通过结合SuperTrend和RSI指标,并采用动态仓位调整机制和灵活的风险管理工具,为交易者提供了一个全面的量化交易解决方案。尽管策略可能面临一些风险,但通过不断优化和改进,SPARK策略有望在各种市场条件下实现稳定的性能。
|
|
|
|
||
|
|
|
|
#### Overview
|
|
The SPARK strategy is a quantitative trading strategy that combines dynamic position sizing with dual indicator confirmation. The strategy utilizes the SuperTrend indicator and the Relative Strength Index (RSI) to identify potential entry and exit points while employing a dynamic position sizing mechanism to optimize capital allocation. The strategy also offers flexible take profit and stop loss settings, as well as customizable parameters such as minimum trading frequency and directional preference.
|
|
|
|
#### Strategy Principles
|
|
The core of the SPARK strategy lies in the combined application of the SuperTrend indicator and the RSI indicator. The SuperTrend indicator determines the trend direction by comparing the closing price with dynamic support and resistance levels, while the RSI indicator is used to identify overbought and oversold market conditions. When both the SuperTrend and RSI indicators simultaneously meet specific criteria, the strategy generates an entry signal.
|
|
|
|
The strategy employs a dynamic position sizing mechanism to optimize capital allocation for each trade. By setting a portfolio percentage and leverage ratio, the strategy automatically calculates the optimal position size based on current market conditions and account balance. Additionally, the strategy offers flexible take profit and stop loss settings, allowing users to choose between fixed percentages or dynamically calculated levels.
|
|
|
|
#### Strategy Advantages
|
|
1. Dual Indicator Confirmation: By combining the SuperTrend and RSI indicators, the SPARK strategy can more accurately identify potential entry and exit points, reducing the likelihood of false signals.
|
|
2. Dynamic Position Sizing: The strategy employs a dynamic position sizing mechanism that automatically optimizes capital allocation for each trade based on portfolio percentage and leverage ratio, enhancing capital efficiency.
|
|
3. Flexible Risk Management: The strategy offers flexible take profit and stop loss settings, allowing users to choose between fixed percentages or dynamically calculated levels based on their risk preferences, enabling precise risk control.
|
|
4. Customizable Parameters: The strategy allows users to adjust multiple input parameters, such as ATR length, multiplier, and RSI thresholds, to adapt to different market conditions and trading preferences.
|
|
|
|
#### Strategy Risks
|
|
1. Market Risk: Despite the SPARK strategy's dual indicator confirmation and dynamic position sizing mechanism, it may still face the risk of losses under extreme market conditions.
|
|
2. Parameter Optimization Risk: The strategy's performance largely depends on the selection of input parameters. Inappropriate parameter settings may lead to suboptimal strategy performance.
|
|
3. Overfitting Risk: If the strategy parameters are over-optimized, it may result in poor performance under future market conditions.
|
|
|
|
#### Strategy Optimization Directions
|
|
1. Incorporating Additional Indicators: Consider incorporating other technical indicators, such as MACD, Bollinger Bands, etc., to further enhance the accuracy of signal confirmation.
|
|
2. Optimizing Take Profit and Stop Loss Mechanisms: Explore more advanced take profit and stop loss strategies, such as trailing stops, dynamic take profit levels, etc., to better protect profits and limit losses.
|
|
3. Adaptive Parameter Adjustment: Develop an adaptive mechanism that dynamically adjusts strategy parameters based on market conditions to adapt to the ever-changing market environment.
|
|
|
|
#### Summary
|
|
The SPARK strategy provides traders with a comprehensive quantitative trading solution by combining the SuperTrend and RSI indicators, employing a dynamic position sizing mechanism, and offering flexible risk management tools. Although the strategy may face certain risks, with continuous optimization and refinement, the SPARK strategy has the potential to deliver consistent performance across various market conditions.
|
|
[/trans]
|
|
|
|
> Strategy Arguments
|
|
|
|
|
|
|
|
|Argument|Default|Description|
|
|
|----|----|----|
|
|
|v_input_1|true|Activate Minimal Bars in Trade|
|
|
|v_input_2|10|Portfolio Percentage|
|
|
|v_input_3|true|Leverage|
|
|
|v_input_4|0|Use Fixed TP/SL: 1|0|
|
|
|v_input_5|2|Fixed Take Profit (%)|
|
|
|v_input_6|true|Fixed Stop Loss (%)|
|
|
|v_input_7|5|Minimum Bars Between Trades|
|
|
|v_input_8|0|Choose Trading Direction: Both|Short|Long|
|
|
|v_input_9|7|ATR Length for Trend 1|
|
|
|v_input_10|4|Multiplier for Trend 1|
|
|
|v_input_11|14|ATR Length for Trend 2|
|
|
|v_input_12|3.618|Multiplier for Trend 2|
|
|
|v_input_13|21|ATR Length for Trend 3|
|
|
|v_input_14|3.5|Multiplier for Trend 3|
|
|
|v_input_15|28|ATR Length for Trend 4|
|
|
|v_input_16|3.382|Multiplier for Trend 4|
|
|
|v_input_17|14|RSI Length|
|
|
|v_input_18|30|RSI Oversold|
|
|
|v_input_19|70|RSI Overbought|
|
|
|
|
|
|
> Source (PineScript)
|
|
|
|
``` pinescript
|
|
/*backtest
|
|
start: 2024-03-12 00:00:00
|
|
end: 2024-04-11 00:00:00
|
|
period: 2h
|
|
basePeriod: 15m
|
|
exchanges: [{"eid":"Futures_Binance","currency":"BTC_USDT"}]
|
|
*/
|
|
|
|
//@version=4
|
|
strategy("SPARK", shorttitle="SPARK", overlay=true)
|
|
|
|
// Choose whether to activate the minimal bars in trade feature
|
|
minBarsEnabled = input(true, title="Activate Minimal Bars in Trade")
|
|
portfolioPercentage = input(10, title="Portfolio Percentage", minval=1, maxval=100)
|
|
// Leverage Input
|
|
leverage = input(1, title="Leverage", minval=1)
|
|
|
|
// Calculate position size according to portfolio percentage and leverage
|
|
positionSizePercent = portfolioPercentage / 100 * leverage
|
|
positionSize = (strategy.initial_capital / close) * positionSizePercent
|
|
|
|
// Take Profit and Stop Loss settings
|
|
useFixedTPSL = input(1, title="Use Fixed TP/SL", options=[1, 0])
|
|
tp_sl_step = 0.1
|
|
fixedTP = input(2.0, title="Fixed Take Profit (%)", step=tp_sl_step)
|
|
fixedSL = input(1.0, title="Fixed Stop Loss (%)", step=tp_sl_step)
|
|
|
|
// Calculate Take Profit and Stop Loss Levels
|
|
takeProfitLong = close * (1 + fixedTP / 100)
|
|
takeProfitShort = close * (1 - fixedTP / 100)
|
|
stopLossLong = close * (1 - fixedSL / 100)
|
|
stopLossShort = close * (1 + fixedSL / 100)
|
|
|
|
// Plot TP and SL levels on the chart
|
|
plotshape(series=takeProfitLong, title="Take Profit Long", color=color.green, style=shape.triangleup, location=location.abovebar)
|
|
plotshape(series=takeProfitShort, title="Take Profit Short", color=color.red, style=shape.triangledown, location=location.belowbar)
|
|
plotshape(series=stopLossLong, title="Stop Loss Long", color=color.red, style=shape.triangleup, location=location.abovebar)
|
|
plotshape(series=stopLossShort, title="Stop Loss Short", color=color.green, style=shape.triangledown, location=location.belowbar)
|
|
|
|
// Minimum Bars Between Trades Input
|
|
minBarsBetweenTrades = input(5, title="Minimum Bars Between Trades")
|
|
|
|
// Inputs for selecting trading direction
|
|
tradingDirection = input("Both", "Choose Trading Direction", options=["Long", "Short", "Both"])
|
|
|
|
// SuperTrend Function
|
|
trendFlow(src, atrLength, multiplier) =>
|
|
atr = atr(atrLength)
|
|
up = hl2 - (multiplier * atr)
|
|
dn = hl2 + (multiplier * atr)
|
|
trend = 1
|
|
trend := nz(trend[1], 1)
|
|
up := src > nz(up[1], 0) and src[1] > nz(up[1], 0) ? max(up, nz(up[1], 0)) : up
|
|
dn := src < nz(dn[1], 0) and src[1] < nz(dn[1], 0) ? min(dn, nz(dn[1], 0)) : dn
|
|
trend := src > nz(dn[1], 0) ? 1 : src < nz(up[1], 0)? -1 : nz(trend[1], 1)
|
|
[up, dn, trend]
|
|
|
|
// Inputs for SuperTrend settings
|
|
atrLength1 = input(7, title="ATR Length for Trend 1")
|
|
multiplier1 = input(4.0, title="Multiplier for Trend 1")
|
|
atrLength2 = input(14, title="ATR Length for Trend 2")
|
|
multiplier2 = input(3.618, title="Multiplier for Trend 2")
|
|
atrLength3 = input(21, title="ATR Length for Trend 3")
|
|
multiplier3 = input(3.5, title="Multiplier for Trend 3")
|
|
atrLength4 = input(28, title="ATR Length for Trend 4")
|
|
multiplier4 = input(3.382, title="Multiplier for Trend 4")
|
|
|
|
// Calculate SuperTrend
|
|
[up1, dn1, trend1] = trendFlow(close, atrLength1, multiplier1)
|
|
[up2, dn2, trend2] = trendFlow(close, atrLength2, multiplier2)
|
|
[up3, dn3, trend3] = trendFlow(close, atrLength3, multiplier3)
|
|
[up4, dn4, trend4] = trendFlow(close, atrLength4, multiplier4)
|
|
|
|
// Entry Conditions based on SuperTrend and Elliott Wave-like patterns
|
|
longCondition = trend1 == 1 and trend2 == 1 and trend3 == 1 and trend4 == 1
|
|
shortCondition = trend1 == -1 and trend2 == -1 and trend3 == -1 and trend4 == -1
|
|
|
|
// Calculate bars since last trade
|
|
barsSinceLastTrade = barssince(tradingDirection == "Long" ? longCondition : shortCondition)
|
|
|
|
// Strategy Entry logic based on selected trading direction and minimum bars between trades
|
|
if tradingDirection == "Long" or tradingDirection == "Both"
|
|
if longCondition and (not minBarsEnabled or barsSinceLastTrade >= minBarsBetweenTrades)
|
|
strategy.entry("Long", strategy.long, qty=positionSize)
|
|
strategy.exit("TP/SL Long", from_entry="Long", stop=stopLossLong, limit=takeProfitLong)
|
|
|
|
if tradingDirection == "Short" or tradingDirection == "Both"
|
|
if shortCondition and (not minBarsEnabled or barsSinceLastTrade >= minBarsBetweenTrades)
|
|
strategy.entry("Short", strategy.short, qty=positionSize)
|
|
strategy.exit("TP/SL Short", from_entry="Short", stop=stopLossShort, limit=takeProfitShort)
|
|
|
|
// Color bars based on position
|
|
var color barColor = na
|
|
barColor := strategy.position_size > 0 ? color.green : strategy.position_size < 0 ? color.red : na
|
|
|
|
// Plot colored bars
|
|
plotcandle(open, high, low, close, color=barColor)
|
|
|
|
// Plot moving averages
|
|
plot(sma(close, 50), color=color.blue)
|
|
plot(sma(close, 200), color=color.orange)
|
|
|
|
// More customizable trading bot - adding a new indicator
|
|
// This indicator is the RSI (Relative Strength Index)
|
|
|
|
// RSI Inputs
|
|
rsi_length = input(14, title="RSI Length")
|
|
rsi_oversold = input(30, title="RSI Oversold")
|
|
rsi_overbought = input(70, title="RSI Overbought")
|
|
|
|
// Calculate RSI
|
|
rsi = rsi(close, rsi_length)
|
|
|
|
// Plot RSI
|
|
plot(rsi, color=color.purple, title="RSI")
|
|
|
|
// Entry Conditions based on RSI
|
|
rsi_long_condition = rsi < rsi_oversold
|
|
rsi_short_condition = rsi > rsi_overbought
|
|
|
|
// Strategy Entry logic based on RSI
|
|
if tradingDirection == "Long" or tradingDirection == "Both"
|
|
if rsi_long_condition and (not minBarsEnabled or barsSinceLastTrade >= minBarsBetweenTrades)
|
|
strategy.entry("Long_RSI", strategy.long, qty=positionSize)
|
|
strategy.exit("TP/SL Long_RSI", from_entry="Long_RSI", stop=stopLossLong, limit=takeProfitLong)
|
|
|
|
if tradingDirection == "Short" or tradingDirection == "Both"
|
|
if rsi_short_condition and (not minBarsEnabled or barsSinceLastTrade >= minBarsBetweenTrades)
|
|
strategy.entry("Short_RSI", strategy.short, qty=positionSize)
|
|
strategy.exit("TP/SL Short_RSI", from_entry="Short_RSI", stop=stopLossShort, limit=takeProfitShort)
|
|
|
|
```
|
|
|
|
> Detail
|
|
|
|
https://www.fmz.com/strategy/448076
|
|
|
|
> Last Modified
|
|
|
|
2024-04-12 17:22:47
|