
155 lines
7.6 KiB
Markdown
155 lines
7.6 KiB
Markdown
|
|
> Name
|
|
|
|
RSI2策略之日内反转胜率回测-RSI2-Strategy-Intraday-Reversal-Win-Rate-Backtest
|
|
|
|
> Author
|
|
|
|
ChaoZhang
|
|
|
|
> Strategy Description
|
|
|
|
|
|
|
|
[trans]
|
|
#### 概述
|
|
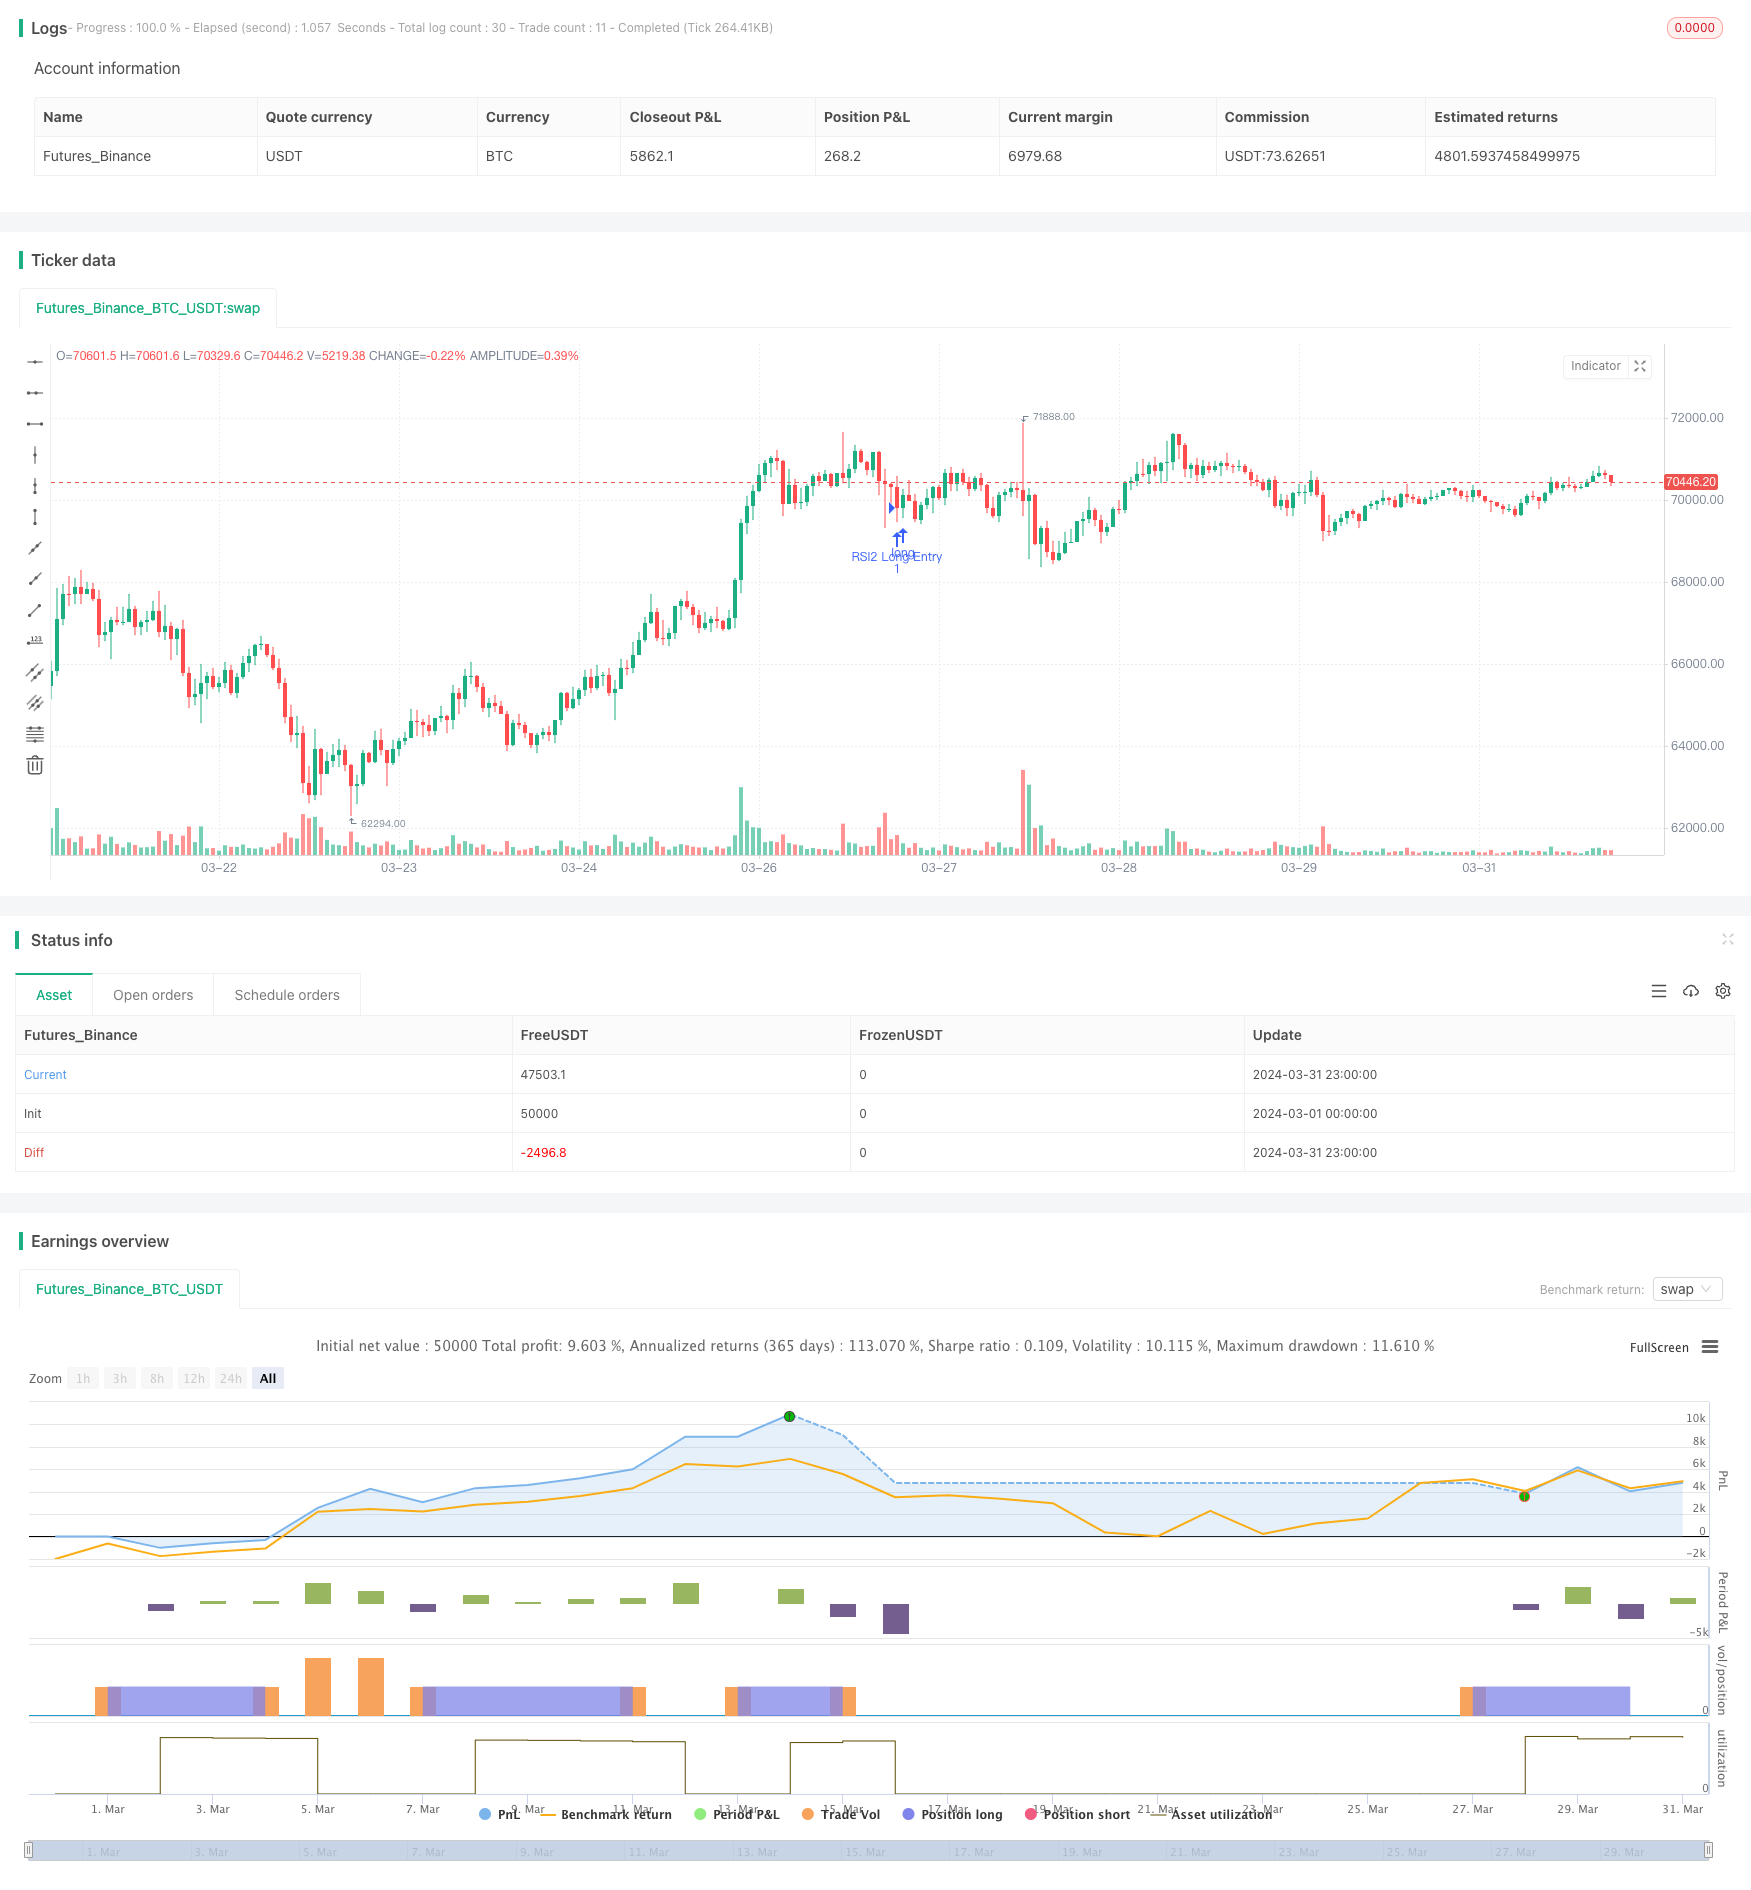
该策略基于相对强弱指数(RSI)指标的超卖信号,在日内低点买入,然后设置固定百分比的止盈和止损,回测策略在触及止盈和止损时的概率。主要思路是利用RSI指标超卖时的反转机会,在日内低点介入,博取反转带来的短期收益。同时,使用移动平均线过滤趋势,只在价格高于均线时入场做多。
|
|
|
|
#### 策略原理
|
|
1. 计算2周期的RSI指标和200周期简单移动平均线
|
|
2. 当收盘价高于均线且RSI小于超卖阈值(默认10)时,在下一个交易日开盘买入
|
|
3. 记录买入当日的最低价作为进场价
|
|
4. 基于进场价计算6%的止盈价和3%的止损价
|
|
5. 下个交易日,若触及止盈价则平仓止盈,若触及止损价则平仓止损
|
|
6. 统计止盈和止损的次数,计算策略在设定周期内的胜率
|
|
|
|
#### 优势分析
|
|
1. 在日内低点买入,博取当日RSI指标超卖后的反转收益
|
|
2. 固定百分比止盈和止损,控制单次交易风险
|
|
3. 使用长周期均线过滤,减少逆势交易情况
|
|
4. 简单易用,参数设置灵活,适合短线交易者
|
|
|
|
#### 风险分析
|
|
1. RSI超卖不能保证必然反转,市场在极端情况下会持续下跌
|
|
2. 固定百分比止盈止损可能无法覆盖交易成本
|
|
3. 入场点基于日内最低价,实际操作很难精准买在最低点
|
|
4. 缺乏趋势判断,单纯依靠超买超卖信号,回报比可能不高
|
|
|
|
#### 优化方向
|
|
1. 使用自适应止盈止损,根据价格波动率等指标动态调整
|
|
2. 加入趋势确认指标,如MACD,DMI等,避免逆势交易
|
|
3. 优化入场点,如使用可变距离海龟交易法则
|
|
4. 增加仓位管理,提高资金利用率和回报率
|
|
5. 结合其他短周期指标,提高信号确认度,如布林带,KDJ等
|
|
|
|
#### 总结
|
|
RSI2策略尝试捕捉RSI指标超卖后的日内反转机会,通过设置固定百分比止盈止损来控制风险,同时使用长周期均线来过滤逆势信号。该策略思路简单,适合短线投机交易者。但其也存在一定局限性,如缺乏趋势判断,难以精准买在最低点,固定止盈止损也限制了策略收益空间。未来可以从动态止盈止损,结合趋势指标,优化入场点,强化仓位管理等方面来改进该策略,提升系统性和鲁棒性,更好地适应多变的市场环境。
|
|
|
|
||
|
|
|
|
#### Overview
|
|
This strategy is based on the oversold signal of the Relative Strength Index (RSI) indicator, buying at the intraday low and then setting a fixed percentage of take-profit and stop-loss to backtest the probability of the strategy hitting the take-profit and stop-loss. The main idea is to take advantage of the reversal opportunity when the RSI indicator is oversold, enter at the intraday low, and seek short-term profits brought by the reversal. At the same time, it uses a moving average to filter the trend and only goes long when the price is above the moving average.
|
|
|
|
#### Strategy Principle
|
|
1. Calculate the 2-period RSI indicator and the 200-period simple moving average
|
|
2. When the closing price is higher than the moving average and the RSI is lower than the oversold threshold (default 10), buy at the opening of the next trading day
|
|
3. Record the lowest price of the day of buying as the entry price
|
|
4. Calculate 6% take-profit price and 3% stop-loss price based on the entry price
|
|
5. On the next trading day, if the take-profit price is hit, close the position for profit; if the stop-loss price is hit, close the position for loss
|
|
6. Count the number of take-profits and stop-losses, and calculate the win rate of the strategy within the set period
|
|
|
|
#### Advantage Analysis
|
|
1. Buy at intraday low to capture the reversal gains after the RSI indicator oversold
|
|
2. Fixed percentage take-profit and stop-loss to control single transaction risk
|
|
3. Use long-cycle moving average to filter and reduce counter-trend trading
|
|
4. Simple and easy to use, flexible parameter settings, suitable for short-term traders
|
|
|
|
#### Risk Analysis
|
|
1. RSI oversold does not guarantee a necessary reversal, the market may continue to fall under extreme conditions
|
|
2. Fixed percentage take-profit and stop-loss may not cover transaction costs
|
|
3. The entry point is based on the intraday lowest price, which is difficult to buy precisely at the lowest point in actual operation
|
|
4. Lack of trend judgment, simply relying on overbought and oversold signals, the return ratio may not be high
|
|
|
|
#### Optimization Direction
|
|
1. Use adaptive take-profit and stop-loss, dynamically adjust according to indicators such as price volatility
|
|
2. Add trend confirmation indicators, such as MACD, DMI, etc., to avoid counter-trend trading
|
|
3. Optimize entry points, such as using variable distance turtle trading rules
|
|
4. Increase position management to improve capital utilization and return rate
|
|
5. Combine with other short-cycle indicators to improve signal confirmation, such as Bollinger Bands, KDJ, etc.
|
|
|
|
#### Summary
|
|
The RSI2 strategy attempts to capture intraday reversal opportunities after the RSI indicator is oversold, and controls risk by setting a fixed percentage of take-profit and stop-loss, while using a long-period moving average to filter counter-trend signals. The strategy is simple and suitable for short-term speculative traders. However, it also has certain limitations, such as lack of trend judgment, difficulty in accurately buying at the lowest point, and fixed take-profit and stop-loss limits the profit potential. In the future, this strategy can be improved from aspects such as dynamic take-profit and stop-loss, combining trend indicators, optimizing entry points, and strengthening position management to enhance the systematicness and robustness, and better adapt to the changing market environment.
|
|
[/trans]
|
|
|
|
> Strategy Arguments
|
|
|
|
|
|
|
|
|Argument|Default|Description|
|
|
|----|----|----|
|
|
|v_input_int_1|2|(?Indicators)RSI Length|
|
|
|v_input_float_1|10|RSI Oversold|
|
|
|v_input_float_2|90|RSI OverBrought|
|
|
|v_input_float_3|3|Max Loss Percent|
|
|
|v_input_float_4|6|Target Percent|
|
|
|
|
|
|
> Source (PineScript)
|
|
|
|
``` pinescript
|
|
/*backtest
|
|
start: 2024-03-01 00:00:00
|
|
end: 2024-03-31 23:59:59
|
|
period: 1h
|
|
basePeriod: 15m
|
|
exchanges: [{"eid":"Futures_Binance","currency":"BTC_USDT"}]
|
|
*/
|
|
|
|
// This Pine Script™ code is subject to the terms of the Mozilla Public License 2.0 at https://mozilla.org/MPL/2.0/
|
|
// © rajk1987
|
|
|
|
//@version=5
|
|
strategy("RSI2 strategy Raj", overlay=true, margin_long=100, margin_short=100)
|
|
|
|
rsi_len = input.int( 2, title = "RSI Length", group = "Indicators")
|
|
rsi_os = input.float(10, title = "RSI Oversold", group = "Indicators")
|
|
rsi_ob = input.float(90, title = "RSI OverBrought", group = "Indicators")
|
|
max_los = input.float(3,title = "Max Loss Percent", group = "Indicators")
|
|
tar_per = input.float(6,title = "Target Percent",group = "Indicators")
|
|
|
|
//Get the rsi value of the stock
|
|
rsi = ta.rsi(close, rsi_len)
|
|
sma = ta.sma(close,200)
|
|
var ent_dat = 0
|
|
var tar = 0.0
|
|
var los = 0.0
|
|
var bp = 0.0
|
|
|
|
if ((close > sma) and (rsi < rsi_os))
|
|
strategy.entry("RSI2 Long Entry", strategy.long,1)
|
|
ent_dat := time(timeframe = timeframe.period)
|
|
|
|
if(ent_dat == time(timeframe = timeframe.period))
|
|
bp := low //high/2 + low/2
|
|
tar := bp * (1 + (tar_per/100))
|
|
los := bp * (1 - (max_los/100))
|
|
|
|
if (time(timeframe = timeframe.period) > ent_dat)
|
|
strategy.exit("RSI2 Exit", "RSI2 Long Entry",qty = 1, limit = tar, stop = los, comment_profit = "P", comment_loss = "L")
|
|
|
|
//plot(rsi,"RSI")
|
|
//plot(bp,"BP")
|
|
//plot(tar,"TAR")
|
|
//plot(los,"LOS")
|
|
|
|
|
|
```
|
|
|
|
> Detail
|
|
|
|
https://www.fmz.com/strategy/449811
|
|
|
|
> Last Modified
|
|
|
|
2024-04-29 14:02:55
|