
8.8 KiB
Name
Post-Open-Breakout-Trading-Strategy-with-Dynamic-ATR-Based-Position-Management-基于ATR动态管理的开市突破交易策略
Author
ChaoZhang
Strategy Description
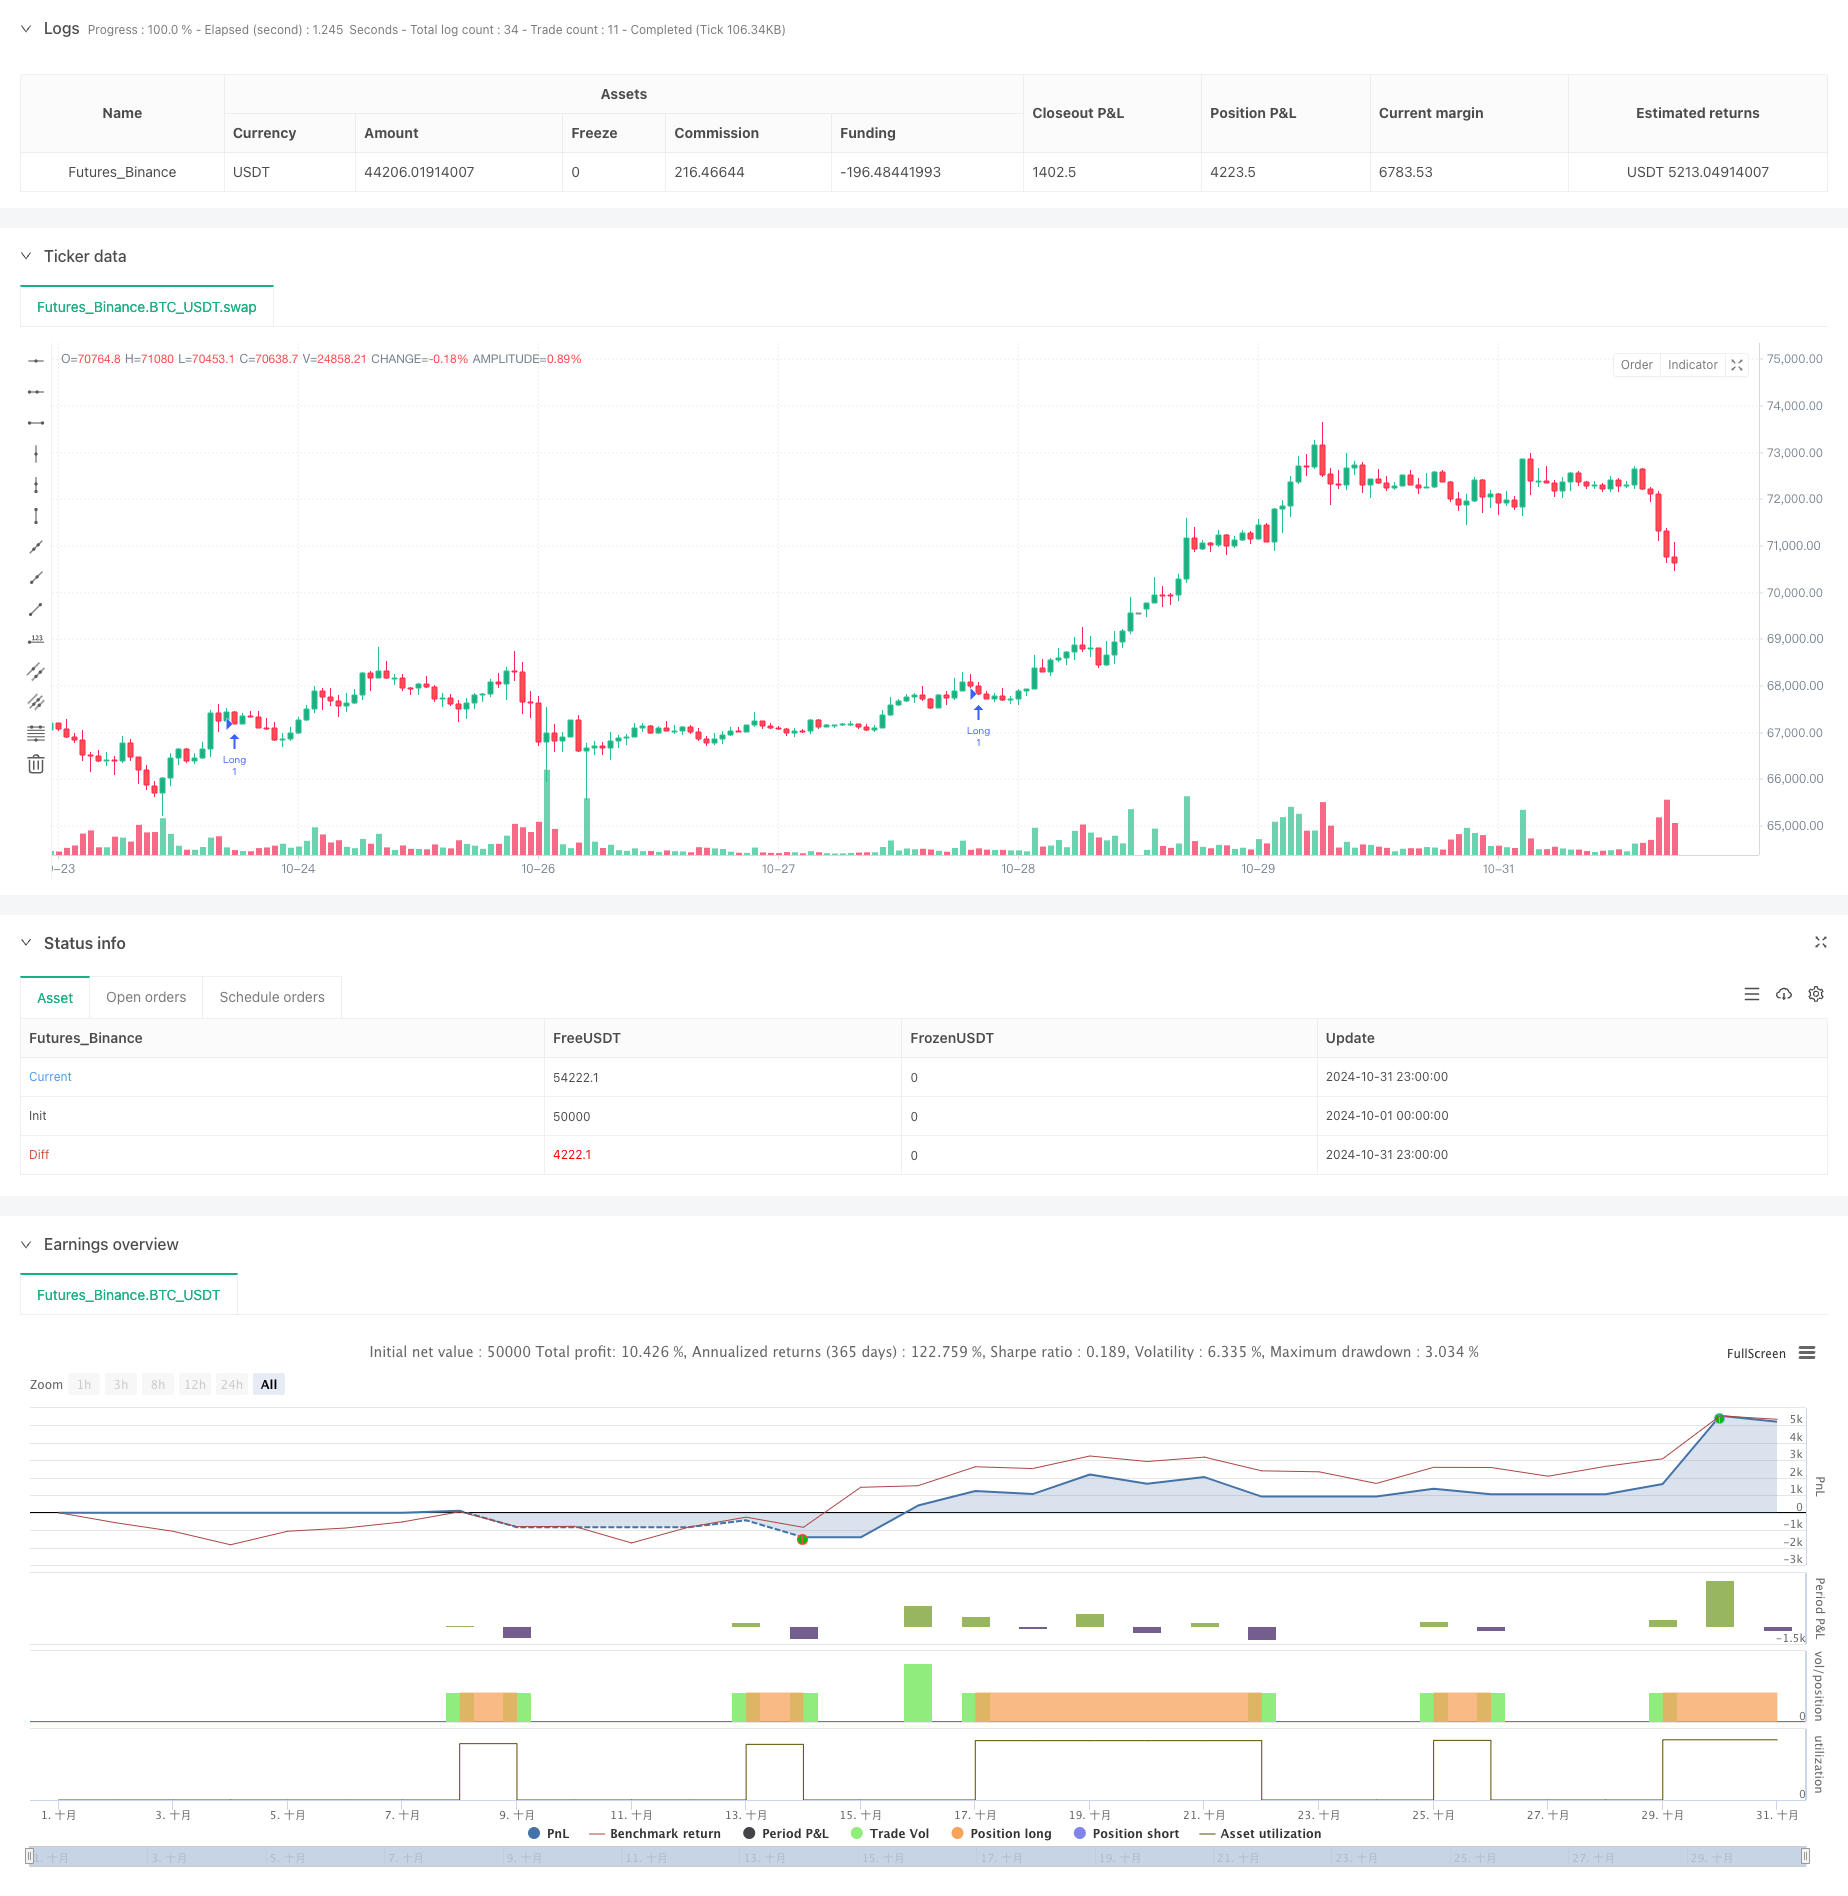
[trans]
概述
该策略是一个基于多重技术指标的市场开盘交易系统,主要针对德国和美国市场开盘时段。策略通过布林带识别盘整阶段,结合短期和长期指数移动平均线确认趋势方向,利用相对强弱指标和趋势方向指标过滤交易信号,最终采用真实波幅指标动态管理仓位。
策略原理
策略采用14周期布林带(标准差1.5倍)识别低波动阶段,当价格接近布林带中轨时视为盘整。同时使用10周期和200周期指数移动平均线确认多头趋势,要求价格位于两条均线之上。使用7周期RSI确保市场非超卖(>30),7周期ADX确认趋势强度(>10)。策略还会分析最近20根K线的高点寻找阻力位,要求至少有两次触及。突破该阻力位且满足其他条件时入场,使用2倍ATR设置止损,4倍ATR设置止盈。
策略优势
- 多重技术指标交叉验证,有效降低虚假信号
- 基于ATR的动态止损止盈,适应市场波动
- 专注于开盘时段高波动机会
- 通过盘整-突破模式捕捉强势趋势
- 完善的风险控制机制
策略风险
- 多重指标可能导致错过部分交易机会
- 开盘时段波动剧烈可能触发止损
- 市场快速反转可能造成较大损失 建议采用合理仓位控制,严格执行止损策略,避免过度交易。
策略优化方向
- 可根据不同市场特点调整指标参数
- 考虑添加成交量指标验证突破有效性
- 引入更多技术指标提高信号可靠性
- 优化入场时机选择,减少滑点影响
- 完善止盈止损机制,提高盈亏比
总结
该策略通过多维度技术分析方法捕捉开盘时段的交易机会,运用动态止损止盈管理风险。策略逻辑清晰,风控完善,具有良好的实用性。通过持续优化和调整,有望进一步提升策略表现。
||
Overview
This strategy is a market opening trading system based on multiple technical indicators, primarily targeting German and US market opening sessions. It identifies consolidation phases using Bollinger Bands, confirms trend direction with short and long-term exponential moving averages, filters trading signals using RSI and ADX, and manages positions dynamically using ATR.
Strategy Principles
The strategy uses 14-period Bollinger Bands (1.5 standard deviations) to identify low volatility phases, considering consolidation when price is near the middle band. It employs 10 and 200-period EMAs to confirm bullish trends, requiring price above both averages. A 7-period RSI ensures non-oversold conditions (>30), while 7-period ADX confirms trend strength (>10). The strategy analyzes highs of the last 20 candles for resistance levels, requiring at least two touches. Entry occurs on resistance breakout with other conditions met, using 2x ATR for stop-loss and 4x ATR for take-profit.
Strategy Advantages
- Multiple technical indicators cross-validation reduces false signals
- ATR-based dynamic stop-loss and take-profit adapts to market volatility
- Focuses on high-volatility opening sessions
- Captures strong trends through consolidation-breakout patterns
- Comprehensive risk control mechanisms
Strategy Risks
- Multiple indicators might miss some trading opportunities
- Volatile opening sessions may trigger stop-losses
- Rapid market reversals could cause significant losses Recommended to implement proper position sizing, strict stop-loss execution, and avoid overtrading.
Optimization Directions
- Adjust indicator parameters for different markets
- Consider adding volume indicators to verify breakout validity
- Incorporate additional technical indicators for signal reliability
- Optimize entry timing to reduce slippage impact
- Enhance profit/loss management for better risk-reward ratios
Summary
This strategy captures trading opportunities during market opening sessions through multi-dimensional technical analysis, employing dynamic stop-loss and take-profit for risk management. With clear logic and robust risk control, it demonstrates good practicality. Continuous optimization and adjustment can further enhance strategy performance. [/trans]
Source (PineScript)
/*backtest
start: 2024-10-01 00:00:00
end: 2024-10-31 23:59:59
period: 1h
basePeriod: 1h
exchanges: [{"eid":"Futures_Binance","currency":"BTC_USDT"}]
*/

//@version=5
strategy("Post-Open Long Strategy with ATR-based Stop Loss and Take Profit (Separate Alerts)", overlay=true)

// Parametri per Bande di Bollinger ed EMA
lengthBB = 14
mult = 1.5  // Bande di Bollinger più strette per timeframe inferiori
emaLength = 10  // EMA più breve per una rilevazione di trend più rapida
emaLongLength = 200  // EMA a lungo termine per il filtraggio del trend

// Parametri per RSI
lengthRSI = 7
rsiThreshold = 30

// Parametri per ADX
adxLength = 7
adxSmoothing = 7
adxThreshold = 10

// Filtro temporale - Solo durante l'apertura dei mercati tedesco e USA
daxOpen = (hour >= 8 and hour < 12)
usOpen = (hour == 15 and minute >= 30) or (hour >= 16 and hour < 19)

// Calcolo delle Bande di Bollinger
smaBB = ta.sma(close, lengthBB)
basis = smaBB
dev = mult * ta.stdev(close, lengthBB)
upperBand = basis + dev
lowerBand = basis - dev

// Calcolo delle EMA (breve e lungo termine)
ema = ta.ema(close, emaLength)  // EMA più breve
emaLong = ta.ema(close, emaLongLength)  // EMA a lungo termine per il filtraggio del trend

// Calcolo RSI
rsi = ta.rsi(close, lengthRSI)

// Calcolo ADX
[plusDI, minusDI, adx] = ta.dmi(adxLength, adxSmoothing)

// Calcolo ATR per Stop Loss e Take Profit dinamici
atrLength = 14
atrStopLossMultiplier = 2.0  // Moltiplicatore per Stop Loss
atrTakeProfitMultiplier = 4.0  // Moltiplicatore per Take Profit modificato a 4.0
atrValue = ta.atr(atrLength)  // Valore ATR calcolato qui

// Condizione di lateralizzazione - Prezzo vicino alla SMA delle Bande di Bollinger
lateralization = math.abs(close - smaBB) < (0.01 * close) and (daxOpen or usOpen)

// Identificazione della resistenza e del breakout
var float resistanceLevel = na
resistanceTouches = 0

for i = 1 to 20
    if high[i] > high[i+1] and high[i] > high[i-1]
        resistanceLevel := high[i]
        resistanceTouches := resistanceTouches + 1

// Condizione di Breakout: Il prezzo attuale supera la resistenza identificata
breakoutCondition = close > resistanceLevel and resistanceTouches >= 2

// Filtro di mercato rialzista a lungo termine - Entrare solo se il prezzo è sopra la EMA a 200 periodi
bullMarket = close > emaLong

// Filtro di trend a breve termine
trendFilter = ta.ema(close, emaLength)  // Filtro di trend a breve termine
trendDown = close < trendFilter  // Condizione di downtrend basata sul trend a breve termine

// Evitare l'entrata durante un pullback - Verifica se le due candele precedenti sono rosse
firstRedCandle = close[1] < open[1]  // La prima candela precedente è rossa
secondRedCandle = close[2] < open[2]  // La seconda candela precedente è rossa
avoidPullbackCondition = not (firstRedCandle and secondRedCandle)  // Entrare solo se non entrambe sono rosse

// Condizione Panic Candle - La candela deve chiudere negativa
panicCandle = close < open and (daxOpen or usOpen)

// Condizione di Entrata Long
longCondition = breakoutCondition and lateralization and close > ema and rsi > rsiThreshold and adx > adxThreshold and not trendDown and avoidPullbackCondition and bullMarket and panicCandle

// Stop Loss e Take Profit dinamici basati su ATR
atrStopLoss = close - (atrValue * atrStopLossMultiplier)  // Stop Loss dinamico usando ATR con moltiplicatore 2.0
atrTakeProfit = close + (atrValue * atrTakeProfitMultiplier)  // Take Profit dinamico usando ATR con moltiplicatore 4.0

// Entrata Long: Ordine eseguito alla chiusura della candela
if (longCondition and strategy.opentrades == 0 and barstate.isconfirmed)
    strategy.entry("Long", strategy.long)

// Disegna linee per Stop Loss e Take Profit
// line.new(x1=bar_index, y1=atrStopLoss, x2=bar_index + 1, y2=atrStopLoss, color=color.red, width=2, style=line.style_solid)  // Linea di Stop Loss (rossa)
// line.new(x1=bar_index, y1=atrTakeProfit, x2=bar_index + 1, y2=atrTakeProfit, color=color.green, width=2, style=line.style_solid)  // Linea di Take Profit (verde)

// Uscita: Stop Loss o Take Profit raggiunti
if (strategy.opentrades > 0)
    strategy.exit("Exit Long", "Long", stop=atrStopLoss, limit=atrTakeProfit)

// Alert: Differenziati per Entrata e Uscita utilizzando strategy.order.action
alert_message = "Azione: {{strategy.order.action}}, Prezzo: {{close}}, Dimensione Posizione: {{strategy.position_size}}"
Detail
https://www.fmz.com/strategy/471686
Last Modified
2024-11-12 14:26:23