
266 lines
11 KiB
Markdown
266 lines
11 KiB
Markdown
|
|
> Name
|
|
|
|
MACD均线交叉趋势追踪止损策略MACD-Moving-Average-Crossover-Trend-Following-Strategy-with-Trailing-Stop-Loss
|
|
|
|
> Author
|
|
|
|
ChaoZhang
|
|
|
|
> Strategy Description
|
|
|
|
|
|
|
|
[trans]
|
|
|
|
## 概述
|
|
|
|
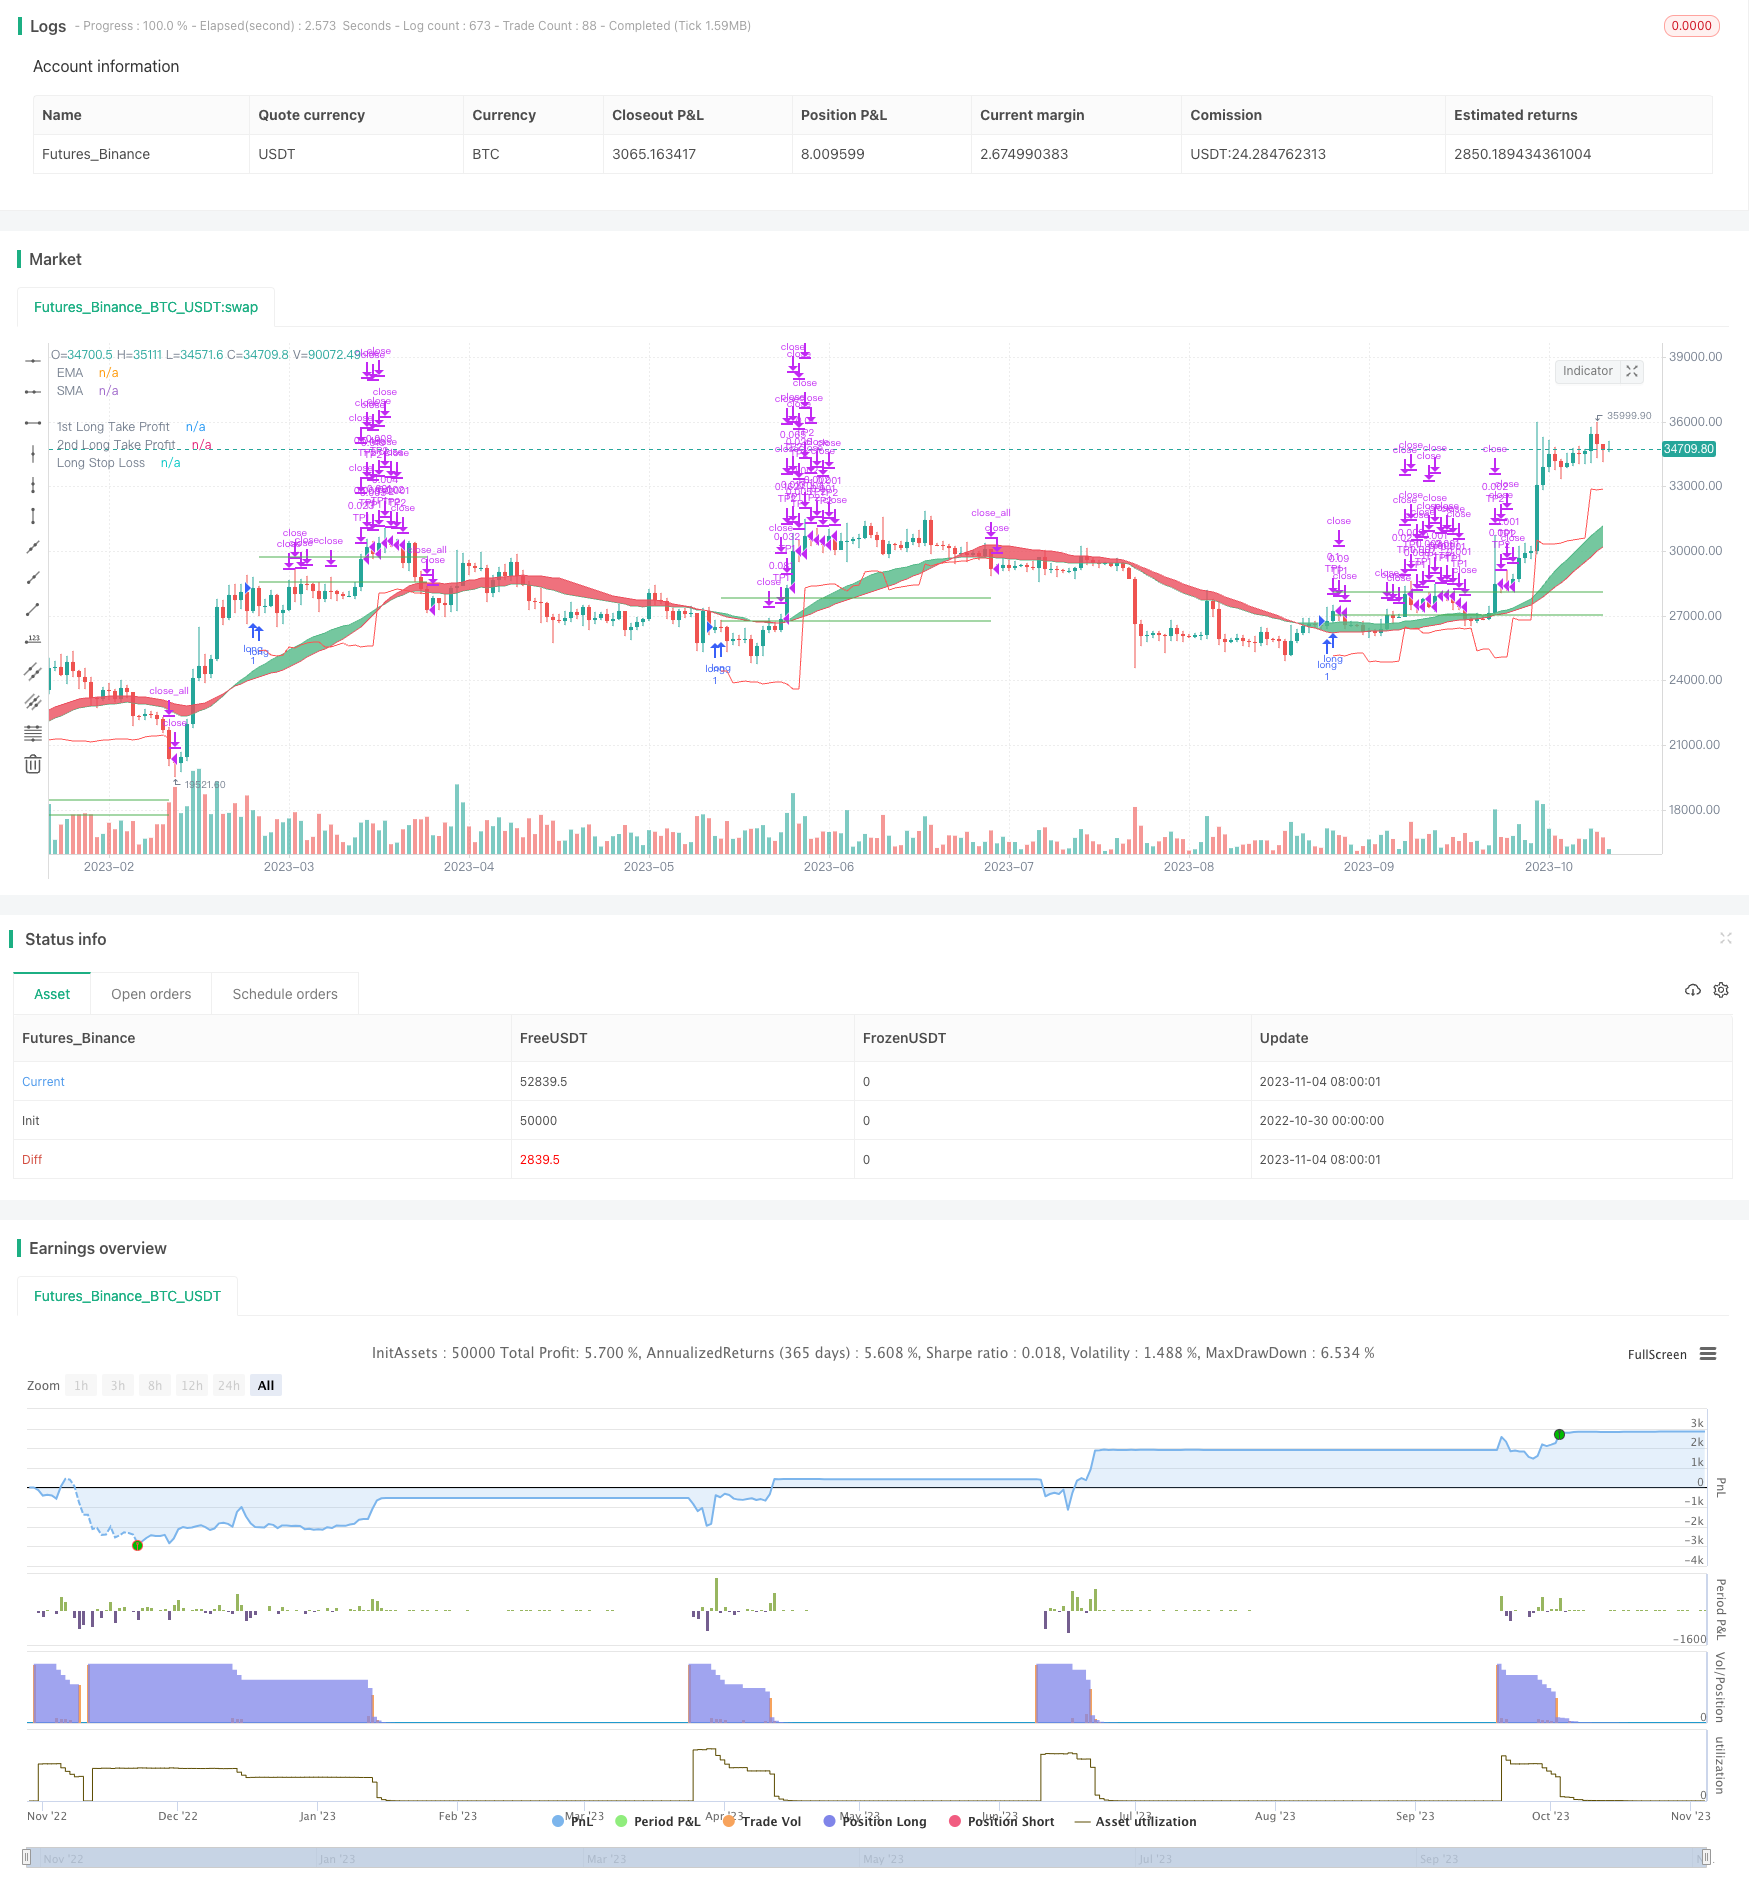
该策略运用MACD指标判断趋势方向,结合EMA均线和SMA均线交叉作为辅助判断。入场信号为MACD直线上穿信号线且趋势向上,止损为价格跌破由ATR计算的浮动止损线。策略还设置了分批出场,首先平掉一部分头寸获利了结,其次在价格达到较大涨幅时再平仓一部分确保大额利润,最后将部分头寸追踪持有直到止损。
|
|
|
|
## 原理
|
|
|
|
### 入场信号
|
|
|
|
当快线EMA上穿慢线EMA时,表示短期价格变化趋势好于长期趋势,判断为买入信号。同时,快速SMA上穿慢速SMA也表明短期价格上涨势头好于长期。因此结合MACD直线上穿信号线和趋势向上的EMA&SMA交叉信号,可以确定较强的入场时机。
|
|
|
|
### 止损方式
|
|
|
|
采用ATR来计算止损位。ATR可以有效反映价格的波动范围。当价格跌破该波动范围则退出止损。ATR的周期可以调节,周期调小可以使止损更精确但也更容易被突破,周期调大止损位会更宽但不易被突破。同时,止损位随着价格上涨而向上漂移,实现趋势跟踪。
|
|
|
|
### 出场方式
|
|
|
|
分批出场,首先在小幅上涨后就平掉一部分头寸回笼资金。然后在价格大幅上涨时再平一部分头寸获利。最后将部分头寸追踪持有直到止损位触发止损。这样可以锁定部分利润且持有一定时间获利。
|
|
|
|
## 优势
|
|
|
|
- 利用MACD判断趋势方向,再辅以EMA和SMA的交叉信号,可以较准确判断入场时机
|
|
- ATR计算的止损位既可实现止损又可跟踪趋势
|
|
- 分批出场,可以回笼资金、锁定利润且持有一段时间
|
|
|
|
## 风险及对策
|
|
|
|
- MACD和趋势指标发出错误信号的风险。可以适当调整参数,或增加其他指标进行辅助判断。
|
|
- ATR止损被突破的风险。可以适当扩大ATR周期或增加止损系数。
|
|
- 部分头寸追踪时被套牢的风险。可以缩小追踪头寸比例,及时止损。
|
|
|
|
## 优化方向
|
|
|
|
-优化MACD参数,使其对趋势的判断更准确
|
|
|
|
- 优化ATR周期参数,使止损更合适
|
|
|
|
- 优化出场比例和头寸控制,减少被套风险
|
|
|
|
- 增加移动止盈或考虑波动率指标优化止损
|
|
|
|
## 总结
|
|
|
|
该策略综合运用MACD、EMA/SMA等多种指标判断趋势方向,以求取准确的入场时机。同时采用浮动的ATR止损来锁定利润且跟踪趋势达到更好的效果。出场设置分批平仓,可以回笼资金、确保利润且持有一段时间。总体来说,该策略稳定性较好,可以获得不错的效果。但仍需对指标参数及出场方式进行优化,以求取更佳回报。
|
|
|
|
||
|
|
|
|
|
|
## Overview
|
|
|
|
This strategy uses MACD to determine the trend direction, combined with EMA and SMA crossover as confirmation. The entry signal is when MACD histogram crosses above signal line and the trend is up. The stop loss is set at the price level below the floating ATR trailing stop. The strategy also exits partially to take profit, exits more on larger price surge, and holds some position with trailing stop until stop loss is hit.
|
|
|
|
## Logic
|
|
|
|
### Entry Signal
|
|
|
|
When faster EMA crosses above slower EMA, it indicates the short term trend is better than long term trend, signaling a buy. Meanwhile, faster SMA crossing above slower SMA also suggests stronger upside momentum in short term. So the combination of MACD line crossing above signal and uptrend based on EMA&SMA crossover helps identify stronger entry signals.
|
|
|
|
### Stop Loss
|
|
|
|
ATR is used to calculate the stop loss level. ATR can effectively measure the price fluctuation range. When price breaks below this range, the stop loss is triggered. The ATR period can be adjusted - smaller period allows more precise stop but easier to get stopped out, while larger period gives wider stop but more robust. The stop level also trails the price upside, achieving trend following effect.
|
|
|
|
### Exit Signals
|
|
|
|
Exits partially on small price surge to take profit. Exits more on large price spike to lock in profit. Keeps some position with trailing stop until stop loss is hit. This helps lock in profit, while still be able to hold position for some period.
|
|
|
|
## Advantages
|
|
|
|
- MACD judging trend combined with EMA/SMA crossover confirms entry timing
|
|
- ATR trailing stop allows effective stop loss while following trend
|
|
- Partial exits help take profit, lock in profit and hold for duration
|
|
|
|
## Risks & Solutions
|
|
|
|
- Risk of wrong signal from MACD and trend indicators. Fine tune parameters or add other indicators.
|
|
|
|
- Risk of ATR stop loss being hit. Can increase ATR period or stop loss multiplier.
|
|
|
|
- Risk of trailing position being trapped. Reduce trailing position size and cut loss in time.
|
|
|
|
## Enhancement Opportunities
|
|
|
|
- Optimize MACD parameters for better trend judgment
|
|
|
|
- Optimize ATR period for better stop loss level
|
|
|
|
- Optimize exit ratios and position sizing to reduce trapped risk
|
|
|
|
- Consider adding moving take profit or volatility index to improve stop loss
|
|
|
|
## Summary
|
|
|
|
The strategy combines MACD, EMA/SMA and other indicators to determine trend and entry timing accurately. The floating ATR stop loss helps lock in profit while following the trend. Exits are staggered to take profit, ensure gain and hold position for duration. Overall it is stable with decent result. But parameters and exits can be further optimized for better return.
|
|
|
|
[/trans]
|
|
|
|
> Strategy Arguments
|
|
|
|
|
|
|
|
|Argument|Default|Description|
|
|
|----|----|----|
|
|
|v_input_1|34|Period|
|
|
|v_input_2|3|Fast Length|
|
|
|v_input_3|5|Slow Length|
|
|
|v_input_4_close|0|Source: close|high|low|open|hl2|hlc3|hlcc4|ohlc4|
|
|
|v_input_5|2|Signal Smoothing|
|
|
|v_input_6|false|Simple MA(Oscillator)|
|
|
|v_input_7|true|Simple MA(Signal Line)|
|
|
|v_input_8|true|Long Take Profit 1 %|
|
|
|v_input_9|10|Long Take Profit 1 Qty|
|
|
|v_input_10|5|Long Take Profit 2%|
|
|
|v_input_11|50|Long Take Profit 2 Qty|
|
|
|v_input_12|2.2|SL Mutiplier|
|
|
|v_input_13|17|ATR period|
|
|
|v_input_14|2018|Backtest Start Year|
|
|
|v_input_15|true|Backtest Start Month|
|
|
|v_input_16|true|Backtest Start Day|
|
|
|v_input_17|2020|Backtest Stop Year|
|
|
|v_input_18|12|Backtest Stop Month|
|
|
|v_input_19|31|Backtest Stop Day|
|
|
|
|
|
|
> Source (PineScript)
|
|
|
|
``` pinescript
|
|
/*backtest
|
|
start: 2022-10-30 00:00:00
|
|
end: 2023-11-05 00:00:00
|
|
period: 1d
|
|
basePeriod: 1h
|
|
exchanges: [{"eid":"Futures_Binance","currency":"BTC_USDT"}]
|
|
*/
|
|
|
|
// This source code is subject to the terms of the Mozilla Public License 2.0 at https://mozilla.org/MPL/2.0/
|
|
// © Deobald
|
|
|
|
//@version=4
|
|
strategy("MACD Strategy", overlay=true)
|
|
|
|
// FUNCTIONS
|
|
|
|
Ema(src,p) =>
|
|
ema = 0.
|
|
sf = 2/(p+1)
|
|
ema := nz(ema[1] + sf*(src - ema[1]),src)
|
|
|
|
Sma(src,p) => a = cum(src), (a - a[max(p,0)])/max(p,0)
|
|
|
|
Atr(p) =>
|
|
atr = 0.
|
|
Tr = max(high - low, max(abs(high - close[1]), abs(low - close[1])))
|
|
atr := nz(atr[1] + (Tr - atr[1])/p,Tr)
|
|
|
|
/// TREND
|
|
ribbon_period = input(34, "Period", step=1)
|
|
|
|
leadLine1 = ema(close, ribbon_period)
|
|
leadLine2 = sma(close, ribbon_period)
|
|
|
|
p3 = plot(leadLine1, color= #53b987, title="EMA", transp = 50, linewidth = 1)
|
|
p4 = plot(leadLine2, color= #eb4d5c, title="SMA", transp = 50, linewidth = 1)
|
|
fill(p3, p4, transp = 60, color = leadLine1 > leadLine2 ? #53b987 : #eb4d5c)
|
|
|
|
|
|
// MACD
|
|
fast_length = input(title="Fast Length", type=input.integer, defval=3)
|
|
slow_length = input(title="Slow Length", type=input.integer, defval=5)
|
|
src = input(title="Source", type=input.source, defval=close)
|
|
signal_length = input(title="Signal Smoothing", type=input.integer, minval = 1, maxval = 50, defval = 2)
|
|
sma_source = input(title="Simple MA(Oscillator)", type=input.bool, defval=false)
|
|
sma_signal = input(title="Simple MA(Signal Line)", type=input.bool, defval=true)
|
|
|
|
// Plot colors
|
|
col_grow_above = #26A69A
|
|
col_grow_below = #FFCDD2
|
|
col_fall_above = #B2DFDB
|
|
col_fall_below = #EF5350
|
|
col_macd = #0094ff
|
|
col_signal = #ff6a00
|
|
|
|
// Calculating
|
|
fast_ma = sma_source ? Sma(src, fast_length) : Ema(src, fast_length)
|
|
slow_ma = sma_source ? Sma(src, slow_length) : Ema(src, slow_length)
|
|
macd = fast_ma - slow_ma
|
|
signal = sma_signal ? Sma(macd, signal_length) : Ema(macd, signal_length)
|
|
hist = macd - signal
|
|
|
|
//plot(hist, title="Histogram", style=plot.style_columns, color=(hist>=0 ? (hist[1] < hist ? col_grow_above : col_fall_above) : (hist[1] < hist ? col_grow_below : col_fall_below) ), transp=0 )
|
|
// plot(macd, title="MACD", color=col_macd, transp=0)
|
|
// plot(signal, title="Signal", color=col_signal, transp=0)
|
|
|
|
|
|
|
|
// TAKE PROFIT AND STOP LOSS
|
|
long_tp1_inp = input(1, title='Long Take Profit 1 %', step=0.1)/100
|
|
long_tp1_qty = input(10, title="Long Take Profit 1 Qty", step=1)
|
|
|
|
long_tp2_inp = input(5, title='Long Take Profit 2%', step=0.1)/100
|
|
long_tp2_qty = input(50, title="Long Take Profit 2 Qty", step=1)
|
|
|
|
long_take_level_1 = strategy.position_avg_price * (1 + long_tp1_inp)
|
|
long_take_level_2 = strategy.position_avg_price * (1 + long_tp2_inp)
|
|
|
|
|
|
|
|
|
|
// Stop Loss
|
|
multiplier = input(2.2, "SL Mutiplier", minval=1, step=0.1)
|
|
ATR_period=input(17,"ATR period", minval=1, step=1)
|
|
|
|
// Strategy
|
|
entry_long=crossover(macd,signal) and leadLine2 < leadLine1
|
|
entry_price_long=valuewhen(entry_long,close,0)
|
|
SL_floating_long = entry_price_long - multiplier*Atr(ATR_period)
|
|
exit_long= close < SL_floating_long
|
|
|
|
///// BACKTEST PERIOD ///////
|
|
testStartYear = input(2018, "Backtest Start Year")
|
|
testStartMonth = input(1, "Backtest Start Month")
|
|
testStartDay = input(1, "Backtest Start Day")
|
|
testPeriodStart = timestamp(testStartYear, testStartMonth, testStartDay, 0, 0)
|
|
|
|
testStopYear = input(2020, "Backtest Stop Year")
|
|
testStopMonth = input(12, "Backtest Stop Month")
|
|
testStopDay = input(31, "Backtest Stop Day")
|
|
testPeriodStop = timestamp(testStopYear, testStopMonth, testStopDay, 0, 0)
|
|
|
|
testPeriod() => true
|
|
|
|
if testPeriod()
|
|
strategy.entry("long", strategy.long, comment="Long", when=entry_long)
|
|
strategy.exit("TP1","long", qty_percent=long_tp1_qty, limit=long_take_level_1)//, trail_points=entry_price_long * long_trailing / syminfo.mintick, trail_offset=entry_price_long * long_trailing / syminfo.mintick)
|
|
strategy.exit("TP2", qty_percent=long_tp2_qty, limit=long_take_level_2) //, trail_points=entry_price_long * long_trailing / syminfo.mintick, trail_offset=entry_price_long * long_trailing / syminfo.mintick)
|
|
strategy.close_all("long", when=exit_long, comment="exit long" )
|
|
|
|
|
|
// LONG POSITION
|
|
plot(strategy.position_size > 0 ? long_take_level_1 : na, style=plot.style_linebr, color=color.green, linewidth=1, title="1st Long Take Profit")
|
|
plot(strategy.position_size > 0 ? long_take_level_2 : na, style=plot.style_linebr, color=color.green, linewidth=1, title="2nd Long Take Profit")
|
|
plot(strategy.position_size > 0 ? SL_floating_long : na, style=plot.style_linebr, color=color.red, linewidth=1, title="Long Stop Loss")
|
|
|
|
```
|
|
|
|
> Detail
|
|
|
|
https://www.fmz.com/strategy/431237
|
|
|
|
> Last Modified
|
|
|
|
2023-11-06 11:56:14
|