
183 lines
9.8 KiB
Markdown
183 lines
9.8 KiB
Markdown
|
|
> Name
|
|
|
|
Bollinger-Bands-Stochastic-Oscillator-Strategy-布林带随机振荡器策略
|
|
|
|
> Author
|
|
|
|
ChaoZhang
|
|
|
|
> Strategy Description
|
|
|
|
|
|
[trans]
|
|
#### 概述
|
|
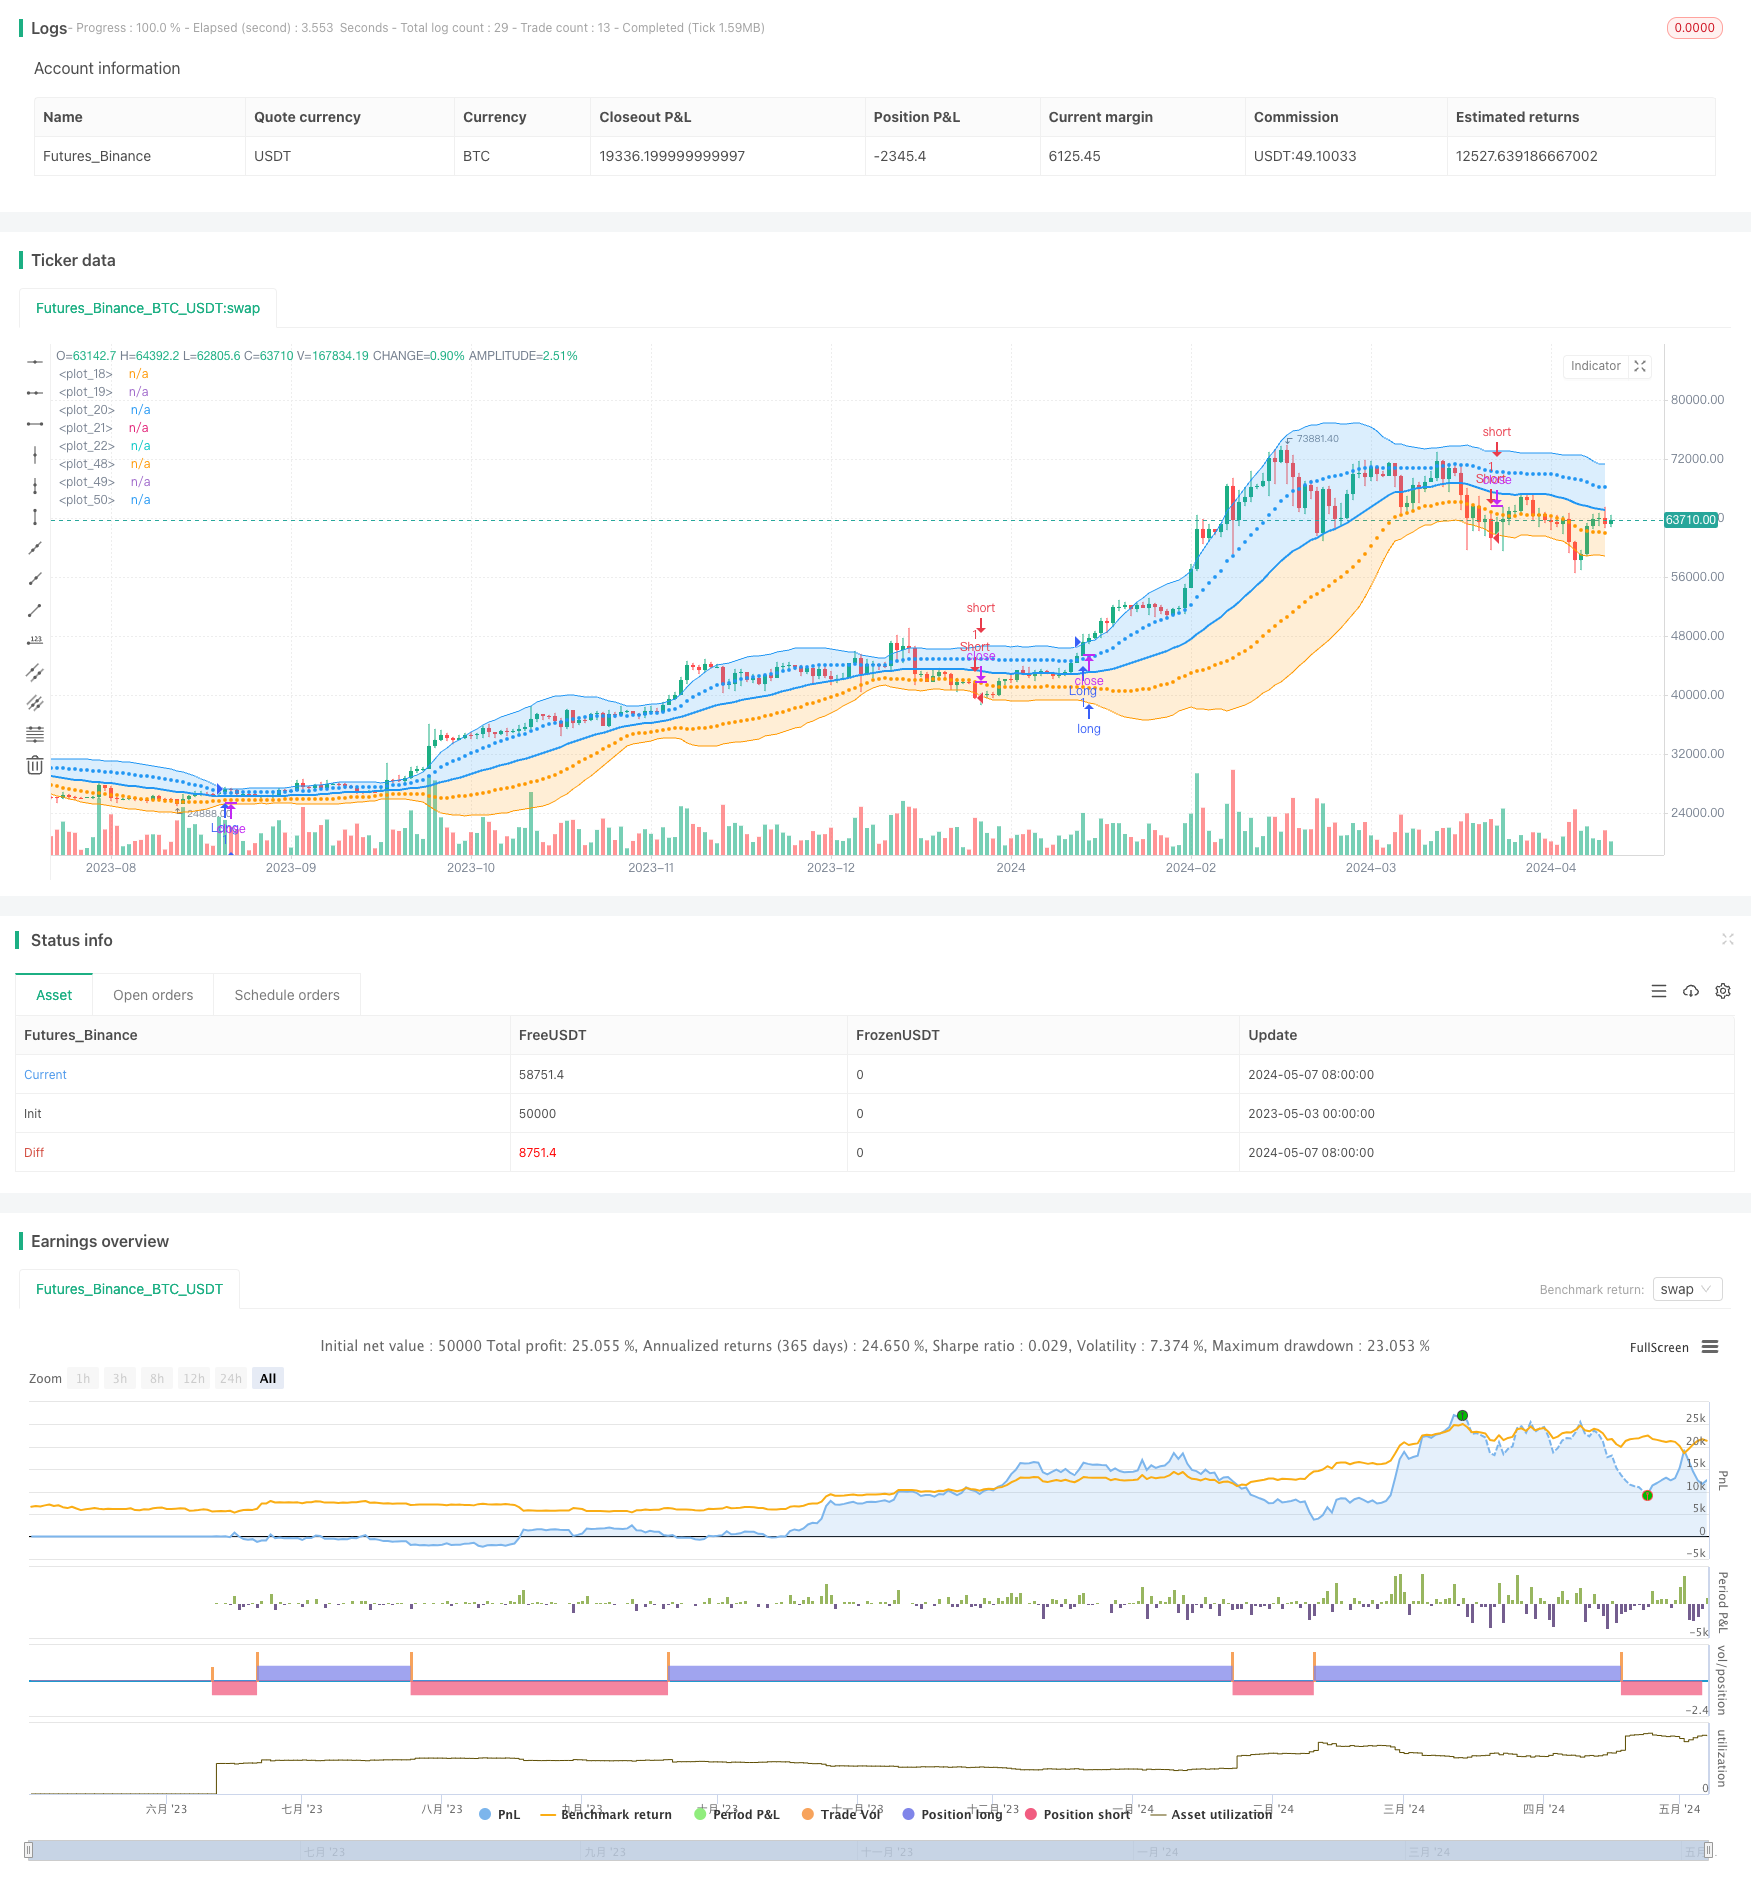
该策略是一个基于布林带和随机振荡器的交易策略。它利用布林带来确定市场的波动范围,并使用随机振荡器来判断市场的超买和超卖状态。当价格突破布林带上轨时,策略进行做多;当价格跌破布林带下轨时,策略进行做空。同时,该策略还使用了随机振荡器来过滤交易信号,以提高策略的准确性和可靠性。
|
|
|
|
#### 策略原理
|
|
该策略的核心是布林带和随机振荡器两个技术指标。布林带由三条线组成:中轨、上轨和下轨。中轨是价格的简单移动平均线,上轨和下轨分别是中轨加上和减去价格标准差的某个倍数。当价格突破上轨时,表明市场可能处于超买状态;当价格跌破下轨时,表明市场可能处于超卖状态。
|
|
|
|
随机振荡器由两条线组成:%K线和%D线。%K线衡量了收盘价在最近一段时间内的最高价和最低价之间的位置,%D线是%K线的移动平均线。当%K线上穿%D线时,表明市场可能处于超买状态;当%K线下穿%D线时,表明市场可能处于超卖状态。
|
|
|
|
该策略结合了这两个指标,当价格突破布林带上轨且随机振荡器%K线上穿%D线时,策略进行做多;当价格跌破布林带下轨且随机振荡器%K线下穿%D线时,策略进行做空。这种组合可以有效地捕捉市场的趋势,同时也能够避免在波动市场中频繁交易。
|
|
|
|
#### 策略优势
|
|
1. 结合了趋势和震荡两种市场状态的指标,能够在不同的市场环境中获得稳定的收益。
|
|
2. 布林带能够动态地调整,适应市场波动率的变化,提高了策略的适应性。
|
|
3. 随机振荡器能够有效地过滤掉一些虚假的突破信号,提高了策略的准确性。
|
|
4. 策略逻辑清晰,易于理解和实现,适合不同水平的交易者使用。
|
|
|
|
#### 策略风险
|
|
1. 在市场趋势不明确或者波动率很大的情况下,该策略可能会出现较多的虚假信号,导致频繁交易和损失。
|
|
2. 该策略依赖于历史数据,对于一些突发事件或者市场异常情况,可能会出现较大的回撤。
|
|
3. 策略参数的选择对策略性能有很大影响,不同的参数可能会导致完全不同的结果。
|
|
|
|
#### 策略优化方向
|
|
1. 可以考虑加入更多的过滤条件,如交易量、其他技术指标等,以进一步提高信号的可靠性。
|
|
2. 可以对布林带和随机振荡器的参数进行优化,找到最适合当前市场的参数组合。
|
|
3. 可以引入风险管理机制,如止损和移动止损,以控制单次交易的风险。
|
|
4. 可以考虑将该策略与其他策略进行组合,形成一个更加稳健的策略组合。
|
|
|
|
#### 总结
|
|
该策略是一个简单而有效的交易策略,通过结合布林带和随机振荡器两个经典的技术指标,能够在趋势和震荡两种市场状态下获得稳定的收益。尽管该策略也存在一些风险和局限性,但通过适当的优化和改进,可以进一步提高策略的性能和适应性,成为一个值得参考和学习的交易策略。
|
|
|
|
||
|
|
|
|
#### Overview
|
|
This strategy is a trading strategy based on Bollinger Bands and the Stochastic Oscillator. It utilizes Bollinger Bands to determine the market's volatility range and uses the Stochastic Oscillator to judge the overbought and oversold states of the market. When the price breaks above the upper Bollinger Band, the strategy goes long; when the price falls below the lower Bollinger Band, the strategy goes short. At the same time, the strategy also uses the Stochastic Oscillator to filter trading signals to improve the accuracy and reliability of the strategy.
|
|
|
|
#### Strategy Principle
|
|
The core of this strategy is two technical indicators: Bollinger Bands and the Stochastic Oscillator. Bollinger Bands consist of three lines: the middle band, the upper band, and the lower band. The middle band is a simple moving average of the price, while the upper and lower bands are the middle band plus and minus a certain multiple of the price's standard deviation. When the price breaks above the upper band, it indicates that the market may be overbought; when the price falls below the lower band, it indicates that the market may be oversold.
|
|
|
|
The Stochastic Oscillator consists of two lines: the %K line and the %D line. The %K line measures the position of the closing price within the highest and lowest prices over a recent period, and the %D line is a moving average of the %K line. When the %K line crosses above the %D line, it indicates that the market may be overbought; when the %K line crosses below the %D line, it indicates that the market may be oversold.
|
|
|
|
This strategy combines these two indicators. When the price breaks above the upper Bollinger Band and the Stochastic Oscillator %K line crosses above the %D line, the strategy goes long; when the price falls below the lower Bollinger Band and the Stochastic Oscillator %K line crosses below the %D line, the strategy goes short. This combination can effectively capture market trends while avoiding frequent trading in volatile markets.
|
|
|
|
#### Strategy Advantages
|
|
1. It combines indicators of both trending and oscillating market states, enabling it to obtain stable returns in different market environments.
|
|
2. Bollinger Bands can dynamically adjust to adapt to changes in market volatility, improving the strategy's adaptability.
|
|
3. The Stochastic Oscillator can effectively filter out some false breakout signals, improving the accuracy of the strategy.
|
|
4. The strategy logic is clear and easy to understand and implement, making it suitable for traders of different levels.
|
|
|
|
#### Strategy Risks
|
|
1. In situations where the market trend is unclear or volatility is high, the strategy may generate many false signals, leading to frequent trading and losses.
|
|
2. The strategy relies on historical data and may experience significant drawdowns in the face of unexpected events or market anomalies.
|
|
3. The choice of strategy parameters has a significant impact on strategy performance, and different parameters may lead to completely different results.
|
|
|
|
#### Strategy Optimization Directions
|
|
1. Consider adding more filtering conditions, such as trading volume, other technical indicators, etc., to further improve the reliability of signals.
|
|
2. Optimize the parameters of Bollinger Bands and the Stochastic Oscillator to find the parameter combination that best suits the current market.
|
|
3. Introduce risk management mechanisms, such as stop-loss and trailing stop-loss, to control the risk of a single trade.
|
|
4. Consider combining this strategy with other strategies to form a more robust strategy portfolio.
|
|
|
|
#### Summary
|
|
This strategy is a simple yet effective trading strategy that combines two classic technical indicators, Bollinger Bands and the Stochastic Oscillator, to achieve stable returns in both trending and oscillating market states. Although the strategy also has some risks and limitations, through proper optimization and improvement, it can further enhance the strategy's performance and adaptability, becoming a trading strategy worth referencing and learning from.
|
|
[/trans]
|
|
|
|
> Strategy Arguments
|
|
|
|
|
|
|
|
|Argument|Default|Description|
|
|
|----|----|----|
|
|
|v_input_1_close|0|src: close|high|low|open|hl2|hlc3|hlcc4|ohlc4|
|
|
|v_input_int_1|34|length|
|
|
|v_input_float_1|2|mult|
|
|
|v_input_int_2|34|Length|
|
|
|v_input_float_2|2|Multiplier|
|
|
|
|
|
|
> Source (PineScript)
|
|
|
|
``` pinescript
|
|
/*backtest
|
|
start: 2023-05-03 00:00:00
|
|
end: 2024-05-08 00:00:00
|
|
period: 1d
|
|
basePeriod: 1h
|
|
exchanges: [{"eid":"Futures_Binance","currency":"BTC_USDT"}]
|
|
*/
|
|
|
|
//@version=5
|
|
strategy("Unique Bollinger Bands Strategy", overlay=true)
|
|
src = input(close)
|
|
length = input.int(34, minval=1)
|
|
mult = input.float(2.0, minval=0.001, maxval=50)
|
|
|
|
basis = ta.sma(src, length)
|
|
dev = ta.stdev(src, length)
|
|
dev2 = mult * dev
|
|
|
|
upper1 = basis + dev
|
|
lower1 = basis - dev
|
|
upper2 = basis + dev2
|
|
lower2 = basis - dev2
|
|
|
|
colorBasis = src >= basis ? color.blue : color.orange
|
|
|
|
pBasis = plot(basis, linewidth=2, color=colorBasis)
|
|
pUpper1 = plot(upper1, color=color.new(color.blue, 0), style=plot.style_circles)
|
|
pUpper2 = plot(upper2, color=color.new(color.blue, 0))
|
|
pLower1 = plot(lower1, color=color.new(color.orange, 0), style=plot.style_circles)
|
|
pLower2 = plot(lower2, color=color.new(color.orange, 0))
|
|
|
|
fill(pBasis, pUpper2, color=color.new(color.blue, 80))
|
|
fill(pUpper1, pUpper2, color=color.new(color.blue, 80))
|
|
fill(pBasis, pLower2, color=color.new(color.orange, 80))
|
|
fill(pLower1, pLower2, color=color.new(color.orange, 80))
|
|
|
|
|
|
|
|
|
|
// Parameters
|
|
bbLength = input.int(34, title="Length", minval=1)
|
|
bbMultiplier = input.float(2.0, title="Multiplier", minval=0.001, maxval=50)
|
|
|
|
// Source
|
|
priceData = close // Unique name for price data source
|
|
|
|
// Bollinger Bands Calculation
|
|
bbBasis = ta.sma(priceData, bbLength)
|
|
bbDeviation = ta.stdev(priceData, bbLength)
|
|
bbDeviationMultiplied = bbMultiplier * bbDeviation
|
|
|
|
bbUpperBand = bbBasis + bbDeviationMultiplied
|
|
bbLowerBand = bbBasis - bbDeviationMultiplied
|
|
|
|
// Plot Bollinger Bands
|
|
plot(bbBasis, color=color.blue, linewidth=2)
|
|
plot(bbUpperBand, color=color.blue)
|
|
plot(bbLowerBand, color=color.orange)
|
|
|
|
// Strategy Logic for Entry and Exit
|
|
enterLong = ta.crossover(priceData, bbUpperBand)
|
|
enterShort = ta.crossunder(priceData, bbLowerBand)
|
|
|
|
// Enter Long when price crosses over upper band
|
|
if (enterLong)
|
|
strategy.entry("Long", strategy.long)
|
|
// Enter Short when price crosses under lower band
|
|
if (enterShort)
|
|
strategy.entry("Short", strategy.short)
|
|
|
|
// Close Long when Short condition is met (i.e., price under lower band)
|
|
if (enterShort)
|
|
strategy.close("Long")
|
|
// Close Short when Long condition is met (i.e., price over upper band)
|
|
if (enterLong)
|
|
strategy.close("Short")
|
|
|
|
|
|
|
|
|
|
|
|
```
|
|
|
|
> Detail
|
|
|
|
https://www.fmz.com/strategy/450857
|
|
|
|
> Last Modified
|
|
|
|
2024-05-09 15:59:11
|