
211 lines
9.2 KiB
Markdown
211 lines
9.2 KiB
Markdown
|
|
> Name
|
|
|
|
比特币-移动平均线交叉策略-Bitcoin-MA-Crossover-Strategy
|
|
|
|
> Author
|
|
|
|
ChaoZhang
|
|
|
|
> Strategy Description
|
|
|
|
|
|
[trans]
|
|
|
|
|
|
## 概述
|
|
|
|
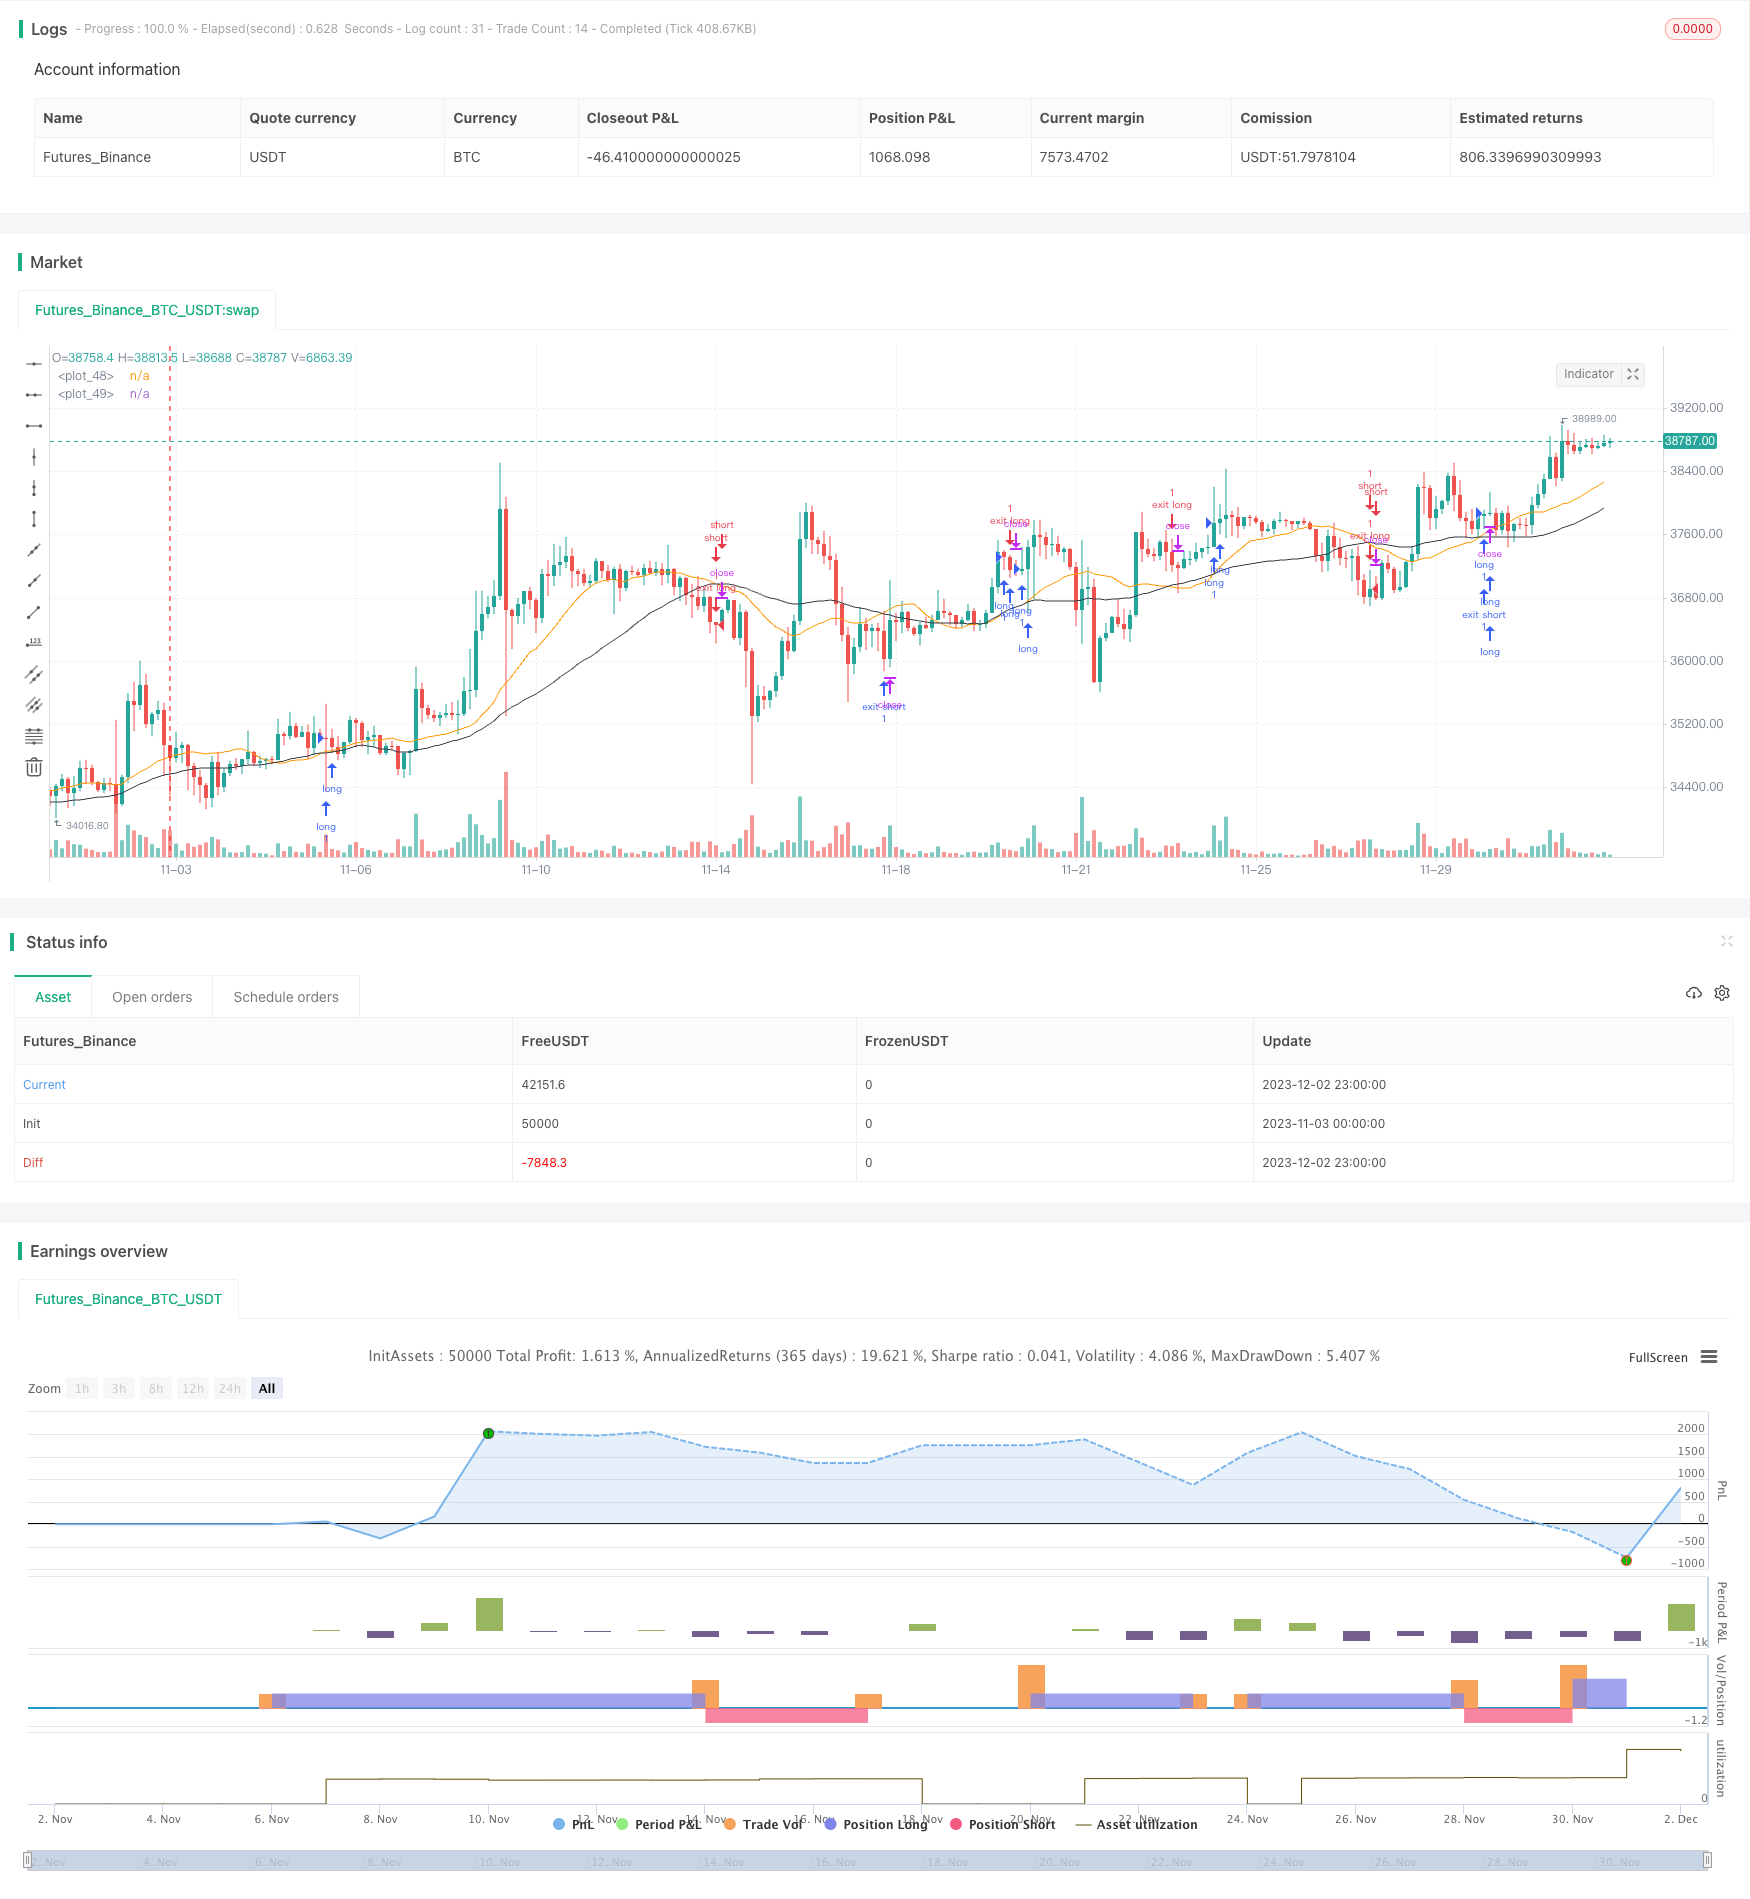
这个策略是基于比特币的移动平均线交叉原理设计的趋势跟随交易策略。策略使用快速移动平均线和慢速移动平均线的交叉作为买入和卖出信号。当快速移动平均线上穿慢速移动平均线时,视为金叉,做多;当快速移动平均线下穿慢速移动平均线时,视为死叉,做空。同时,策略还结合RSI指标避免莽夫入场。
|
|
|
|
## 策略原理
|
|
|
|
该策略主要基于两个指标:
|
|
|
|
1. 移动平均线(Moving Average,MA):计算一定周期内的收盘价平均值,用于判断价格走势和发生转折的信号。
|
|
|
|
2. 相对强弱指数(Relative Strength Index,RSI):计算一定周期内股价涨跌速度,判断超买超卖区域。
|
|
|
|
具体来说,策略使用长度较短的MA作为快线,长度较长的MA作为慢线。当快线上穿慢线时,表示短期价格上涨加速,产生买入信号;当快线下穿慢线时,表示短期价格下跌加速,产生卖出信号。
|
|
|
|
同时,策略还设置RSI的阈值,仅在RSI高于50时产生买入信号,RSI低于50时产生卖出信号,避免在价格剧烈波动时莽夫入场。
|
|
|
|
## 策略优势
|
|
|
|
该策略具有以下优势:
|
|
|
|
1. 原理简单,容易理解和实现。
|
|
2. 可靠的交易信号,避免了非理性入场。
|
|
3. 参数较少,易于优化。
|
|
4. 移动平均线技术成熟,应用广泛。
|
|
5. RSI指标可有效 indentify 超买超卖现象。
|
|
|
|
## 风险分析
|
|
|
|
该策略也存在一些风险:
|
|
|
|
1. 跟随趋势策略,容易在价格反转时造成较大亏损。
|
|
2. 移动平均线滞后,无法及时捕捉价格转折。
|
|
3. 错误参数选择可导致交易信号质量下降。
|
|
4. 策略仅基于技术指标,没有考虑基本面因素。
|
|
|
|
为降低风险,建议优化移动平均线周期参数,调整止损位置,适当缩小仓位规模。当基本面发生重大变化时,应暂停使用该策略。
|
|
|
|
## 优化方向
|
|
|
|
该策略有以下几个主要优化方向:
|
|
|
|
1. 优化移动平均线周期参数,找到最佳参数组合。可以通过逐步搜索、遗传算法等方法来优化。
|
|
|
|
2. 增加其他技术指标过滤,如KDJ、MACD等,提高交易信号质量。
|
|
|
|
3. 增加对价格波动的监控,根据波动率调整仓位和止损。
|
|
|
|
4. 结合交易量,避免虚假突破。只在成交量放大的情况下发出信号。
|
|
|
|
5. 开发参数自适应机制。允许策略根据不同市场环境,自动调整参数取值。
|
|
|
|
## 总结
|
|
|
|
本策略总体来说是一种较为典型的趋势跟随策略。基于移动平均线交叉原理,交易逻辑简单清晰,容易理解和实现。同时融入RSI指标可避免非理性交易。该策略可谓风险和收益并存,适合有一定量化交易经验的投资者使用,但需要注意防范潜在的亏损风险。如果开发人员能够加入更多过滤条件,优化参数自适应性,便可进一步提高策略的稳定盈利能力。
|
|
|
|
||
|
|
|
|
## Overview
|
|
|
|
This strategy is a trend following trading strategy designed based on the crossover principle of Bitcoin's moving average lines. The strategy uses the crossover of the fast moving average line and the slow moving average line as the buy and sell signals. When the fast moving average line crosses above the slow moving average line, it is considered a golden cross and goes long; when the fast moving average line crosses below the slow moving average line, it is considered a death cross and goes short. At the same time, the strategy also incorporates the RSI indicator to avoid reckless entry.
|
|
|
|
## Strategy Principle
|
|
|
|
The strategy is mainly based on two indicators:
|
|
|
|
1. Moving Average (MA): Calculates the average closing price over a certain period to determine price trends and reversal signals.
|
|
|
|
2. Relative Strength Index (RSI): Calculates the speed of price rises and falls over a certain period to judge overbought and oversold areas.
|
|
|
|
Specifically, the strategy uses a shorter MA as the fast line and a longer MA as the slow line. When the fast line crosses above the slow line, it indicates that the short-term price rise is accelerating and a buy signal is generated; when the fast line crosses below the slow line, it indicates that the short-term price decline is accelerating and a sell signal is generated.
|
|
|
|
At the same time, the strategy also sets a threshold for RSI, generating buy signals only when the RSI is above 50 and sell signals only when the RSI is below 50, avoiding reckless entry when prices fluctuate violently.
|
|
|
|
## Advantage Analysis
|
|
|
|
The strategy has the following advantages:
|
|
|
|
1. The principle is simple and easy to understand and implement.
|
|
2. Reliable trading signals avoid irrational entry.
|
|
3. Fewer parameters and easy to optimize.
|
|
4. Mature moving average technique with wide application.
|
|
5. RSI indicator can effectively identify overbought and oversold phenomena.
|
|
|
|
## Risk Analysis
|
|
|
|
The strategy also has some risks:
|
|
|
|
1. Trend following strategies are prone to large losses when prices reverse.
|
|
2. Moving averages lag and fail to promptly capture price reversals.
|
|
3. Incorrect parameter selection can lead to deteriorated trading signal quality.
|
|
4. The strategy only considers technical indicators without fundamental factors.
|
|
|
|
To mitigate risks, it is recommended to optimize the moving average period parameters, adjust stop loss positions, and appropriately scale down position sizes. The strategy should be suspended when major fundamental changes occur.
|
|
|
|
## Optimization Directions
|
|
|
|
The main optimization directions for this strategy include:
|
|
|
|
1. Optimize the moving average period parameters to find the optimal parameter combination, through incremental search, genetic algorithms, etc.
|
|
|
|
2. Increase other technical indicators for filtration, such as KDJ, MACD, etc. to improve trading signal quality.
|
|
|
|
3. Monitor price fluctuations and adjust positions and stop losses accordingly.
|
|
|
|
4. Incorporate trading volume to avoid false breakouts, only issuing signals when trading volume expands.
|
|
|
|
5. Develop parameter self-adaptive mechanisms, allowing strategies to automatically adjust parameter values based on different market environments.
|
|
|
|
## Conclusion
|
|
|
|
In summary, this is a typical trend-following strategy. Based on the principle of moving average crossover, the trading logic is simple and clear, easy to understand and implement. Incorporating the RSI indicator can avoid irrational trading. The strategy carries both risks and rewards, suitable for investors with some quant trading experience, but the potential loss risks need to be guarded against. If developers can add more filters, optimize parameter adaptivity, it can further improve the steady profitability of the strategy.
|
|
|
|
[/trans]
|
|
|
|
> Strategy Arguments
|
|
|
|
|
|
|
|
|Argument|Default|Description|
|
|
|----|----|----|
|
|
|v_input_1|10|Equity Risk (%)|
|
|
|v_input_2|20|Fast MA (Period)|
|
|
|v_input_3|40|Slow MA (Period)|
|
|
|v_input_4|14|RSI (Period)|
|
|
|
|
|
|
> Source (PineScript)
|
|
|
|
``` pinescript
|
|
/*backtest
|
|
start: 2023-11-03 00:00:00
|
|
end: 2023-12-03 00:00:00
|
|
period: 3h
|
|
basePeriod: 15m
|
|
exchanges: [{"eid":"Futures_Binance","currency":"BTC_USDT"}]
|
|
*/
|
|
|
|
//@version=4
|
|
//Trading Strategy Warning - Past performance may not equal future performance
|
|
//Account Size Warning - Performance based upon default 10% risk per trade, of account size $100,000. Adjust before you trade to see your own drawdown.
|
|
//Time Frame - D1 and H4, warning H4 has a lower profit factor (fake-outs, and account drawdown), D1 recommended
|
|
//Trend Following System - Profitability of this system is dependent on a STRONG trend in Bitcoin, into the future
|
|
strategy("Bitcoin - MA Crossover Strategy", overlay=true)
|
|
|
|
// User Input
|
|
usr_risk = input(title="Equity Risk (%)",type=input.integer,minval=1,maxval=100,step=1,defval=10,confirm=false)
|
|
sma_fast = input(title="Fast MA (Period)",type=input.integer,minval=1,maxval=500,step=1,defval=20,confirm=false)
|
|
sma_slow = input(title="Slow MA (Period)",type=input.integer,minval=1,maxval=500,step=1,defval=40,confirm=false)
|
|
rsi_valu = input(title="RSI (Period)",type=input.integer,minval=1,maxval=500,step=1,defval=14,confirm=false)
|
|
|
|
// Create Indicator's
|
|
shortSMA = sma(close, sma_fast)
|
|
longSMA = sma(close, sma_slow)
|
|
rsi = rsi(close, rsi_valu)
|
|
strategy.initial_capital = 50000
|
|
// Units to buy
|
|
amount = usr_risk / 100 * (strategy.initial_capital + strategy.netprofit)
|
|
units = floor(amount / close)
|
|
|
|
// Specify entry conditions
|
|
longEntry = crossover(shortSMA, longSMA)
|
|
shortEntry = crossunder(shortSMA, longSMA)
|
|
|
|
// Specify exit conditions
|
|
longExit = crossunder(shortSMA, longSMA)
|
|
shortExit = crossover(shortSMA, longSMA)
|
|
|
|
// Execute long trade
|
|
if (longEntry)
|
|
strategy.entry("long", strategy.long, units, when = rsi > 50)
|
|
|
|
// Exit long trade
|
|
if(longExit and strategy.position_size > 0)
|
|
strategy.order("exit long", strategy.short, abs(strategy.position_size))
|
|
|
|
// Execute short trade
|
|
if (shortEntry)
|
|
strategy.entry("short", strategy.short, units, when = rsi < 50)
|
|
|
|
// Exit short trade
|
|
if(shortExit and strategy.position_size < 0)
|
|
strategy.order("exit short", strategy.long, abs(strategy.position_size))
|
|
|
|
// Plot Moving Average's to chart
|
|
plot(shortSMA)
|
|
plot(longSMA, color=color.black)
|
|
```
|
|
|
|
> Detail
|
|
|
|
https://www.fmz.com/strategy/434167
|
|
|
|
> Last Modified
|
|
|
|
2023-12-04 13:55:45
|