
801 lines
35 KiB
Markdown
801 lines
35 KiB
Markdown
|
||
> Name
|
||
|
||
市场密码波浪B自动买卖策略Market-Cypher-Wave-B-Automated-Trading-Strategy
|
||
|
||
> Author
|
||
|
||
ChaoZhang
|
||
|
||
> Strategy Description
|
||
|
||
|
||
[trans]
|
||
## 概述
|
||
|
||
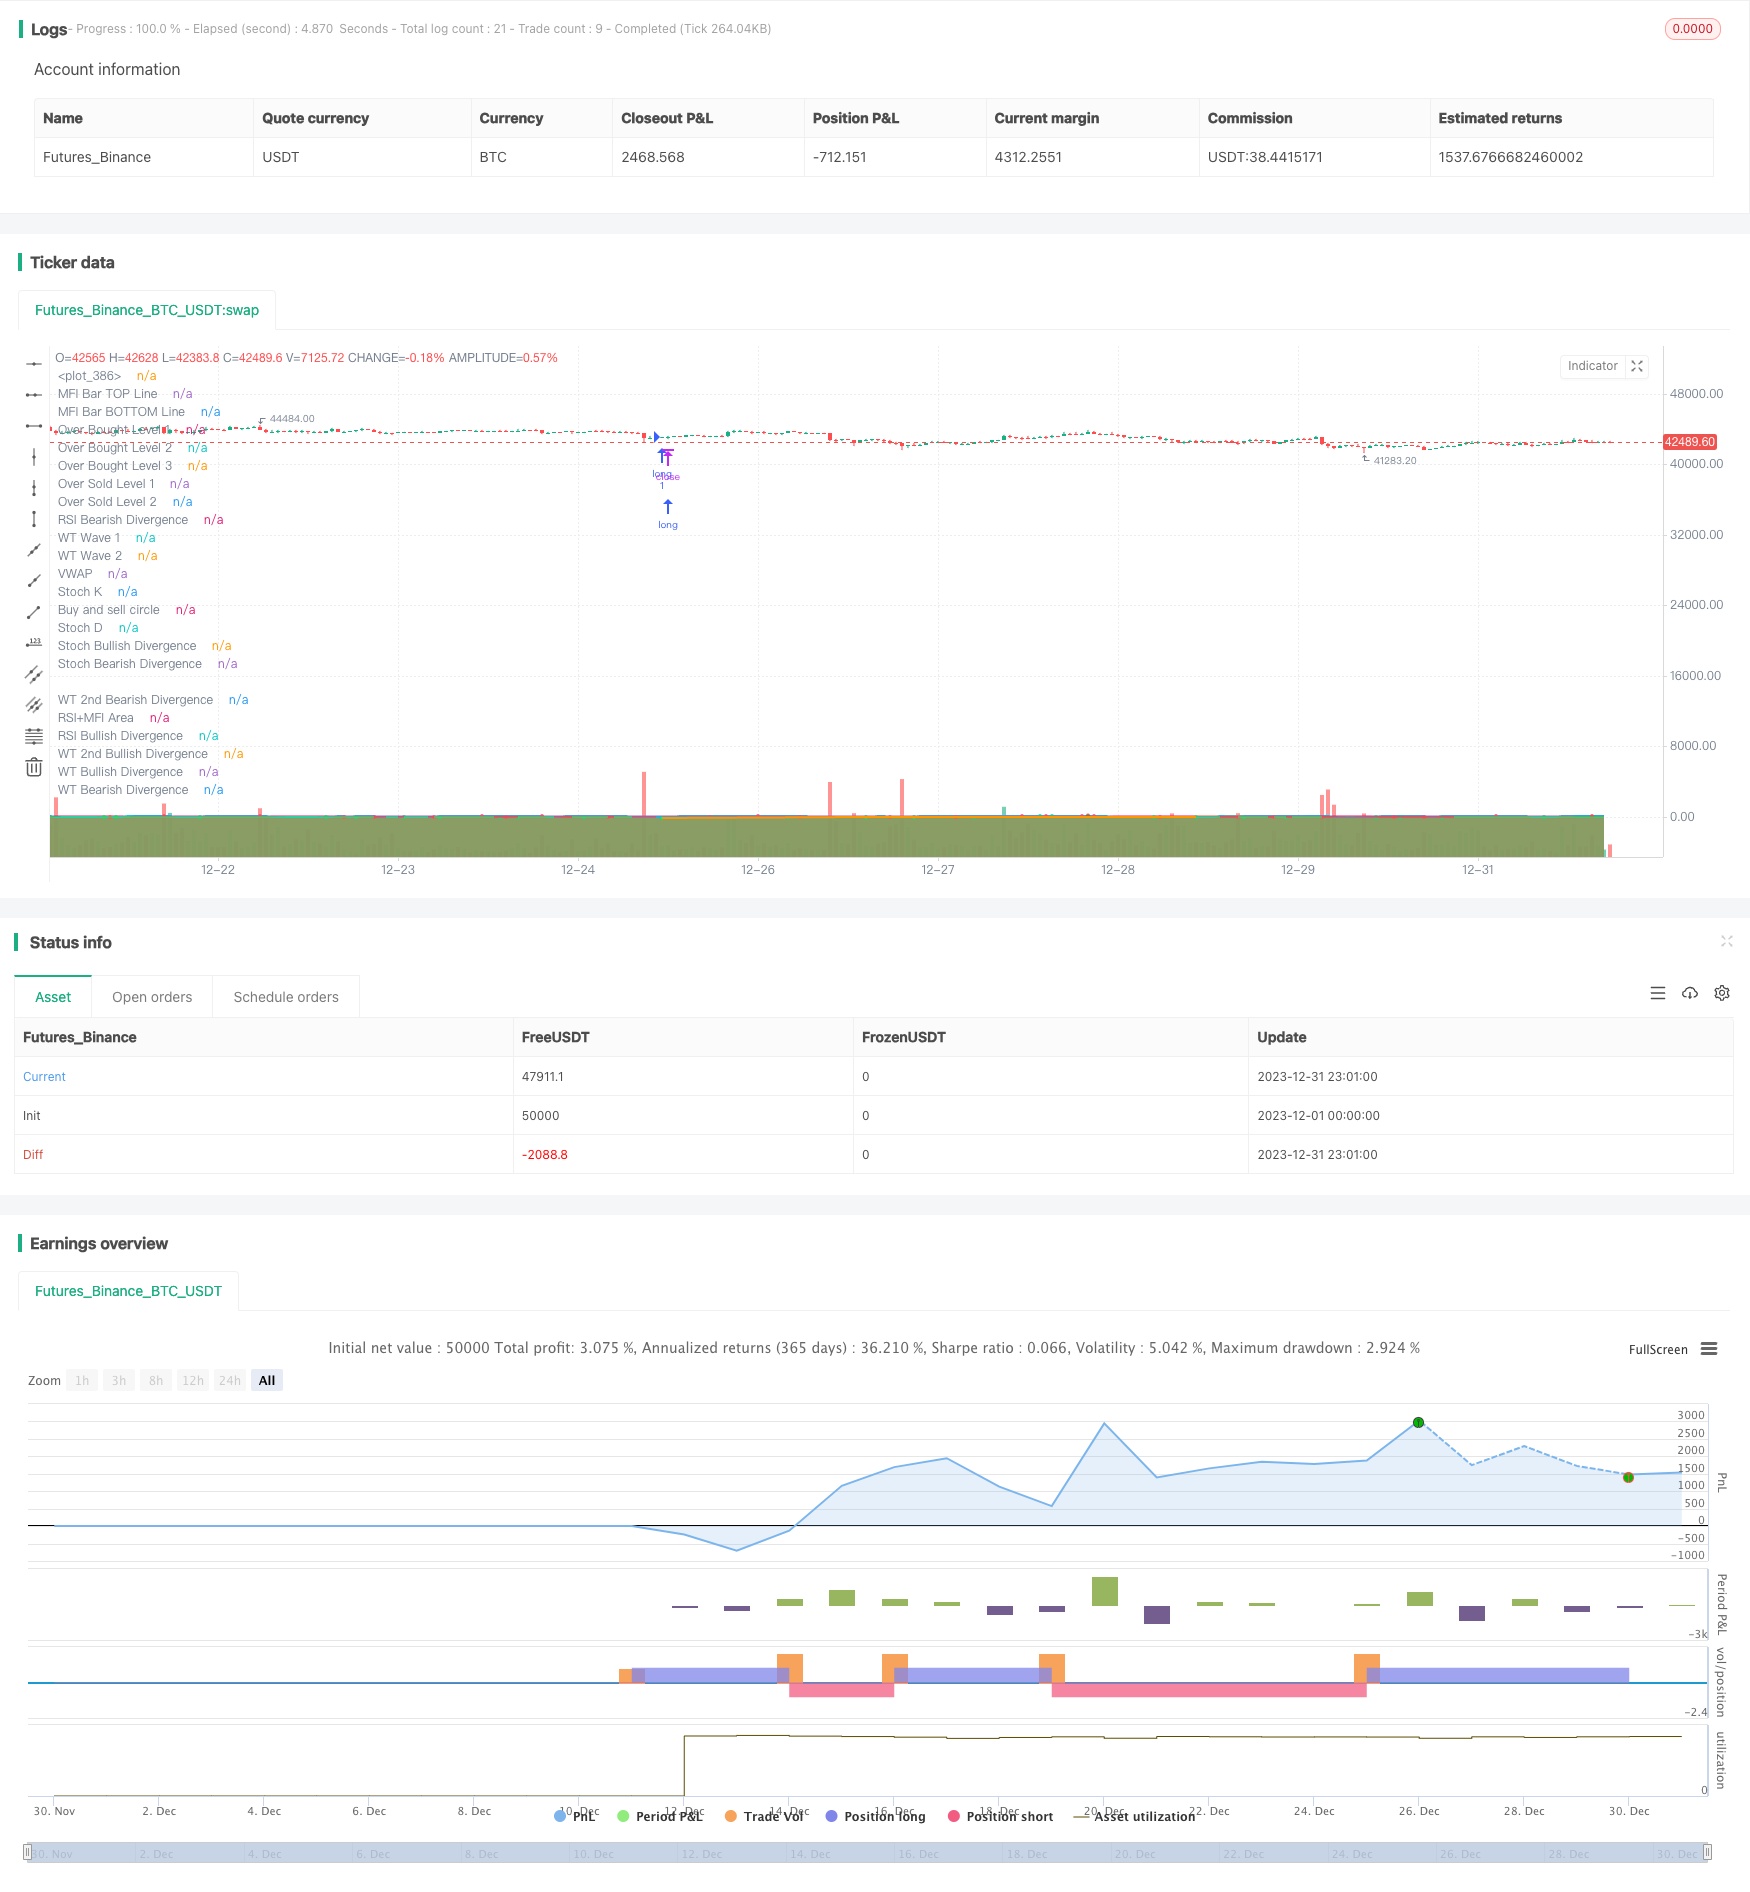
该策略利用市场密码指标的波浪理论,结合多种技术指标实现自动买卖。它可以在趋势开始时识别机会,实现趋势跟踪。
|
||
|
||
## 策略原理
|
||
|
||
该策略主要基于市场密码波浪B指标。该指标将价格行情分为1波和2波两个层面。1波反应敏感,2波反应平滑。它们的交叉为买卖信号。当1波上穿2波时为买入机会,下穿为卖出机会。
|
||
|
||
代码中通过Wavetrend函数计算出1波和2波。然后结合超买超卖区分波浪方向。例如当Wave1下穿Wave2,同时Wave2位于超买区,就是卖出信号。
|
||
|
||
此外,代码还引入多种辅助指标提高决策准确性,主要包括:
|
||
|
||
- 极值区域:结合RSI和资金流指标判断价格波动区域。
|
||
|
||
- KD:判断多空势头
|
||
|
||
- 背离:找出买卖转折点
|
||
|
||
- 旗形:判断趋势持续性
|
||
|
||
最后,根据Wave和辅助指标情况判断最终交易决策。
|
||
|
||
## 策略优势
|
||
|
||
该策略最大优势在于能够应对不同市场环境。具体来说,主要体现在以下几个方面:
|
||
|
||
1. 多种指标组合,判断准确性高
|
||
|
||
策略不仅使用Wave本身的交叉作为判断标准,还引入RSI、KD、背离等多个指标,通过组合提高决策的准确性。
|
||
|
||
2. 旗形判断,擅长捕捉趋势
|
||
|
||
通过引入旗形判断模块,能够有效判断趋势的持续性,避免头重脚轻,从而在趋势开始时就可以识别机会。这使得策略特别擅长趋势跟踪。
|
||
|
||
3. 手动参数优化空间大
|
||
|
||
策略参数可自定义程度高,用户可以根据自己对市场的判断和理解,选择不同参数进行优化,从而适应更加复杂的市场环境。这使策略应用范围更广。
|
||
|
||
## 策略风险
|
||
|
||
该策略也存在一些潜在风险,主要体现在以下几个方面:
|
||
|
||
1. 多辅助指标判断冲突
|
||
|
||
辅助指标众多,在某些极端行情下,可能存在指标判断发生冲突的情况。这会对最终决策带来不确定性。
|
||
|
||
2. 参数调优难度大
|
||
|
||
由于可调参数较多,想要达到最优的参数组合需要大量数据回测和测试,难度较大,容易出现过优化。
|
||
|
||
3. 买卖频率可能过高
|
||
|
||
在震荡行情中,Wave交叉可能出现频繁,从而导致交易次数过于频繁。这会带来额外的交易成本。
|
||
|
||
对应地,可以从以下几个方面来优化:
|
||
|
||
1. 引入更多过滤条件,确保决策稳健性
|
||
|
||
2. 优先调整对策略影响大的参数
|
||
|
||
3. 增大止损范围,降低买卖频率
|
||
|
||
## 总结
|
||
|
||
总的来说,该策略综合运用市场密码波浪理论和多种技术指标,实现了自动识别买卖点和跟踪趋势的能力。它参数可调性强,适应性广,擅长捕捉趋势机会。同时也需要注意一定的潜在风险,需要从升级判断规则和调整参数等方面不断优化,使策略更加稳健。
|
||
|
||
||
|
||
|
||
## Overview
|
||
|
||
This strategy utilizes the wave theory from Market Cypher indicator and combines multiple technical indicators to implement automated trading. It can identify opportunities when trend starts and track the trend.
|
||
|
||
## Strategy Principles
|
||
|
||
The strategy is mainly based on Market Cypher Wave B indicator. The indicator divides price action into two layers, Wave 1 and Wave 2. Wave 1 is more sensitive while Wave 2 is more smooth. Their crossover works as trading signals. When Wave 1 crosses above Wave 2, it's buying opportunity. When crosses below, it's selling opportunity.
|
||
|
||
The code calculates Wave 1 and Wave 2 using the Wavetrend function. Then it determines wave direction together with overbought/oversold area. For example, when Wave 1 crosses below Wave 2 while Wave 2 is in overbought area, it triggers a sell signal.
|
||
|
||
In addition, the code also incorporates multiple auxiliary indicators to improve decision accuracy, including:
|
||
|
||
- Extreme area: Identify price fluctuation levels combining RSI and Money Flow Index
|
||
|
||
- KD: Judge bullish/bearish momentum
|
||
|
||
- Divergence: Locate buying/selling turning points
|
||
|
||
- Flags: Judge trend persistency
|
||
|
||
Finally, it makes trading decisions based on Waves and auxiliary indicators.
|
||
|
||
## Strategy Advantages
|
||
|
||
The biggest strength of this strategy is the ability to adapt to different market environments. Specifically:
|
||
|
||
1. Multiple indicators combined improve decision accuracy
|
||
|
||
The strategy uses not only Wave crossover itself, but also RSI, KD, divergence etc. By combining signals, it improves accuracy.
|
||
|
||
2. Flags catch trends
|
||
|
||
With flags, the strategy can effectively determine trend persistency and avoid false signals. This allows it to identify trend opportunities early on and excell at trend following.
|
||
|
||
3. Highly customizable
|
||
|
||
The strategy has many adjustable parameters. Users can optimize based on their own market views and adapt to more complex environments. This makes the strategy widely applicable.
|
||
|
||
## Risks
|
||
|
||
There are also some potential risks:
|
||
|
||
1. Conflicting signals between indicators
|
||
|
||
With many indicators, there could be conflicting signals in extreme market conditions. This introduces uncertainty in final decisions.
|
||
|
||
2. Difficult to optimize parameters
|
||
|
||
Too many parameters makes optimization challenging. It requires lots of backtesting to find optimal parameter sets and risks overfitting.
|
||
|
||
3. Potentially too frequent trading
|
||
|
||
In ranging markets, Wave crossover may happen frequently and incur excessive trading costs.
|
||
|
||
Corresponding improvements include:
|
||
|
||
1. Introduce more filters to ensure decision robustness
|
||
|
||
2. Prioritize parameters with higher strategy impact
|
||
|
||
3. Expand stop loss to lower trading frequency
|
||
|
||
## Summary
|
||
|
||
In summary, this strategy combines Market Cypher wave theory and various indicators to achieve automated identification of trading signals and trend tracking. With high customizability, it adapts well and excels at catching trends. Meanwhile, potential risks call for continuous improvements like more robust rules and better parameter tuning to make the strategy more robust.
|
||
[/trans]
|
||
|
||
> Strategy Arguments
|
||
|
||
|
||
|
||
|Argument|Default|Description|
|
||
|----|----|----|
|
||
|v_input_1|true|Show WaveTrend|
|
||
|v_input_2|true|Show Buy dots|
|
||
|v_input_3|true|Show Gold dots|
|
||
|v_input_4|true|Show Sell dots|
|
||
|v_input_5|true|Show Div. dots|
|
||
|v_input_6|true|Show Fast WT|
|
||
|v_input_7|9|WT Channel Length|
|
||
|v_input_8|12|WT Average Length|
|
||
|v_input_9_hlc3|0|WT MA Source: hlc3|high|low|open|hl2|close|hlcc4|ohlc4|
|
||
|v_input_10|3|WT MA Length|
|
||
|v_input_11|70|WT Overbought Level 1|
|
||
|v_input_12|99|WT Overbought Level 2|
|
||
|v_input_13|99|WT Overbought Level 3|
|
||
|v_input_14|-99|WT Oversold Level 2|
|
||
|v_input_15|-99|WT Oversold Level 3|
|
||
|v_input_16|true|Show WT Regular Divergences|
|
||
|v_input_17|false|Show WT Hidden Divergences|
|
||
|v_input_18|true|Not apply OB/OS Limits on Hidden Divergences|
|
||
|v_input_19|81|WT Bearish Divergence min|
|
||
|v_input_20|true|Show 2nd WT Regular Divergences|
|
||
|v_input_21|63|WT 2nd Bearish Divergence|
|
||
|v_input_22|true|Show MFI|
|
||
|v_input_23|60|MFI Period|
|
||
|v_input_float_1|150|MFI Area multiplier|
|
||
|v_input_24|2.5|MFI Area Y Pos|
|
||
|v_input_25|false|Show RSI|
|
||
|v_input_26_close|0|RSI Source: close|high|low|open|hl2|hlc3|hlcc4|ohlc4|
|
||
|v_input_27|14|RSI Length|
|
||
|v_input_int_1|30|RSI Oversold|
|
||
|v_input_int_2|60|RSI Overbought|
|
||
|v_input_28|false|Show RSI Regular Divergences|
|
||
|v_input_29|false|Show RSI Hidden Divergences|
|
||
|v_input_30|60|RSI Bearish Divergence min|
|
||
|v_input_31|30|RSI Bullish Divergence min|
|
||
|v_input_32|true|Show Stochastic RSI|
|
||
|v_input_33|true| Use Log?|
|
||
|v_input_34|false|Use Average of both K & D|
|
||
|v_input_35_close|0|Stochastic RSI Source: close|high|low|open|hl2|hlc3|hlcc4|ohlc4|
|
||
|v_input_36|14|Stochastic RSI Length|
|
||
|v_input_37|14|RSI Length |
|
||
|v_input_38|3|Stochastic RSI K Smooth|
|
||
|v_input_39|3|Stochastic RSI D Smooth|
|
||
|v_input_40|false|Show Stoch Regular Divergences|
|
||
|v_input_41|false|Show Stoch Hidden Divergences|
|
||
|v_input_42|false|Show Schaff TC line|
|
||
|v_input_43_close|0|Schaff TC Source: close|high|low|open|hl2|hlc3|hlcc4|ohlc4|
|
||
|v_input_44|10|Schaff TC|
|
||
|v_input_45|23|Schaff TC Fast Lenght|
|
||
|v_input_46|50|Schaff TC Slow Length|
|
||
|v_input_47|0.5|Schaff TC Factor|
|
||
|v_input_48|false|Show Sommi flag|
|
||
|v_input_49|false|Show Sommi F. Wave|
|
||
|v_input_50|720|Sommi F. Wave timeframe|
|
||
|v_input_51|false|F. Wave Bear Level (less than)|
|
||
|v_input_52|false|F. Wave Bull Level (more than)|
|
||
|v_input_53|false|WT Bear Level (more than)|
|
||
|v_input_54|false|WT Bull Level (less than)|
|
||
|v_input_55|false|Money flow Bear Level (less than)|
|
||
|v_input_56|false|Money flow Bull Level (more than)|
|
||
|v_input_57|false|Show Sommi diamond|
|
||
|v_input_58|60|HTF Candle Res. 1|
|
||
|v_input_59|240|HTF Candle Res. 2|
|
||
|v_input_60|false|WT Bear Level (More than)|
|
||
|v_input_61|false|WT Bull Level (Less than)|
|
||
|v_input_62|false|Show MACD Colors|
|
||
|v_input_63|240|MACD Colors MACD TF|
|
||
|v_input_64|false|Dark mode|
|
||
|v_input_float_2|false|Stop Loss % |
|
||
|v_input_float_3|false|Take Profit % |
|
||
|v_input_float_4|false|Trailing Stop Loss %|
|
||
|v_input_65|timestamp(01 Sep 2002 13:30 +0000)|Backtesting Start Time|
|
||
|v_input_66|timestamp(30 Sep 2099 19:30 +0000)|Backtesting End Time|
|
||
|
||
|
||
> Source (PineScript)
|
||
|
||
``` pinescript
|
||
/*backtest
|
||
start: 2023-12-01 00:00:00
|
||
end: 2023-12-31 23:59:59
|
||
period: 1h
|
||
basePeriod: 15m
|
||
exchanges: [{"eid":"Futures_Binance","currency":"BTC_USDT"}]
|
||
*/
|
||
|
||
// This source code is subject to the terms of the Mozilla Public License 2.0 at https://mozilla.org/MPL/2.0/
|
||
// © vumanchu
|
||
|
||
//@version=5
|
||
|
||
|
||
// Thanks to dynausmaux for the code
|
||
// Thanks to falconCoin for https://www.tradingview.com/script/KVfgBvDd-Market-Cipher-B-Free-version-with-Buy-and-sell/ inspired me to start this.
|
||
// Thanks to LazyBear for WaveTrend Oscillator https://www.tradingview.com/script/2KE8wTuF-Indicator-WaveTrend-Oscillator-WT/
|
||
// Thanks to RicardoSantos for https://www.tradingview.com/script/3oeDh0Yq-RS-Price-Divergence-Detector-V2/
|
||
// Thanks to LucemAnb for Plain Stochastic Divergence https://www.tradingview.com/script/FCUgF8ag-Plain-Stochastic-Divergence/
|
||
// Thanks to andreholanda73 for MFI+RSI Area https://www.tradingview.com/script/UlGZzUAr/
|
||
// I especially want to thank TradingView for its platform that facilitates development and learning.
|
||
|
||
//
|
||
// CIRCLES & TRIANGLES:
|
||
// - LITTLE CIRCLE: They appear at all WaveTrend wave crossings.
|
||
// - GREEN CIRCLE: The wavetrend waves are at the oversold level and have crossed up (bullish).
|
||
// - RED CIRCLE: The wavetrend waves are at the overbought level and have crossed down (bearish).
|
||
// - GOLD/ORANGE CIRCLE: When RSI is below 20, WaveTrend waves are below or equal to -80 and have crossed up after good bullish divergence (DONT BUY WHEN GOLD CIRCLE APPEAR).
|
||
// - None of these circles are certain signs to trade. It is only information that can help you.
|
||
// - PURPLE TRIANGLE: Appear when a bullish or bearish divergence is formed and WaveTrend waves crosses at overbought and oversold points.
|
||
//
|
||
// NOTES:
|
||
// - I am not an expert trader or know how to program pine script as such, in fact it is my first indicator only to study and all the code is copied and modified from other codes that are published in TradingView.
|
||
// - I am very grateful to the entire TV community that publishes codes so that other newbies like me can learn and present their results. This is an attempt to imitate Market Cipher B.
|
||
// - Settings by default are for 4h timeframe, divergences are more stronger and accurate. Haven't tested in all timeframes, only 2h and 4h.
|
||
// - If you get an interesting result in other timeframes I would be very grateful if you would comment your configuration to implement it or at least check it.
|
||
//
|
||
// CONTRIBUTIONS:
|
||
// - Tip/Idea: Add higher timeframe analysis for bearish/bullish patterns at the current timeframe.
|
||
// + Bearish/Bullish FLAG:
|
||
// - MFI+RSI Area are RED (Below 0).
|
||
// - Wavetrend waves are above 0 and crosses down.
|
||
// - VWAP Area are below 0 on higher timeframe.
|
||
// - This pattern reversed becomes bullish.
|
||
// - Tip/Idea: Check the last heikinashi candle from 2 higher timeframe
|
||
// + Bearish/Bullish DIAMOND:
|
||
// - HT Candle is red
|
||
// - WT > 0 and crossed down
|
||
|
||
strategy(title='MCB CIRCLE ONLY PGB STRAT BUN TP SL TEST', shorttitle='MCB CIRCLE ONLY PGB STRAT BUN TP SL TEST', overlay=true )
|
||
// strategy.cash
|
||
//max_bars_back = 200)
|
||
|
||
// PARAMETERS {
|
||
|
||
// WaveTrend
|
||
wtShow = input(true, title='Show WaveTrend')
|
||
wtBuyShow = input(true, title='Show Buy dots')
|
||
wtGoldShow = input(true, title='Show Gold dots')
|
||
wtSellShow = input(true, title='Show Sell dots')
|
||
wtDivShow = input(true, title='Show Div. dots')
|
||
vwapShow = input(true, title='Show Fast WT')
|
||
wtChannelLen = input(9, title='WT Channel Length')
|
||
wtAverageLen = input(12, title='WT Average Length')
|
||
wtMASource = input(hlc3, title='WT MA Source')
|
||
wtMALen = input(3, title='WT MA Length')
|
||
|
||
// WaveTrend Overbought & Oversold lines
|
||
obLevel = input(70, title='WT Overbought Level 1')
|
||
obLevel2 = input(99, title='WT Overbought Level 2')
|
||
obLevel3 = input(99, title='WT Overbought Level 3')
|
||
osLevel = -obLevel
|
||
osLevel2 = input(-99, title='WT Oversold Level 2')
|
||
osLevel3 = input(-99, title='WT Oversold Level 3')
|
||
|
||
// Divergence WT
|
||
wtShowDiv = input(true, title='Show WT Regular Divergences')
|
||
wtShowHiddenDiv = input(false, title='Show WT Hidden Divergences')
|
||
showHiddenDiv_nl = input(true, title='Not apply OB/OS Limits on Hidden Divergences')
|
||
wtDivOBLevel = input(81, title='WT Bearish Divergence min')
|
||
// wtDivOSLevel = input(-91, title='WT Bullish Divergence min')
|
||
wtDivOSLevel = -wtDivOBLevel
|
||
|
||
// Divergence extra range
|
||
wtDivOBLevel_addshow = input(true, title='Show 2nd WT Regular Divergences')
|
||
wtDivOBLevel_add = input(63, title='WT 2nd Bearish Divergence')
|
||
// wtDivOSLevel_add = input(-40, title='WT 2nd Bullish Divergence 15 min')
|
||
wtDivOSLevel_add = -wtDivOBLevel_add
|
||
|
||
// RSI+MFI
|
||
rsiMFIShow = input(true, title='Show MFI')
|
||
rsiMFIperiod = input(60, title='MFI Period')
|
||
rsiMFIMultiplier = input.float(150, title='MFI Area multiplier')
|
||
rsiMFIPosY = input(2.5, title='MFI Area Y Pos')
|
||
|
||
// RSI
|
||
rsiShow = input(false, title='Show RSI')
|
||
rsiSRC = input(close, title='RSI Source')
|
||
rsiLen = input(14, title='RSI Length')
|
||
rsiOversold = input.int(30, title='RSI Oversold', minval=30, maxval=100)
|
||
rsiOverbought = input.int(60, title='RSI Overbought', minval=0, maxval=60)
|
||
|
||
// Divergence RSI
|
||
rsiShowDiv = input(false, title='Show RSI Regular Divergences')
|
||
rsiShowHiddenDiv = input(false, title='Show RSI Hidden Divergences')
|
||
rsiDivOBLevel = input(60, title='RSI Bearish Divergence min')
|
||
rsiDivOSLevel = input(30, title='RSI Bullish Divergence min')
|
||
|
||
// RSI Stochastic
|
||
stochShow = input(true, title='Show Stochastic RSI')
|
||
stochUseLog = input(true, title=' Use Log?')
|
||
stochAvg = input(false, title='Use Average of both K & D')
|
||
stochSRC = input(close, title='Stochastic RSI Source')
|
||
stochLen = input(14, title='Stochastic RSI Length')
|
||
stochRsiLen = input(14, title='RSI Length ')
|
||
stochKSmooth = input(3, title='Stochastic RSI K Smooth')
|
||
stochDSmooth = input(3, title='Stochastic RSI D Smooth')
|
||
|
||
// Divergence stoch
|
||
stochShowDiv = input(false, title='Show Stoch Regular Divergences')
|
||
stochShowHiddenDiv = input(false, title='Show Stoch Hidden Divergences')
|
||
|
||
// Schaff Trend Cycle
|
||
tcLine = input(false, title='Show Schaff TC line')
|
||
tcSRC = input(close, title='Schaff TC Source')
|
||
tclength = input(10, title='Schaff TC')
|
||
tcfastLength = input(23, title='Schaff TC Fast Lenght')
|
||
tcslowLength = input(50, title='Schaff TC Slow Length')
|
||
tcfactor = input(0.5, title='Schaff TC Factor')
|
||
|
||
// Sommi Flag
|
||
sommiFlagShow = input(false, title='Show Sommi flag')
|
||
sommiShowVwap = input(false, title='Show Sommi F. Wave')
|
||
sommiVwapTF = input('720', title='Sommi F. Wave timeframe')
|
||
sommiVwapBearLevel = input(0, title='F. Wave Bear Level (less than)')
|
||
sommiVwapBullLevel = input(0, title='F. Wave Bull Level (more than)')
|
||
soomiFlagWTBearLevel = input(0, title='WT Bear Level (more than)')
|
||
soomiFlagWTBullLevel = input(0, title='WT Bull Level (less than)')
|
||
soomiRSIMFIBearLevel = input(0, title='Money flow Bear Level (less than)')
|
||
soomiRSIMFIBullLevel = input(0, title='Money flow Bull Level (more than)')
|
||
|
||
// Sommi Diamond
|
||
sommiDiamondShow = input(false, title='Show Sommi diamond')
|
||
sommiHTCRes = input('60', title='HTF Candle Res. 1')
|
||
sommiHTCRes2 = input('240', title='HTF Candle Res. 2')
|
||
soomiDiamondWTBearLevel = input(0, title='WT Bear Level (More than)')
|
||
soomiDiamondWTBullLevel = input(0, title='WT Bull Level (Less than)')
|
||
|
||
// macd Colors
|
||
macdWTColorsShow = input(false, title='Show MACD Colors')
|
||
macdWTColorsTF = input('240', title='MACD Colors MACD TF')
|
||
|
||
darkMode = input(false, title='Dark mode')
|
||
|
||
|
||
// Colors
|
||
colorRed = #ff0000
|
||
colorPurple = #e600e6
|
||
colorGreen = #3fff00
|
||
colorOrange = #e2a400
|
||
colorYellow = #ffe500
|
||
colorWhite = #ffffff
|
||
colorPink = #ff00f0
|
||
colorBluelight = #31c0ff
|
||
|
||
colorWT1 = #90caf9
|
||
colorWT2 = #0d47a1
|
||
|
||
colorWT2_ = #131722
|
||
|
||
colormacdWT1a = #4caf58
|
||
colormacdWT1b = #af4c4c
|
||
colormacdWT1c = #7ee57e
|
||
colormacdWT1d = #ff3535
|
||
|
||
colormacdWT2a = #305630
|
||
colormacdWT2b = #310101
|
||
colormacdWT2c = #132213
|
||
colormacdWT2d = #770000
|
||
|
||
// } PARAMETERS
|
||
|
||
|
||
// FUNCTIONS {
|
||
|
||
// Divergences
|
||
f_top_fractal(src) =>
|
||
src[4] < src[2] and src[3] < src[2] and src[2] > src[1] and src[2] > src[0]
|
||
f_bot_fractal(src) =>
|
||
src[4] > src[2] and src[3] > src[2] and src[2] < src[1] and src[2] < src[0]
|
||
f_fractalize(src) =>
|
||
f_top_fractal(src) ? 1 : f_bot_fractal(src) ? -1 : 0
|
||
|
||
f_findDivs(src, topLimit, botLimit, useLimits) =>
|
||
fractalTop = f_fractalize(src) > 0 and (useLimits ? src[2] >= topLimit : true) ? src[2] : na
|
||
fractalBot = f_fractalize(src) < 0 and (useLimits ? src[2] <= botLimit : true) ? src[2] : na
|
||
highPrev = ta.valuewhen(fractalTop, src[2], 0)[2]
|
||
highPrice = ta.valuewhen(fractalTop, high[2], 0)[2]
|
||
lowPrev = ta.valuewhen(fractalBot, src[2], 0)[2]
|
||
lowPrice = ta.valuewhen(fractalBot, low[2], 0)[2]
|
||
bearSignal = fractalTop and high[2] > highPrice and src[2] < highPrev
|
||
bullSignal = fractalBot and low[2] < lowPrice and src[2] > lowPrev
|
||
bearDivHidden = fractalTop and high[2] < highPrice and src[2] > highPrev
|
||
bullDivHidden = fractalBot and low[2] > lowPrice and src[2] < lowPrev
|
||
[fractalTop, fractalBot, lowPrev, bearSignal, bullSignal, bearDivHidden, bullDivHidden]
|
||
|
||
// RSI+MFI
|
||
f_rsimfi(_period, _multiplier, _tf) =>
|
||
request.security(syminfo.tickerid, _tf, ta.sma((close - open) / (high - low) * _multiplier, _period) - rsiMFIPosY)
|
||
|
||
// WaveTrend
|
||
f_wavetrend(src, chlen, avg, malen, tf) =>
|
||
tfsrc = request.security(syminfo.tickerid, tf, src)
|
||
esa = ta.ema(tfsrc, chlen)
|
||
de = ta.ema(math.abs(tfsrc - esa), chlen)
|
||
ci = (tfsrc - esa) / (0.015 * de)
|
||
wt1 = request.security(syminfo.tickerid, tf, ta.ema(ci, avg))
|
||
wt2 = request.security(syminfo.tickerid, tf, ta.sma(wt1, malen))
|
||
wtVwap = wt1 - wt2
|
||
wtOversold = wt2 <= osLevel
|
||
wtOverbought = wt2 >= obLevel
|
||
wtCross = ta.cross(wt1, wt2)
|
||
wtCrossUp = wt2 - wt1 <= 0
|
||
wtCrossDown = wt2 - wt1 >= 0
|
||
wtCrosslast = ta.cross(wt1[2], wt2[2])
|
||
wtCrossUplast = wt2[2] - wt1[2] <= 0
|
||
wtCrossDownlast = wt2[2] - wt1[2] >= 0
|
||
[wt1, wt2, wtOversold, wtOverbought, wtCross, wtCrossUp, wtCrossDown, wtCrosslast, wtCrossUplast, wtCrossDownlast, wtVwap]
|
||
|
||
// Schaff Trend Cycle
|
||
f_tc(src, length, fastLength, slowLength) =>
|
||
ema1 = ta.ema(src, fastLength)
|
||
ema2 = ta.ema(src, slowLength)
|
||
macdVal = ema1 - ema2
|
||
alpha = ta.lowest(macdVal, length)
|
||
beta = ta.highest(macdVal, length) - alpha
|
||
gamma = (macdVal - alpha) / beta * 100
|
||
gamma := beta > 0 ? gamma : nz(gamma[1])
|
||
delta = gamma
|
||
delta := na(delta[1]) ? delta : delta[1] + tcfactor * (gamma - delta[1])
|
||
epsilon = ta.lowest(delta, length)
|
||
zeta = ta.highest(delta, length) - epsilon
|
||
eta = (delta - epsilon) / zeta * 100
|
||
eta := zeta > 0 ? eta : nz(eta[1])
|
||
stcReturn = eta
|
||
stcReturn := na(stcReturn[1]) ? stcReturn : stcReturn[1] + tcfactor * (eta - stcReturn[1])
|
||
stcReturn
|
||
|
||
// Stochastic RSI
|
||
f_stochrsi(_src, _stochlen, _rsilen, _smoothk, _smoothd, _log, _avg) =>
|
||
src = _log ? math.log(_src) : _src
|
||
rsi = ta.rsi(src, _rsilen)
|
||
kk = ta.sma(ta.stoch(rsi, rsi, rsi, _stochlen), _smoothk)
|
||
d1 = ta.sma(kk, _smoothd)
|
||
avg_1 = math.avg(kk, d1)
|
||
k = _avg ? avg_1 : kk
|
||
[k, d1]
|
||
|
||
// MACD
|
||
f_macd(src, fastlen, slowlen, sigsmooth, tf) =>
|
||
fast_ma = request.security(syminfo.tickerid, tf, ta.ema(src, fastlen))
|
||
slow_ma = request.security(syminfo.tickerid, tf, ta.ema(src, slowlen))
|
||
macd = fast_ma - slow_ma
|
||
signal = request.security(syminfo.tickerid, tf, ta.sma(macd, sigsmooth))
|
||
hist = macd - signal
|
||
[macd, signal, hist]
|
||
|
||
// MACD Colors on WT
|
||
f_macdWTColors(tf) =>
|
||
hrsimfi = f_rsimfi(rsiMFIperiod, rsiMFIMultiplier, tf)
|
||
[macd, signal, hist] = f_macd(close, 28, 42, 9, macdWTColorsTF)
|
||
macdup = macd >= signal
|
||
macddown = macd <= signal
|
||
macdWT1Color = macdup ? hrsimfi > 0 ? colormacdWT1c : colormacdWT1a : macddown ? hrsimfi < 0 ? colormacdWT1d : colormacdWT1b : na
|
||
macdWT2Color = macdup ? hrsimfi < 0 ? colormacdWT2c : colormacdWT2a : macddown ? hrsimfi < 0 ? colormacdWT2d : colormacdWT2b : na
|
||
[macdWT1Color, macdWT2Color]
|
||
|
||
// Get higher timeframe candle
|
||
f_getTFCandle(_tf) =>
|
||
_open = request.security(ticker.heikinashi(syminfo.tickerid), _tf, open, barmerge.gaps_off, barmerge.lookahead_on)
|
||
_close = request.security(ticker.heikinashi(syminfo.tickerid), _tf, close, barmerge.gaps_off, barmerge.lookahead_on)
|
||
_high = request.security(ticker.heikinashi(syminfo.tickerid), _tf, high, barmerge.gaps_off, barmerge.lookahead_on)
|
||
_low = request.security(ticker.heikinashi(syminfo.tickerid), _tf, low, barmerge.gaps_off, barmerge.lookahead_on)
|
||
hl2 = (_high + _low) / 2.0
|
||
newBar = ta.change(_open)
|
||
candleBodyDir = _close > _open
|
||
[candleBodyDir, newBar]
|
||
|
||
// Sommi flag
|
||
f_findSommiFlag(tf, wt1, wt2, rsimfi, wtCross, wtCrossUp, wtCrossDown) =>
|
||
[hwt1, hwt2, hwtOversold, hwtOverbought, hwtCross, hwtCrossUp, hwtCrossDown, hwtCrosslast, hwtCrossUplast, hwtCrossDownlast, hwtVwap] = f_wavetrend(wtMASource, wtChannelLen, wtAverageLen, wtMALen, tf)
|
||
|
||
bearPattern = rsimfi < soomiRSIMFIBearLevel and wt2 > soomiFlagWTBearLevel and wtCross and wtCrossDown and hwtVwap < sommiVwapBearLevel
|
||
|
||
bullPattern = rsimfi > soomiRSIMFIBullLevel and wt2 < soomiFlagWTBullLevel and wtCross and wtCrossUp and hwtVwap > sommiVwapBullLevel
|
||
|
||
[bearPattern, bullPattern, hwtVwap]
|
||
|
||
f_findSommiDiamond(tf, tf2, wt1, wt2, wtCross, wtCrossUp, wtCrossDown) =>
|
||
[candleBodyDir, newBar] = f_getTFCandle(tf)
|
||
[candleBodyDir2, newBar2] = f_getTFCandle(tf2)
|
||
bearPattern = wt2 >= soomiDiamondWTBearLevel and wtCross and wtCrossDown and not candleBodyDir and not candleBodyDir2
|
||
bullPattern = wt2 <= soomiDiamondWTBullLevel and wtCross and wtCrossUp and candleBodyDir and candleBodyDir2
|
||
[bearPattern, bullPattern]
|
||
|
||
// } FUNCTIONS
|
||
|
||
// CALCULATE INDICATORS {
|
||
|
||
// RSI
|
||
rsi = ta.rsi(rsiSRC, rsiLen)
|
||
rsiColor = rsi <= rsiOversold ? colorGreen : rsi >= rsiOverbought ? colorRed : colorPurple
|
||
|
||
// RSI + MFI Area
|
||
rsiMFI = f_rsimfi(rsiMFIperiod, rsiMFIMultiplier, timeframe.period)
|
||
rsiMFIColor = rsiMFI > 0 ? #3ee145 : #ff3d2e
|
||
|
||
// Calculates WaveTrend
|
||
[wt1, wt2, wtOversold, wtOverbought, wtCross, wtCrossUp, wtCrossDown, wtCross_last, wtCrossUp_last, wtCrossDown_last, wtVwap] = f_wavetrend(wtMASource, wtChannelLen, wtAverageLen, wtMALen, timeframe.period)
|
||
|
||
// Stochastic RSI
|
||
[stochK, stochD] = f_stochrsi(stochSRC, stochLen, stochRsiLen, stochKSmooth, stochDSmooth, stochUseLog, stochAvg)
|
||
|
||
// Schaff Trend Cycle
|
||
tcVal = f_tc(tcSRC, tclength, tcfastLength, tcslowLength)
|
||
|
||
// Sommi flag
|
||
[sommiBearish, sommiBullish, hvwap] = f_findSommiFlag(sommiVwapTF, wt1, wt2, rsiMFI, wtCross, wtCrossUp, wtCrossDown)
|
||
|
||
//Sommi diamond
|
||
[sommiBearishDiamond, sommiBullishDiamond] = f_findSommiDiamond(sommiHTCRes, sommiHTCRes2, wt1, wt2, wtCross, wtCrossUp, wtCrossDown)
|
||
|
||
// macd colors
|
||
[macdWT1Color, macdWT2Color] = f_macdWTColors(macdWTColorsTF)
|
||
|
||
// WT Divergences
|
||
[wtFractalTop, wtFractalBot, wtLow_prev, wtBearDiv, wtBullDiv, wtBearDivHidden, wtBullDivHidden] = f_findDivs(wt2, wtDivOBLevel, wtDivOSLevel, true)
|
||
|
||
[wtFractalTop_add, wtFractalBot_add, wtLow_prev_add, wtBearDiv_add, wtBullDiv_add, wtBearDivHidden_add, wtBullDivHidden_add] = f_findDivs(wt2, wtDivOBLevel_add, wtDivOSLevel_add, true)
|
||
[wtFractalTop_nl, wtFractalBot_nl, wtLow_prev_nl, wtBearDiv_nl, wtBullDiv_nl, wtBearDivHidden_nl, wtBullDivHidden_nl] = f_findDivs(wt2, 0, 0, false)
|
||
|
||
wtBearDivHidden_ = showHiddenDiv_nl ? wtBearDivHidden_nl : wtBearDivHidden
|
||
wtBullDivHidden_ = showHiddenDiv_nl ? wtBullDivHidden_nl : wtBullDivHidden
|
||
|
||
wtBearDivColor = wtShowDiv and wtBearDiv or wtShowHiddenDiv and wtBearDivHidden_ ? colorRed : na
|
||
wtBullDivColor = wtShowDiv and wtBullDiv or wtShowHiddenDiv and wtBullDivHidden_ ? colorGreen : na
|
||
|
||
wtBearDivColor_add = wtShowDiv and wtDivOBLevel_addshow and wtBearDiv_add or wtShowHiddenDiv and wtDivOBLevel_addshow and wtBearDivHidden_add ? #9a0202 : na
|
||
wtBullDivColor_add = wtShowDiv and wtDivOBLevel_addshow and wtBullDiv_add or wtShowHiddenDiv and wtDivOBLevel_addshow and wtBullDivHidden_add ? #1b5e20 : na
|
||
|
||
// RSI Divergences
|
||
[rsiFractalTop, rsiFractalBot, rsiLow_prev, rsiBearDiv, rsiBullDiv, rsiBearDivHidden, rsiBullDivHidden] = f_findDivs(rsi, rsiDivOBLevel, rsiDivOSLevel, true)
|
||
[rsiFractalTop_nl, rsiFractalBot_nl, rsiLow_prev_nl, rsiBearDiv_nl, rsiBullDiv_nl, rsiBearDivHidden_nl, rsiBullDivHidden_nl] = f_findDivs(rsi, 0, 0, false)
|
||
|
||
rsiBearDivHidden_ = showHiddenDiv_nl ? rsiBearDivHidden_nl : rsiBearDivHidden
|
||
rsiBullDivHidden_ = showHiddenDiv_nl ? rsiBullDivHidden_nl : rsiBullDivHidden
|
||
|
||
rsiBearDivColor = rsiShowDiv and rsiBearDiv or rsiShowHiddenDiv and rsiBearDivHidden_ ? colorRed : na
|
||
rsiBullDivColor = rsiShowDiv and rsiBullDiv or rsiShowHiddenDiv and rsiBullDivHidden_ ? colorGreen : na
|
||
|
||
// Stoch Divergences
|
||
[stochFractalTop, stochFractalBot, stochLow_prev, stochBearDiv, stochBullDiv, stochBearDivHidden, stochBullDivHidden] = f_findDivs(stochK, 0, 0, false)
|
||
|
||
stochBearDivColor = stochShowDiv and stochBearDiv or stochShowHiddenDiv and stochBearDivHidden ? colorRed : na
|
||
stochBullDivColor = stochShowDiv and stochBullDiv or stochShowHiddenDiv and stochBullDivHidden ? colorGreen : na
|
||
|
||
|
||
// Small Circles WT Cross
|
||
signalColor = wt2 - wt1 > 0 ? color.red : color.lime
|
||
|
||
// Buy signal.
|
||
buySignal = wtCross and wtCrossUp and wtOversold
|
||
|
||
buySignalDiv = wtShowDiv and wtBullDiv or wtShowDiv and wtBullDiv_add or stochShowDiv and stochBullDiv or rsiShowDiv and rsiBullDiv
|
||
|
||
buySignalDiv_color = wtBullDiv ? colorGreen : wtBullDiv_add ? color.new(colorGreen, 100) : rsiShowDiv ? colorGreen : na
|
||
|
||
// Sell signal
|
||
sellSignal = wtCross and wtCrossDown and wtOverbought
|
||
|
||
sellSignalDiv = wtShowDiv and wtBearDiv or wtShowDiv and wtBearDiv_add or stochShowDiv and stochBearDiv or rsiShowDiv and rsiBearDiv
|
||
|
||
sellSignalDiv_color = wtBearDiv ? colorRed : wtBearDiv_add ? color.new(colorRed, 60) : rsiBearDiv ? colorRed : na
|
||
|
||
// Gold Buy
|
||
lastRsi = ta.valuewhen(wtFractalBot, rsi[2], 0)[2]
|
||
wtGoldBuy = (wtShowDiv and wtBullDiv or rsiShowDiv and rsiBullDiv) and wtLow_prev <= osLevel3 and wt2 > osLevel3 and wtLow_prev - wt2 <= -5 and lastRsi < 30
|
||
|
||
// } CALCULATE INDICATORS
|
||
|
||
|
||
// DRAW {
|
||
bgcolor(darkMode ? color.new(#000000, 80) : na, transp=90)
|
||
zLine = plot(0, color=color.new(colorWhite, 50))
|
||
|
||
// MFI BAR
|
||
rsiMfiBarTopLine = plot(rsiMFIShow ? -95 : na, title='MFI Bar TOP Line', transp=100)
|
||
rsiMfiBarBottomLine = plot(rsiMFIShow ? -99 : na, title='MFI Bar BOTTOM Line', transp=50)
|
||
fill(rsiMfiBarTopLine, rsiMfiBarBottomLine, title='MFI Bar Colors', color=rsiMFIColor, transp=75)
|
||
|
||
// WT Areas
|
||
plot(wtShow ? wt1 : na, style=plot.style_area, title='WT Wave 1', color=macdWTColorsShow ? macdWT1Color : colorWT1, transp=0)
|
||
plot(wtShow ? wt2 : na, style=plot.style_area, title='WT Wave 2', color=macdWTColorsShow ? macdWT2Color : darkMode ? colorWT2_ : colorWT2, transp=20)
|
||
|
||
// VWAP
|
||
plot(vwapShow ? wtVwap : na, title='VWAP', color=color.new(colorYellow, 45), style=plot.style_area, linewidth=2)
|
||
|
||
// MFI AREA
|
||
rsiMFIplot = plot(rsiMFIShow ? rsiMFI : na, title='RSI+MFI Area', color=rsiMFIColor, transp=20)
|
||
fill(rsiMFIplot, zLine, rsiMFIColor, transp=40)
|
||
|
||
// WT Div
|
||
|
||
plot(series=wtFractalTop ? wt2[2] : na, title='WT Bearish Divergence', color=wtBearDivColor, linewidth=2, offset=-2)
|
||
plot(series=wtFractalBot ? wt2[2] : na, title='WT Bullish Divergence', color=wtBullDivColor, linewidth=2, offset=-2)
|
||
|
||
// WT 2nd Div
|
||
plot(series=wtFractalTop_add ? wt2[2] : na, title='WT 2nd Bearish Divergence', color=wtBearDivColor_add, linewidth=2, offset=-2)
|
||
plot(series=wtFractalBot_add ? wt2[2] : na, title='WT 2nd Bullish Divergence', color=wtBullDivColor_add, linewidth=2, offset=-2)
|
||
|
||
// RSI
|
||
plot(rsiShow ? rsi : na, title='RSI', color=rsiColor, linewidth=2, transp=25)
|
||
|
||
// RSI Div
|
||
plot(series=rsiFractalTop ? rsi[2] : na, title='RSI Bearish Divergence', color=rsiBearDivColor, linewidth=1, offset=-2)
|
||
plot(series=rsiFractalBot ? rsi[2] : na, title='RSI Bullish Divergence', color=rsiBullDivColor, linewidth=1, offset=-2)
|
||
|
||
// Stochastic RSI
|
||
stochKplot = plot(stochShow ? stochK : na, title='Stoch K', color=color.new(#21baf3, 0), linewidth=2)
|
||
stochDplot = plot(stochShow ? stochD : na, title='Stoch D', color=color.new(#673ab7, 60), linewidth=1)
|
||
stochFillColor = stochK >= stochD ? color.new(#21baf3, 75) : color.new(#673ab7, 60)
|
||
fill(stochKplot, stochDplot, title='KD Fill', color=stochFillColor, transp=90)
|
||
|
||
// Stoch Div
|
||
plot(series=stochFractalTop ? stochK[2] : na, title='Stoch Bearish Divergence', color=stochBearDivColor, linewidth=1, offset=-2)
|
||
plot(series=stochFractalBot ? stochK[2] : na, title='Stoch Bullish Divergence', color=stochBullDivColor, linewidth=1, offset=-2)
|
||
|
||
// Schaff Trend Cycle
|
||
plot(tcLine ? tcVal : na, color=color.new(#673ab7, 25), linewidth=2, title='Schaff Trend Cycle 1')
|
||
plot(tcLine ? tcVal : na, color=color.new(colorWhite, 50), linewidth=1, title='Schaff Trend Cycle 2')
|
||
|
||
|
||
// Draw Overbought & Oversold lines
|
||
plot(obLevel, title='Over Bought Level 1', color=color.new(colorWhite, 11), linewidth=1, style=plot.style_line)
|
||
plot(obLevel2, title='Over Bought Level 2', color=color.new(colorWhite, 85), linewidth=1, style=plot.style_stepline)
|
||
plot(obLevel3, title='Over Bought Level 3', color=color.new(colorWhite, 95), linewidth=1, style=plot.style_circles)
|
||
|
||
plot(osLevel, title='Over Sold Level 1', color=color.new(colorWhite, 11), linewidth=1, style=plot.style_line)
|
||
plot(osLevel2, title='Over Sold Level 2', color=color.new(colorWhite, 85), linewidth=1, style=plot.style_stepline)
|
||
|
||
// Sommi flag
|
||
plotchar(sommiFlagShow and sommiBearish ? 108 : na, title='Sommi bearish flag', char='⚑', color=color.new(colorPink, 0), location=location.absolute, size=size.tiny)
|
||
plotchar(sommiFlagShow and sommiBullish ? -108 : na, title='Sommi bullish flag', char='⚑', color=color.new(colorBluelight, 0), location=location.absolute, size=size.tiny)
|
||
plot(sommiShowVwap ? ta.ema(hvwap, 3) : na, title='Sommi higher VWAP', color=color.new(colorYellow, 15), linewidth=2, style=plot.style_line)
|
||
|
||
// Sommi diamond
|
||
plotchar(sommiDiamondShow and sommiBearishDiamond ? 108 : na, title='Sommi bearish diamond', char='◆', color=color.new(colorPink, 0), location=location.absolute, size=size.tiny)
|
||
plotchar(sommiDiamondShow and sommiBullishDiamond ? -108 : na, title='Sommi bullish diamond', char='◆', color=color.new(colorBluelight, 0), location=location.absolute, size=size.tiny)
|
||
|
||
// Circles
|
||
plot(wtCross ? wt2 : na, title='Buy and sell circle', color=signalColor, style=plot.style_circles, linewidth=3, transp=15)
|
||
|
||
plotchar(wtBuyShow and buySignal ? -107 : na, title='Buy circle', char='·', color=color.new(colorGreen, 10), location=location.absolute, size=size.small)
|
||
plotchar(wtSellShow and sellSignal ? 105 : na, title='Sell circle', char='·', color=color.new(colorRed, 10), location=location.absolute, size=size.small)
|
||
|
||
plotchar(wtDivShow and buySignalDiv ? -106 : na, title='Divergence buy circle', char='•', color=buySignalDiv_color, location=location.absolute, size=size.small, offset=-2, transp=70)
|
||
plotchar(wtDivShow and sellSignalDiv ? 106 : na, title='Divergence sell circle', char='•', color=sellSignalDiv_color, location=location.absolute, size=size.small, offset=-2, transp=70)
|
||
|
||
plotchar(wtGoldBuy and wtGoldShow ? -106 : na, title='Gold buy gold circle', char='•', color=color.new(colorOrange, 60), location=location.absolute, size=size.small, offset=-2)
|
||
|
||
// } DRAW
|
||
|
||
|
||
long = ta.crossover (wt1, wt2) and wt1<osLevel
|
||
// long = wtBullDiv or ta.crossover (wt1, wt2) and wt1<osLevel
|
||
// long = wtBullDiv
|
||
// short= wtBearDiv
|
||
// short= wtBearDiv or ta.crossunder(wt1, wt2) and wt1>obLevel
|
||
short= ta.crossunder(wt1, wt2) and wt1>obLevel
|
||
|
||
// Position Management Tools
|
||
pos = 0.0
|
||
pos:= long? 1 : short? -1 : pos[1]
|
||
|
||
longCond = long and (pos[1]!= 1 or na(pos[1]))
|
||
shortCond = short and (pos[1]!=-1 or na(pos[1]))
|
||
|
||
// EXIT FUNCTIONS //
|
||
i_sl = input.float(0.0, title="Stop Loss % ", minval=0, step=1, inline='sl ')
|
||
i_tp = input.float(0.0, title="Take Profit % ", minval=0, step=1, inline='tp ')
|
||
i_tsl = input.float(0.0, title="Trailing Stop Loss %", minval=0, step=1, inline='tsl')
|
||
|
||
sl = i_sl >0? i_sl /100 : 99999
|
||
tp = i_tp >0? i_tp /100 : 99999
|
||
tsl = i_tsl>0? i_tsl/100 : 99999
|
||
|
||
long_entry = ta.valuewhen(longCond , close, 0)
|
||
short_entry = ta.valuewhen(shortCond, close, 0)
|
||
|
||
// Trailing Stop Loss
|
||
trail_long = 0.0, trail_short = 0.0
|
||
trail_long := longCond? high : high>trail_long[1]? high : pos<1 ? 0 : trail_long[1]
|
||
trail_short := shortCond? low : low<trail_short[1]? low : pos>-1 ? 99999 : trail_short[1]
|
||
trail_long_final = trail_long * (1-tsl)
|
||
trail_short_final = trail_short * (1+tsl)
|
||
|
||
// Simple Stop Loss and Take Profit
|
||
sl_long0 = long_entry * (1 - sl)
|
||
sl_short0 = short_entry * (1 + sl)
|
||
|
||
tp_long = long_entry * (1 + tp)
|
||
tp_short = short_entry * (1 - tp)
|
||
|
||
sl_long = math.max(sl_long0, trail_long_final)
|
||
sl_short = math.min(sl_short0, trail_short_final)
|
||
|
||
// Position Adjustment
|
||
long_sl = low <sl_long[1] and pos[1]==1
|
||
short_sl = high>sl_short[1] and pos[1]==-1
|
||
|
||
final_long_tp = high>tp_long[1] and pos[1]==1
|
||
final_short_tp = low <tp_short[1] and pos[1]==-1
|
||
|
||
if ((long_sl or final_long_tp) and not shortCond) or ((short_sl or final_short_tp) and not longCond)
|
||
pos:=0
|
||
|
||
// Strategy Backtest Limiting Algorithm
|
||
i_startTime = input(defval = timestamp("01 Sep 2002 13:30 +0000"), title = "Backtesting Start Time")
|
||
i_endTime = input(defval = timestamp("30 Sep 2099 19:30 +0000"), title = "Backtesting End Time" )
|
||
timeCond = true
|
||
strategy.initial_capital = 50000
|
||
equity = strategy.initial_capital + strategy.netprofit
|
||
|
||
if equity>0 and timeCond
|
||
if longCond
|
||
strategy.entry("long" , strategy.long )
|
||
if shortCond
|
||
strategy.entry("short", strategy.short)
|
||
|
||
strategy.exit("SL/TP", from_entry = "long" , stop=sl_long , limit=tp_long , comment_profit ='TP', comment_loss='SL')
|
||
strategy.exit("SL/TP", from_entry = "short", stop=sl_short, limit=tp_short, comment_profit ='TP', comment_loss='SL')
|
||
|
||
// ALERTS {
|
||
|
||
// BUY
|
||
alertcondition(longCond, 'Buy (Big green circle)', 'Green circle WaveTrend Oversold')
|
||
alertcondition(buySignalDiv, 'Buy (Big green circle + Div)', 'Buy & WT Bullish Divergence & WT Overbought')
|
||
alertcondition(wtGoldBuy, 'GOLD Buy (Big GOLDEN circle)', 'Green & GOLD circle WaveTrend Overbought')
|
||
alertcondition(sommiBullish or sommiBullishDiamond, 'Sommi bullish flag/diamond', 'Blue flag/diamond')
|
||
alertcondition(wtCross and wtCrossUp, 'Buy (Small green dot)', 'Buy small circle')
|
||
|
||
// SELL
|
||
alertcondition(sommiBearish or sommiBearishDiamond, 'Sommi bearish flag/diamond', 'Purple flag/diamond')
|
||
alertcondition(sellSignal, 'Sell (Big red circle)', 'Red Circle WaveTrend Overbought')
|
||
alertcondition(sellSignalDiv, 'Sell (Big red circle + Div)', 'Buy & WT Bearish Divergence & WT Overbought')
|
||
alertcondition(wtCross and wtCrossDown, 'Sell (Small red dot)', 'Sell small circle')
|
||
|
||
// } ALERTS
|
||
|
||
|
||
```
|
||
|
||
> Detail
|
||
|
||
https://www.fmz.com/strategy/440104
|
||
|
||
> Last Modified
|
||
|
||
2024-01-26 16:16:44
|