
238 lines
16 KiB
Markdown
238 lines
16 KiB
Markdown
|
||
> Name
|
||
|
||
多重均线交叉动量风险比优化策略-Multi-EMA-Crossover-Momentum-Strategy-with-Risk-Reward-Optimization
|
||
|
||
> Author
|
||
|
||
ianzeng123
|
||
|
||
> Strategy Description
|
||
|
||
|
||
|
||
|
||
|
||
|
||
[trans]
|
||
#### 概述
|
||
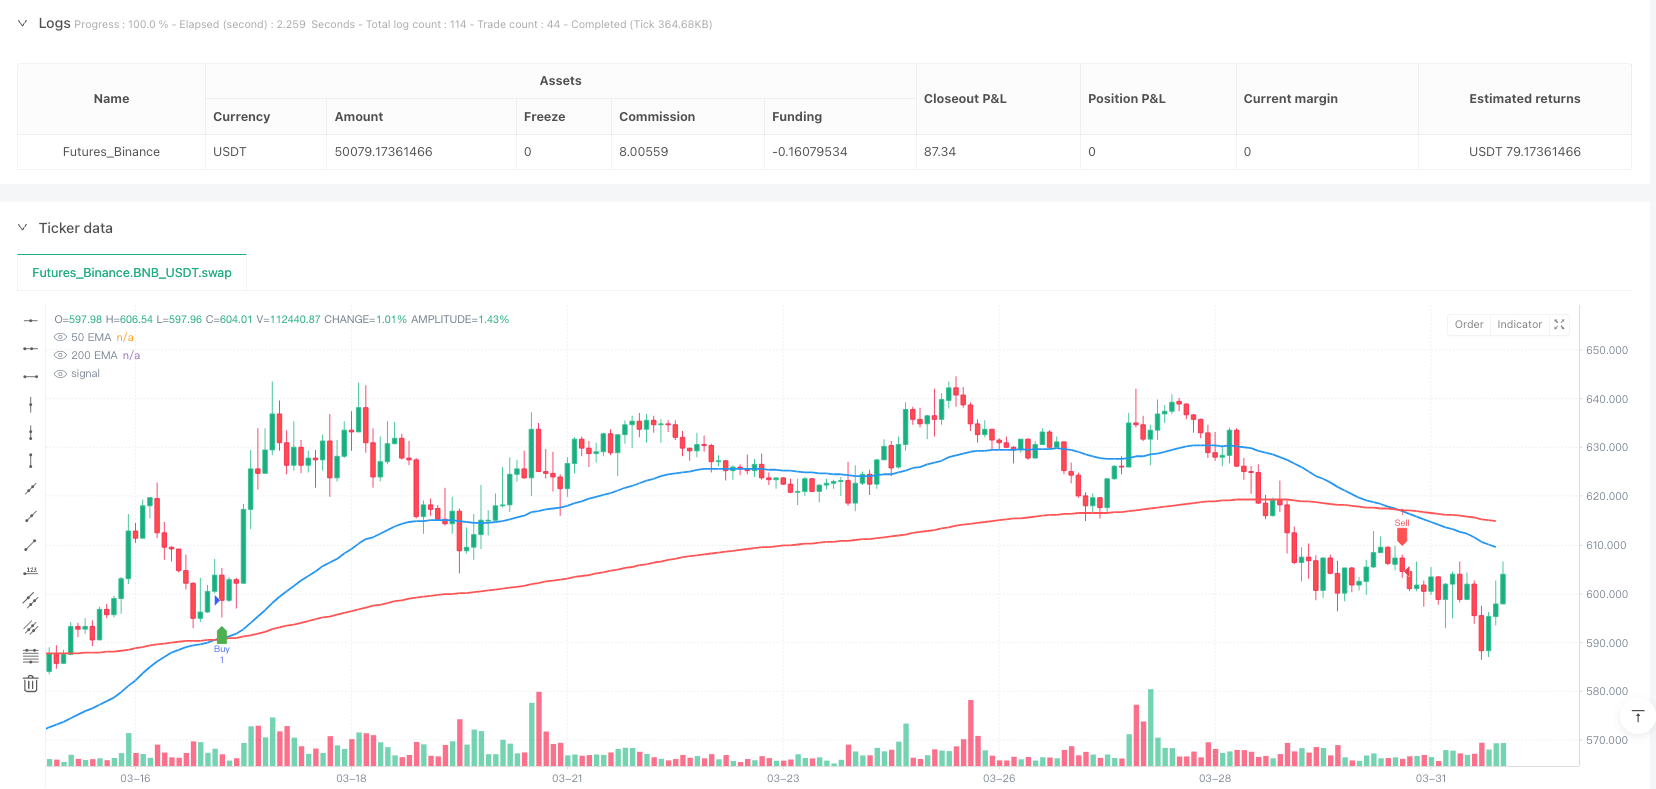
多重均线交叉动量风险比优化策略是一个基于技术分析的量化交易系统,核心逻辑建立在50日和200日指数移动平均线(EMA)的交叉信号基础上。该策略利用黄金交叉(Golden Cross)和死亡交叉(Death Cross)这两个经典技术指标作为主要交易信号,并结合了预设的止损(Stop-Loss)和止盈(Take-Profit)机制,形成了一个完整的风险管理体系。策略设计的核心目标是捕捉中长期趋势变化,同时通过精确的风险回报比设置来优化交易结果。
|
||
|
||
#### 策略原理
|
||
该策略的运作原理基于两个主要的技术分析概念:
|
||
1. 黄金交叉信号:当短期50日EMA向上穿越长期200日EMA时,系统生成买入信号并开仓做多。这一信号通常被视为市场转向上升趋势的确认指标。
|
||
2. 死亡交叉信号:当短期50日EMA向下穿越长期200日EMA时,系统生成卖出信号并开仓做空。这一信号通常被视为市场转向下降趋势的确认指标。
|
||
|
||
关键的是,该策略不仅依赖均线交叉信号进行入场,还实现了完善的止损和止盈机制:
|
||
- 多头仓位的止损设置在入场价格下方1%
|
||
- 多头仓位的止盈设置在风险的2倍位置(基于1:2的默认风险回报比)
|
||
- 空头仓位的止损设置在入场价格上方1%
|
||
- 空头仓位的止盈设置在风险的2倍位置
|
||
|
||
这种风险管理机制确保了即使在错误信号的情况下,亏损也被严格控制在可预见的范围内,同时在正确信号情况下,利润目标则有足够空间兑现。
|
||
|
||
#### 策略优势
|
||
深入分析后,该策略展现出以下显著优势:
|
||
|
||
1. **趋势把握能力**:通过结合长短期均线,策略能够有效识别市场主要趋势的变化点,避免了短期波动带来的虚假信号。
|
||
|
||
2. **自动化风险管理**:策略内置了完善的止损和止盈机制,确保每笔交易都有明确的风险边界和利润目标,减少了人为决策带来的情绪干扰。
|
||
|
||
3. **可定制的风险回报比**:策略允许交易者根据自身风险偏好调整风险回报比率,默认设置为1:2,可根据不同市场环境进行优化。
|
||
|
||
4. **清晰的入场和出场条件**:策略规则明确,没有模糊地带,这有助于保持交易纪律,避免冲动交易。
|
||
|
||
5. **适应不同市场环境**:均线交叉策略在趋势明显的市场中表现出色,同时止损设置也为震荡市场提供了保护。
|
||
|
||
6. **技术指标可视化**:策略集成了均线和信号的图形化显示,帮助交易者直观理解市场状态和策略逻辑。
|
||
|
||
#### 策略风险
|
||
尽管该策略具有诸多优势,但也存在一些需要注意的潜在风险:
|
||
|
||
1. **震荡市场下的频繁交易**:在横盘整理阶段,50日和200日EMA可能会频繁交叉,导致过多的交易信号和"锯齿效应",增加交易成本并可能导致连续小额亏损。
|
||
- 解决方法:可以考虑添加额外的过滤条件,如要求交叉后保持一定时间或幅度才确认信号。
|
||
|
||
2. **固定百分比止损的局限性**:1%的固定止损幅度可能不适合所有市场环境,在波动性较高的市场可能过于紧密,导致被过早触发。
|
||
- 解决方法:考虑使用基于波动率的动态止损设置,如ATR(平均真实波幅)的倍数。
|
||
|
||
3. **趋势转换滞后**:均线交叉是一个滞后指标,当信号出现时,实际的趋势转换可能已经进行了一段时间。
|
||
- 解决方法:引入更灵敏的短期指标作为辅助,提前捕捉趋势变化的迹象。
|
||
|
||
4. **参数敏感性**:策略表现对EMA周期的选择较为敏感,50和200可能不是所有市场环境下的最优选择。
|
||
- 解决方法:通过历史回测优化均线周期参数,或考虑多组均线组合确认。
|
||
|
||
5. **市场极端情况下的风险**:在市场跳空或极端波动情况下,预设的止损可能无法按计划执行。
|
||
- 解决方法:考虑使用保证金管理和仓位规模控制,限制单笔交易的风险敞口。
|
||
|
||
#### 策略优化方向
|
||
基于策略分析,以下是几个可能的优化方向:
|
||
|
||
1. **引入趋势强度过滤器**:
|
||
可以添加ADX(平均方向指数)等指标评估趋势强度,只在趋势明显时执行均线交叉信号,避免在横盘市场中的虚假信号。这样的优化可以显著减少不必要的交易并提高胜率。
|
||
|
||
2. **动态风险管理**:
|
||
将固定百分比的止损改为基于市场波动性的动态止损,例如使用0.5-2倍ATR作为止损距离。这种方法能更好地适应不同市场环境下的价格波动特征。
|
||
|
||
3. **多周期确认**:
|
||
考虑引入多个时间周期的确认机制,例如只有当日线和周线均出现同向均线交叉时才执行交易。这有助于减少假信号并提高交易质量。
|
||
|
||
4. **加入交易量确认**:
|
||
在均线交叉信号出现时,增加交易量异常检测作为辅助确认条件,确保市场有足够的参与度支持新趋势的形成。
|
||
|
||
5. **优化风险回报比**:
|
||
通过历史回测数据分析,为不同市场条件下的交易确定最优风险回报比,而不是使用固定的1:2比例。在某些市场条件下,1:1或1:3可能表现更佳。
|
||
|
||
6. **部分止盈策略**:
|
||
实现分批止盈机制,允许在达到不同利润目标时部分平仓,既保证获利又给予趋势充分发展的空间。
|
||
|
||
#### 总结
|
||
多重均线交叉动量风险比优化策略是一个结合了经典技术分析与现代风险管理的量化交易系统。通过50日和200日EMA的交叉提供趋势方向,同时利用预设的止损和止盈机制控制风险,策略形成了一个纪律严明的交易框架。
|
||
|
||
尽管该策略具有趋势把握能力强、风险管理自动化等优势,但在震荡市场中可能面临假信号增多的挑战。通过引入趋势强度过滤、动态风险管理以及多周期确认等优化手段,可以进一步提升策略的稳健性和适应性。
|
||
|
||
总体而言,这是一个适合中长期投资者的量化策略,特别适用于捕捉主要市场趋势转换点。对于愿意遵循系统化交易规则并注重风险管理的交易者,该策略提供了一个结构清晰、易于执行的量化交易框架。通过持续回测和参数优化,该策略有潜力在不同市场环境下保持稳定表现。
|
||
||
|
||
#### Overview
|
||
The Multi-EMA Crossover Momentum Strategy with Risk-Reward Optimization is a quantitative trading system based on technical analysis, with its core logic built on crossover signals between the 50-day and 200-day Exponential Moving Averages (EMA). This strategy utilizes the classic Golden Cross and Death Cross technical indicators as primary trading signals, combined with preset Stop-Loss and Take-Profit mechanisms to form a comprehensive risk management system. The core objective of the strategy design is to capture medium to long-term trend changes while optimizing trading outcomes through precise risk-reward ratio settings.
|
||
|
||
#### Strategy Principles
|
||
The operating principle of this strategy is based on two main technical analysis concepts:
|
||
1. Golden Cross Signal: When the short-term 50-day EMA crosses above the long-term 200-day EMA, the system generates a buy signal and enters a long position. This signal is typically viewed as confirmation that the market is turning to an upward trend.
|
||
2. Death Cross Signal: When the short-term 50-day EMA crosses below the long-term 200-day EMA, the system generates a sell signal and enters a short position. This signal is typically viewed as confirmation that the market is turning to a downward trend.
|
||
|
||
Crucially, the strategy not only relies on EMA crossovers for entry but also implements a robust stop-loss and take-profit mechanism:
|
||
- Long position stop-loss set at 1% below the entry price
|
||
- Long position take-profit set at 2x the risk (based on the default 1:2 risk-reward ratio)
|
||
- Short position stop-loss set at 1% above the entry price
|
||
- Short position take-profit set at 2x the risk
|
||
|
||
This risk management mechanism ensures that even in the case of false signals, losses are strictly controlled within a predictable range, while in the case of correct signals, profit targets have sufficient room for realization.
|
||
|
||
#### Strategy Advantages
|
||
After in-depth analysis, the strategy demonstrates the following significant advantages:
|
||
|
||
1. **Trend Capture Capability**: By combining long and short-term moving averages, the strategy can effectively identify key trend change points in the market, avoiding false signals caused by short-term fluctuations.
|
||
|
||
2. **Automated Risk Management**: The strategy incorporates comprehensive stop-loss and take-profit mechanisms, ensuring that each trade has clear risk boundaries and profit targets, reducing emotional interference from manual decision-making.
|
||
|
||
3. **Customizable Risk-Reward Ratio**: The strategy allows traders to adjust the risk-reward ratio according to their risk preferences, with the default setting at 1:2, which can be optimized for different market environments.
|
||
|
||
4. **Clear Entry and Exit Conditions**: The strategy rules are explicit with no gray areas, which helps maintain trading discipline and avoid impulsive trading.
|
||
|
||
5. **Adaptability to Different Market Environments**: The EMA crossover strategy performs excellently in trending markets, while the stop-loss settings also provide protection in range-bound markets.
|
||
|
||
6. **Technical Indicator Visualization**: The strategy integrates graphical displays of moving averages and signals, helping traders intuitively understand market conditions and strategy logic.
|
||
|
||
#### Strategy Risks
|
||
Despite its many advantages, the strategy also has some potential risks that need attention:
|
||
|
||
1. **Frequent Trading in Range-Bound Markets**: During consolidation phases, the 50-day and 200-day EMAs may cross frequently, leading to excessive trading signals and a "whipsaw effect," increasing transaction costs and potentially resulting in consecutive small losses.
|
||
- Solution: Consider adding additional filtering conditions, such as requiring the crossover to maintain a certain duration or magnitude before confirming the signal.
|
||
|
||
2. **Limitations of Fixed Percentage Stop-Loss**: The fixed 1% stop-loss range may not be suitable for all market environments; in higher volatility markets, it may be too tight and trigger prematurely.
|
||
- Solution: Consider using volatility-based dynamic stop-loss settings, such as multiples of the Average True Range (ATR).
|
||
|
||
3. **Trend Transition Lag**: EMA crossovers are a lagging indicator; by the time the signal appears, the actual trend transition may have been underway for some time.
|
||
- Solution: Introduce more sensitive short-term indicators as supplements to capture early signs of trend changes.
|
||
|
||
4. **Parameter Sensitivity**: Strategy performance is sensitive to the choice of EMA periods; 50 and 200 may not be optimal choices for all market environments.
|
||
- Solution: Optimize the EMA period parameters through historical backtesting, or consider using multiple sets of moving averages for confirmation.
|
||
|
||
5. **Market Extreme Condition Risks**: In market gap or extreme volatility situations, preset stop-losses may not execute as planned.
|
||
- Solution: Consider using margin management and position size control to limit risk exposure per trade.
|
||
|
||
#### Strategy Optimization Directions
|
||
Based on strategy analysis, here are several possible optimization directions:
|
||
|
||
1. **Introduce Trend Strength Filter**:
|
||
Add indicators such as the Average Directional Index (ADX) to assess trend strength, executing EMA crossover signals only when trends are significant, avoiding false signals in range-bound markets. This optimization can significantly reduce unnecessary trades and improve win rates.
|
||
|
||
2. **Dynamic Risk Management**:
|
||
Change the fixed percentage stop-loss to volatility-based dynamic stop-loss, such as using 0.5-2 times ATR as the stop-loss distance. This method can better adapt to price volatility characteristics in different market environments.
|
||
|
||
3. **Multi-Timeframe Confirmation**:
|
||
Consider introducing multi-timeframe confirmation mechanisms, for example, executing trades only when both daily and weekly charts show aligned EMA crossovers. This helps reduce false signals and improve trade quality.
|
||
|
||
4. **Add Volume Confirmation**:
|
||
When EMA crossover signals appear, add volume anomaly detection as an auxiliary confirmation condition to ensure there is sufficient market participation to support the formation of a new trend.
|
||
|
||
5. **Optimize Risk-Reward Ratio**:
|
||
Determine the optimal risk-reward ratio for trades under different market conditions through historical backtest data analysis, rather than using a fixed 1:2 ratio. In some market conditions, 1:1 or 1:3 may perform better.
|
||
|
||
6. **Partial Take-Profit Strategy**:
|
||
Implement a staged take-profit mechanism, allowing partial position closing when different profit targets are reached, both securing profits and giving trends sufficient space to develop.
|
||
|
||
#### Summary
|
||
The Multi-EMA Crossover Momentum Strategy with Risk-Reward Optimization is a quantitative trading system that combines classic technical analysis with modern risk management. By using the crossover of 50-day and 200-day EMAs to provide trend direction, while utilizing preset stop-loss and take-profit mechanisms to control risk, the strategy forms a disciplined trading framework.
|
||
|
||
Although the strategy has advantages such as strong trend capture capability and automated risk management, it may face challenges of increased false signals in range-bound markets. Through introducing trend strength filters, dynamic risk management, and multi-timeframe confirmation, the strategy's robustness and adaptability can be further enhanced.
|
||
|
||
Overall, this is a quantitative strategy suitable for medium to long-term investors, particularly applicable for capturing major market trend reversal points. For traders willing to follow systematic trading rules and focus on risk management, this strategy provides a clear structured and easy-to-execute quantitative trading framework. Through continuous backtesting and parameter optimization, this strategy has the potential to maintain stable performance across different market environments.
|
||
[/trans]
|
||
|
||
|
||
|
||
> Source (PineScript)
|
||
|
||
``` pinescript
|
||
/*backtest
|
||
start: 2024-06-14 00:00:00
|
||
end: 2025-04-01 00:00:00
|
||
period: 2h
|
||
basePeriod: 2h
|
||
exchanges: [{"eid":"Futures_Binance","currency":"BNB_USDT"}]
|
||
*/
|
||
|
||
//@version=5
|
||
strategy("Golden Cross & Death Cross Strategy with SL & TP", overlay=true)
|
||
|
||
// Define EMAs
|
||
ema50 = ta.ema(close, 50)
|
||
ema200 = ta.ema(close, 200)
|
||
|
||
// Define Golden Cross & Death Cross conditions
|
||
goldenCross = ta.crossover(ema50, ema200) // 50 EMA crosses above 200 EMA
|
||
deathCross = ta.crossunder(ema50, ema200) // 50 EMA crosses below 200 EMA
|
||
|
||
// Risk-Reward Parameters
|
||
riskRewardRatio = 2 // Set desired risk-reward ratio (1:2 by default)
|
||
stopLossPercent = 1 // Set SL as 1% of entry price
|
||
takeProfitPercent = stopLossPercent * riskRewardRatio // TP = 2x SL
|
||
|
||
// Calculate Stop-Loss & Take-Profit
|
||
longStopLoss = close * (1 - stopLossPercent / 100)
|
||
longTakeProfit = close * (1 + takeProfitPercent / 100)
|
||
shortStopLoss = close * (1 + stopLossPercent / 100)
|
||
shortTakeProfit = close * (1 - takeProfitPercent / 100)
|
||
|
||
// Buy Signal (Golden Cross)
|
||
if (goldenCross)
|
||
strategy.entry("Buy", strategy.long)
|
||
strategy.exit("TakeProfit_Long", from_entry="Buy", stop=longStopLoss, limit=longTakeProfit)
|
||
|
||
// Sell Signal (Death Cross)
|
||
if (deathCross)
|
||
strategy.entry("Sell", strategy.short)
|
||
strategy.exit("TakeProfit_Short", from_entry="Sell", stop=shortStopLoss, limit=shortTakeProfit)
|
||
|
||
// Plot EMAs
|
||
plot(ema50, title="50 EMA", color=color.blue, linewidth=2)
|
||
plot(ema200, title="200 EMA", color=color.red, linewidth=2)
|
||
|
||
// Plot Buy & Sell signals
|
||
plotshape(series=goldenCross, location=location.belowbar, color=color.green, style=shape.labelup, title="Golden Cross")
|
||
plotshape(series=deathCross, location=location.abovebar, color=color.red, style=shape.labeldown, title="Death Cross")
|
||
|
||
// Set Alerts
|
||
alertcondition(goldenCross, title="Golden Cross Alert", message="Golden Cross: Buy Signal!")
|
||
alertcondition(deathCross, title="Death Cross Alert", message="Death Cross: Sell Signal!")
|
||
```
|
||
|
||
> Detail
|
||
|
||
https://www.fmz.com/strategy/489154
|
||
|
||
> Last Modified
|
||
|
||
2025-04-02 11:19:50
|