
201 lines
7.4 KiB
Markdown
201 lines
7.4 KiB
Markdown
|
||
> Name
|
||
|
||
基于EMA指标的趋势跟踪策略EMA-Crossover-Trend-Following-Strategy
|
||
|
||
> Author
|
||
|
||
ChaoZhang
|
||
|
||
> Strategy Description
|
||
|
||
|
||
[trans]
|
||
|
||
## 概述
|
||
|
||
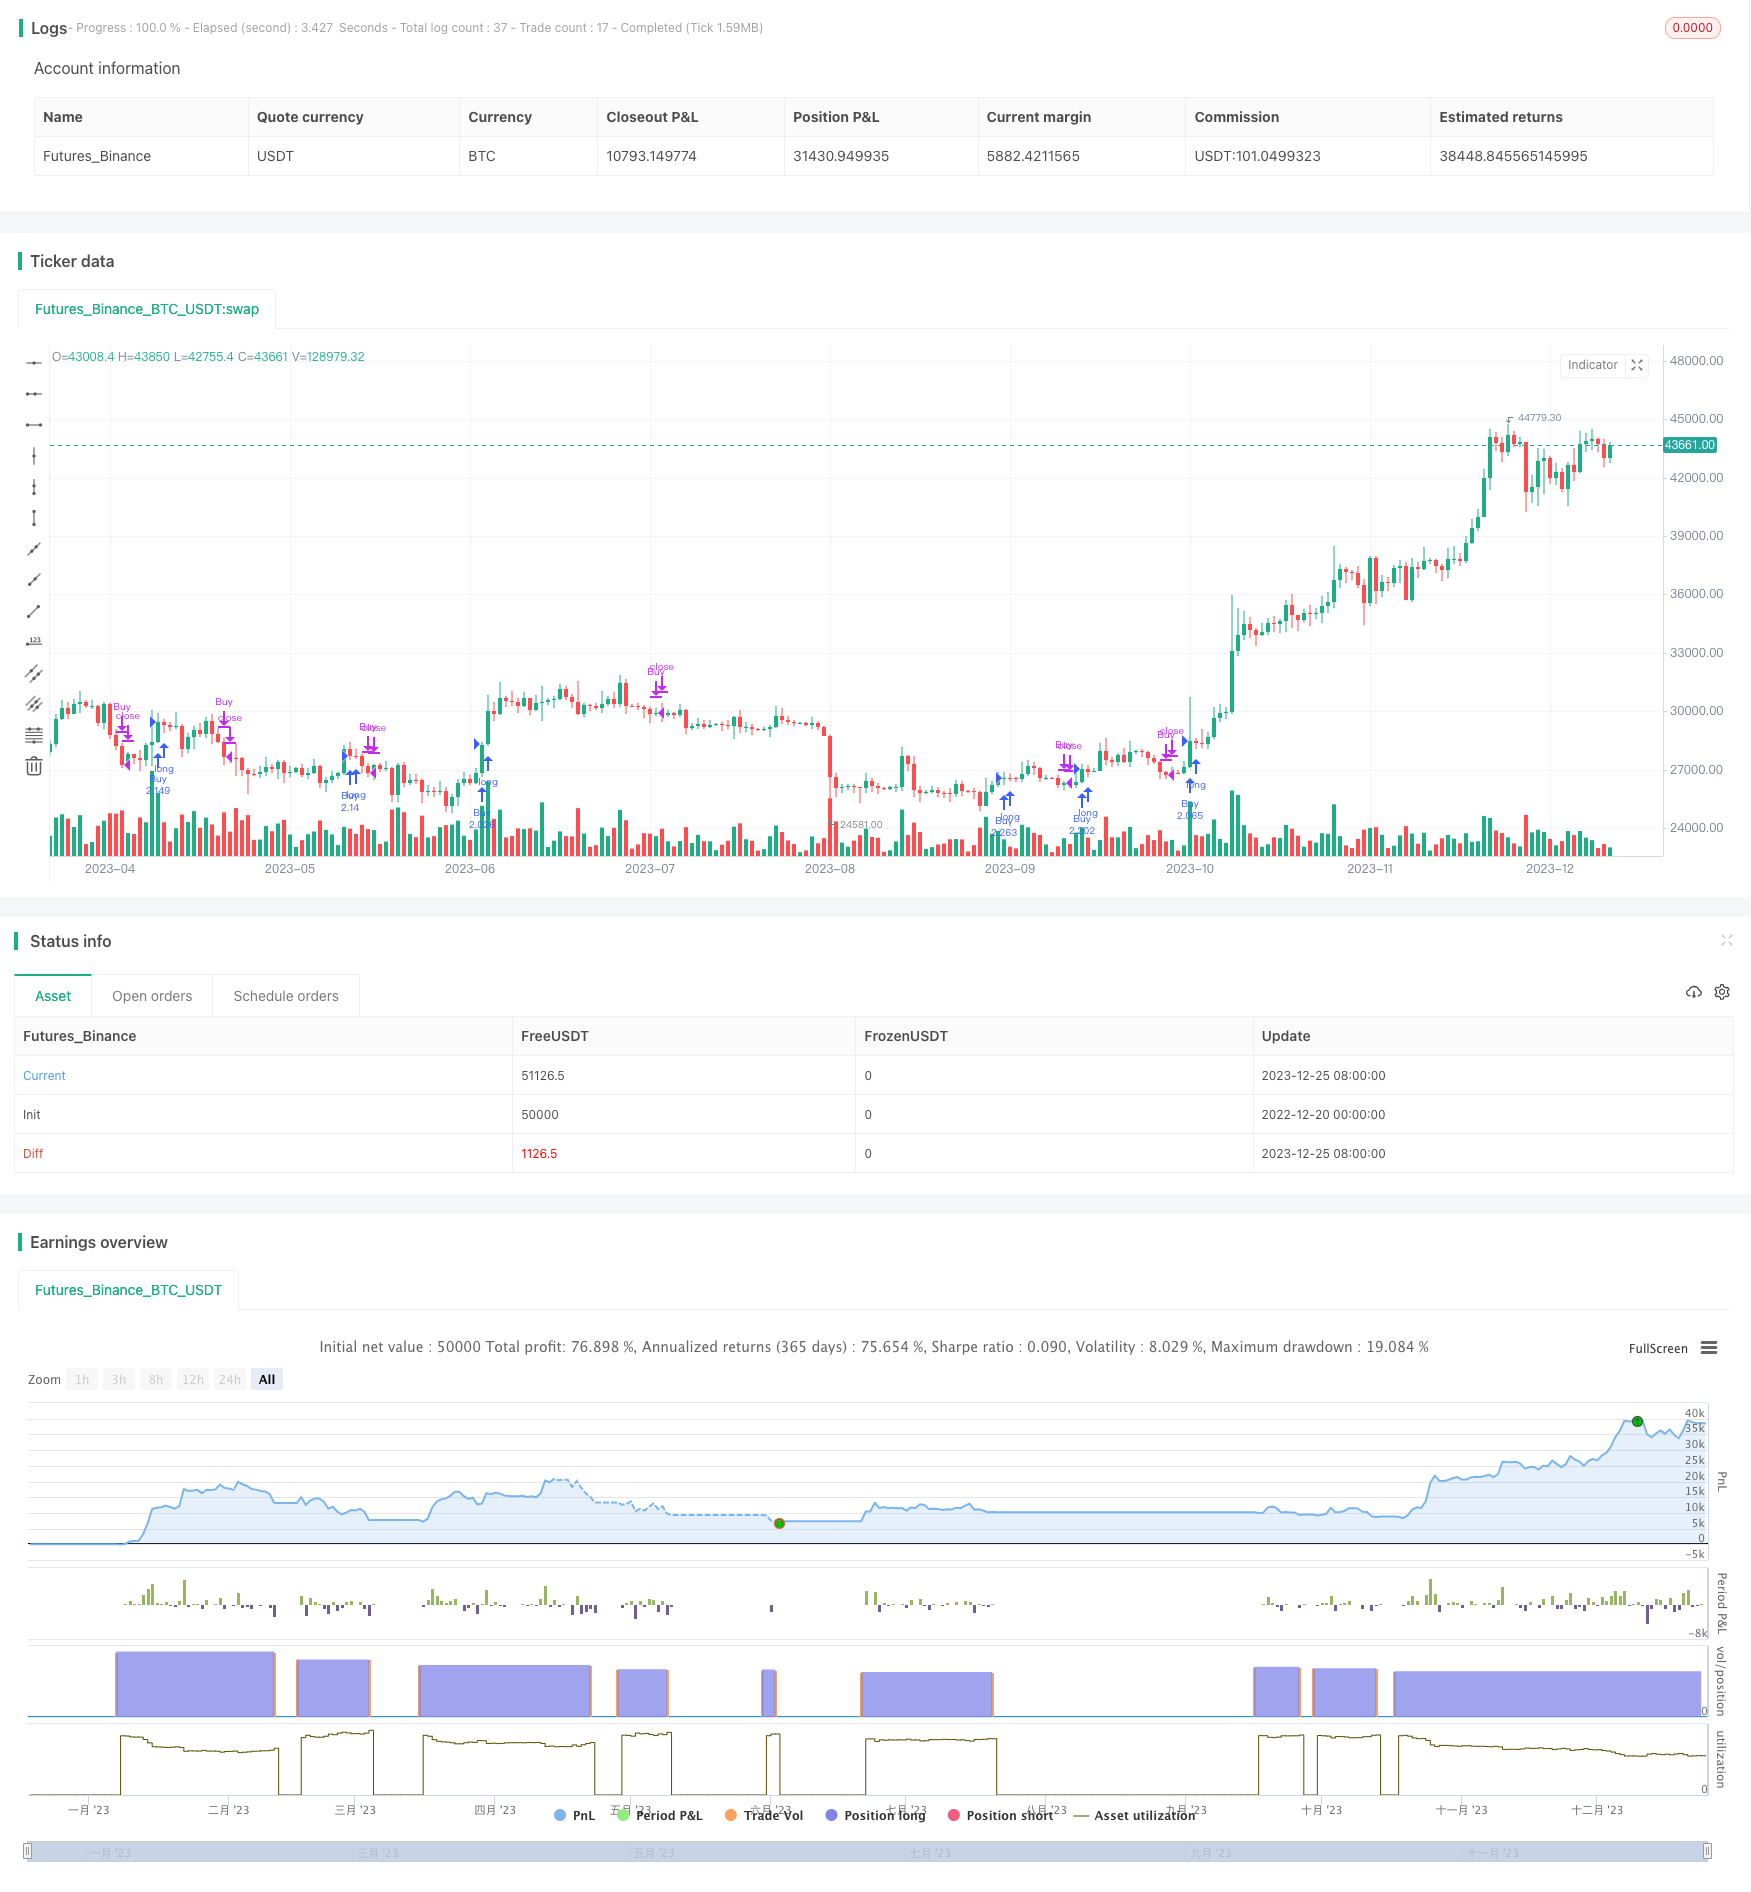
该策略采用EMA快慢线交叉的方式,实现对价格趋势的跟踪。当快线从下方上穿慢线时,做多;当快线从上方下穿慢线时,平仓。该策略主要适用于趋势较明显的品种,能够有效跟踪趋势,获得超额收益。
|
||
|
||
## 策略原理
|
||
|
||
该策略的核心指标为EMA均线。EMA均线的计算公式为:
|
||
|
||
EMA(t)=C(t)×2/(n+1)+EMA(t-1)×(n-1)/(n+1)
|
||
|
||
其中,t为当前时刻,C(t)为当前行情收盘价,n为参数N的值。 such that EMA是一种带有加权因子的移动平均线技术指标。EMA赋予了最新价格更高的权重,这样可以更快速地反应最新价格变动。
|
||
|
||
该策略构建快速EMA均线和慢速EMA均线,以快速线上穿慢速线为买入信号,快速线下穿慢速线为卖出信号。当快速线上穿时,表示价格开始新一轮的上涨;当快速线下穿时,表示价格上涨趋势结束,开始回调下跌。
|
||
|
||
## 优势分析
|
||
|
||
该策略具有如下优势:
|
||
|
||
1. 策略思路清晰,容易理解和实现;
|
||
2. 利用EMA这个简单实用的技术指标,对价格趋势进行判断,避免错过主要趋势机会;
|
||
3. 策略参数较少,主要依赖快慢EMA均线,方便调整优化;
|
||
4. 买入后能够跟踪上涨趋势,及时获利;
|
||
5. 卖出后能够避开价格回调,减少风险;
|
||
6. 回测数据充足,可靠性较高。
|
||
|
||
## 风险分析
|
||
|
||
该策略的主要风险有:
|
||
|
||
1. EMA均线发出假信号的概率较大,可能导致亏损;
|
||
2. 行情震荡时,EMA均线容易互相穿越,产生频繁交易信号;
|
||
3. 突发事件导致快速断头方向改变,无法及时止损;
|
||
4. PARAMETERS优化空间有限,实际表现可能弱于回测结果。
|
||
|
||
为降低上述风险,可采取如下优化措施:
|
||
|
||
1. 结合其他指标进行filtered,避免假信号;
|
||
2. 调整参数,减少信号频繁;
|
||
3. 增加止损策略,控制单笔损失;
|
||
4. 测试不同时间周期参数,寻找最优参数。
|
||
|
||
|
||
## 优化方向
|
||
|
||
该策略可从以下几个方面进行优化:
|
||
|
||
1. 多时间周期合成指标。例如配合周线或月线判断大趋势方向;
|
||
2. 增加filter条件避免假突破。例如成交量,布林带等;
|
||
3. 动态调整参数。使参数可根据行情实时变化;
|
||
4. 结合其他指标构建模型。例如网格、回归等算法模型。
|
||
|
||
## 总结
|
||
|
||
该策略总体来说是一种较为简单实用的趋势跟踪策略。它利用EMA均线判断价格趋势,操作逻辑清晰,易于实现。优点是参数调整简单,能够有效跟踪趋势;缺点是容易发出假信号,实际表现可能弱于回测。下一步可从引入filter条件、动态调参、模型构建等方面进行优化,使策略更加稳定可靠。
|
||
|
||
||
|
||
|
||
## Overview
|
||
|
||
This strategy adopts EMA crossover to track price trends. It goes long when the fast EMA crosses above the slow EMA, and closes position when the fast EMA crosses below the slow EMA. Mainly suitable for products with obvious trends, effectively following trends and gaining excess returns.
|
||
|
||
## Strategy Logic
|
||
|
||
The core indicator of this strategy is EMA. The EMA formula is:
|
||
|
||
EMA(t)=C(t)×2/(n+1)+EMA(t-1)×(n-1)/(n+1)
|
||
|
||
Where t is the current tick, C(t) is the current closing price, and n is the N parameter value. EMA is a moving average technique with a weighted factor, assigning more weight to recent prices, thus reacting faster to the latest price changes.
|
||
|
||
The strategy constructs fast and slow EMAs and takes fast EMA crossing above slow EMA as the buy signal, and fast EMA crossing below slow EMA as the sell signal. The fast EMA crossing above indicates the start of a new round of rise, while fast EMA crossing below indicates the end of the upside trend and the start of a pullback.
|
||
|
||
## Advantage Analysis
|
||
|
||
The advantages of this strategy are:
|
||
|
||
1. The logic is simple and easy to understand and implement;
|
||
2. Utilize the simple and practical EMA to judge price trends, avoiding missing major trends;
|
||
3. Few parameters to adjust and optimize, mainly relying on fast and slow EMAs;
|
||
4. Able to follow upside trends after buying;
|
||
5. Able to avoid pullbacks after selling, mitigating risks;
|
||
6. Sufficient backtest data with high reliability.
|
||
|
||
## Risk Analysis
|
||
|
||
The main risks are:
|
||
|
||
1. High probability of false signals from EMA;
|
||
2. Frequent signal when market is ranging as EMAs easily crossover;
|
||
3. Unable to timely stop loss when sudden events cause sharp direction change;
|
||
4. Limited optimization space that actual performance may underperform backtest results.
|
||
|
||
To reduce the above risks, the following optimizing measures can be adopted:
|
||
|
||
1. Adding filter conditions with other indicators to avoid false signals;
|
||
2. Adjusting parameters to reduce signal frequency;
|
||
3. Adding stop loss strategy to control single loss;
|
||
4. Testing different time period parameters to find the optimum.
|
||
|
||
## Optimization Directions
|
||
|
||
The strategy can be optimized from the following aspects:
|
||
|
||
1. Composite indicators across multiple timeframes, e.g. combining weekly or monthly trends;
|
||
2. Adding filter conditions to avoid false breakout, e.g. volume, Bollinger Bands etc;
|
||
3. Dynamic adjustment of parameters according to real-time market changes;
|
||
4. Incorporating other indicators to build models, e.g. grid, regression algorithms.
|
||
|
||
## Summary
|
||
|
||
In summary, this is a simple and practical trend following strategy utilizing EMA to judge price trends. The logic is clear and easy to implement. The advantages lie in the simplicity to adjust parameters and effectively follow trends. The disadvantages are prone to false signals and actual performance may underperform backtests. Next steps of optimization can focus on adding filters, dynamic parameters, model building to make the strategy more robust.
|
||
|
||
[/trans]
|
||
|
||
> Strategy Arguments
|
||
|
||
|
||
|
||
|Argument|Default|Description|
|
||
|----|----|----|
|
||
|v_input_1|timestamp(01 Jan 2020 00:00 +0000)|開始時間|
|
||
|v_input_2|timestamp(31 Dec 2050 23:59 +0000)|結束時間|
|
||
|v_input_3|5|Fast EMA Length|
|
||
|v_input_4|20|Slow EMA Length|
|
||
|
||
|
||
> Source (PineScript)
|
||
|
||
``` pinescript
|
||
/*backtest
|
||
start: 2022-12-20 00:00:00
|
||
end: 2023-12-26 00:00:00
|
||
period: 1d
|
||
basePeriod: 1h
|
||
exchanges: [{"eid":"Futures_Binance","currency":"BTC_USDT"}]
|
||
*/
|
||
|
||
//@version=4
|
||
strategy("EMA交叉策略by GPT",
|
||
format = format.inherit,
|
||
overlay = true,
|
||
default_qty_type= strategy.percent_of_equity,
|
||
default_qty_value = 100,
|
||
currency = currency.USD,
|
||
initial_capital = 1000000)
|
||
|
||
|
||
// 定義回測交易開始和結束時間的變數
|
||
start_time = input(title="開始時間", type=input.time, defval=timestamp("01 Jan 2020 00:00 +0000"))
|
||
end_time = input(title="結束時間", type=input.time, defval=timestamp("31 Dec 2050 23:59 +0000"))
|
||
|
||
|
||
// 判斷是否在回測交易時間範圍內
|
||
in_range = true
|
||
|
||
|
||
// Define input variables
|
||
fast_length = input(title="Fast EMA Length", type=input.integer, defval=5)
|
||
slow_length = input(title="Slow EMA Length", type=input.integer, defval=20)
|
||
|
||
|
||
// Define EMAs
|
||
fast_ema = ema(close, fast_length)
|
||
slow_ema = ema(close, slow_length)
|
||
|
||
|
||
// Define buy and sell signals
|
||
buy_signal = crossover(fast_ema, slow_ema)
|
||
sell_signal = crossunder(fast_ema, slow_ema)
|
||
|
||
|
||
// Buy signal
|
||
if in_range and buy_signal
|
||
strategy.entry("Buy", strategy.long, when=in_range)
|
||
|
||
// Sell signal
|
||
if in_range and sell_signal
|
||
strategy.close("Buy", when=sell_signal)
|
||
```
|
||
|
||
> Detail
|
||
|
||
https://www.fmz.com/strategy/436779
|
||
|
||
> Last Modified
|
||
|
||
2023-12-27 16:31:15
|