
7.8 KiB
Name
动量反转趋势跟踪策略Momentum-Reversal-Trend-Tracking-Strategy
Author
ChaoZhang
Strategy Description
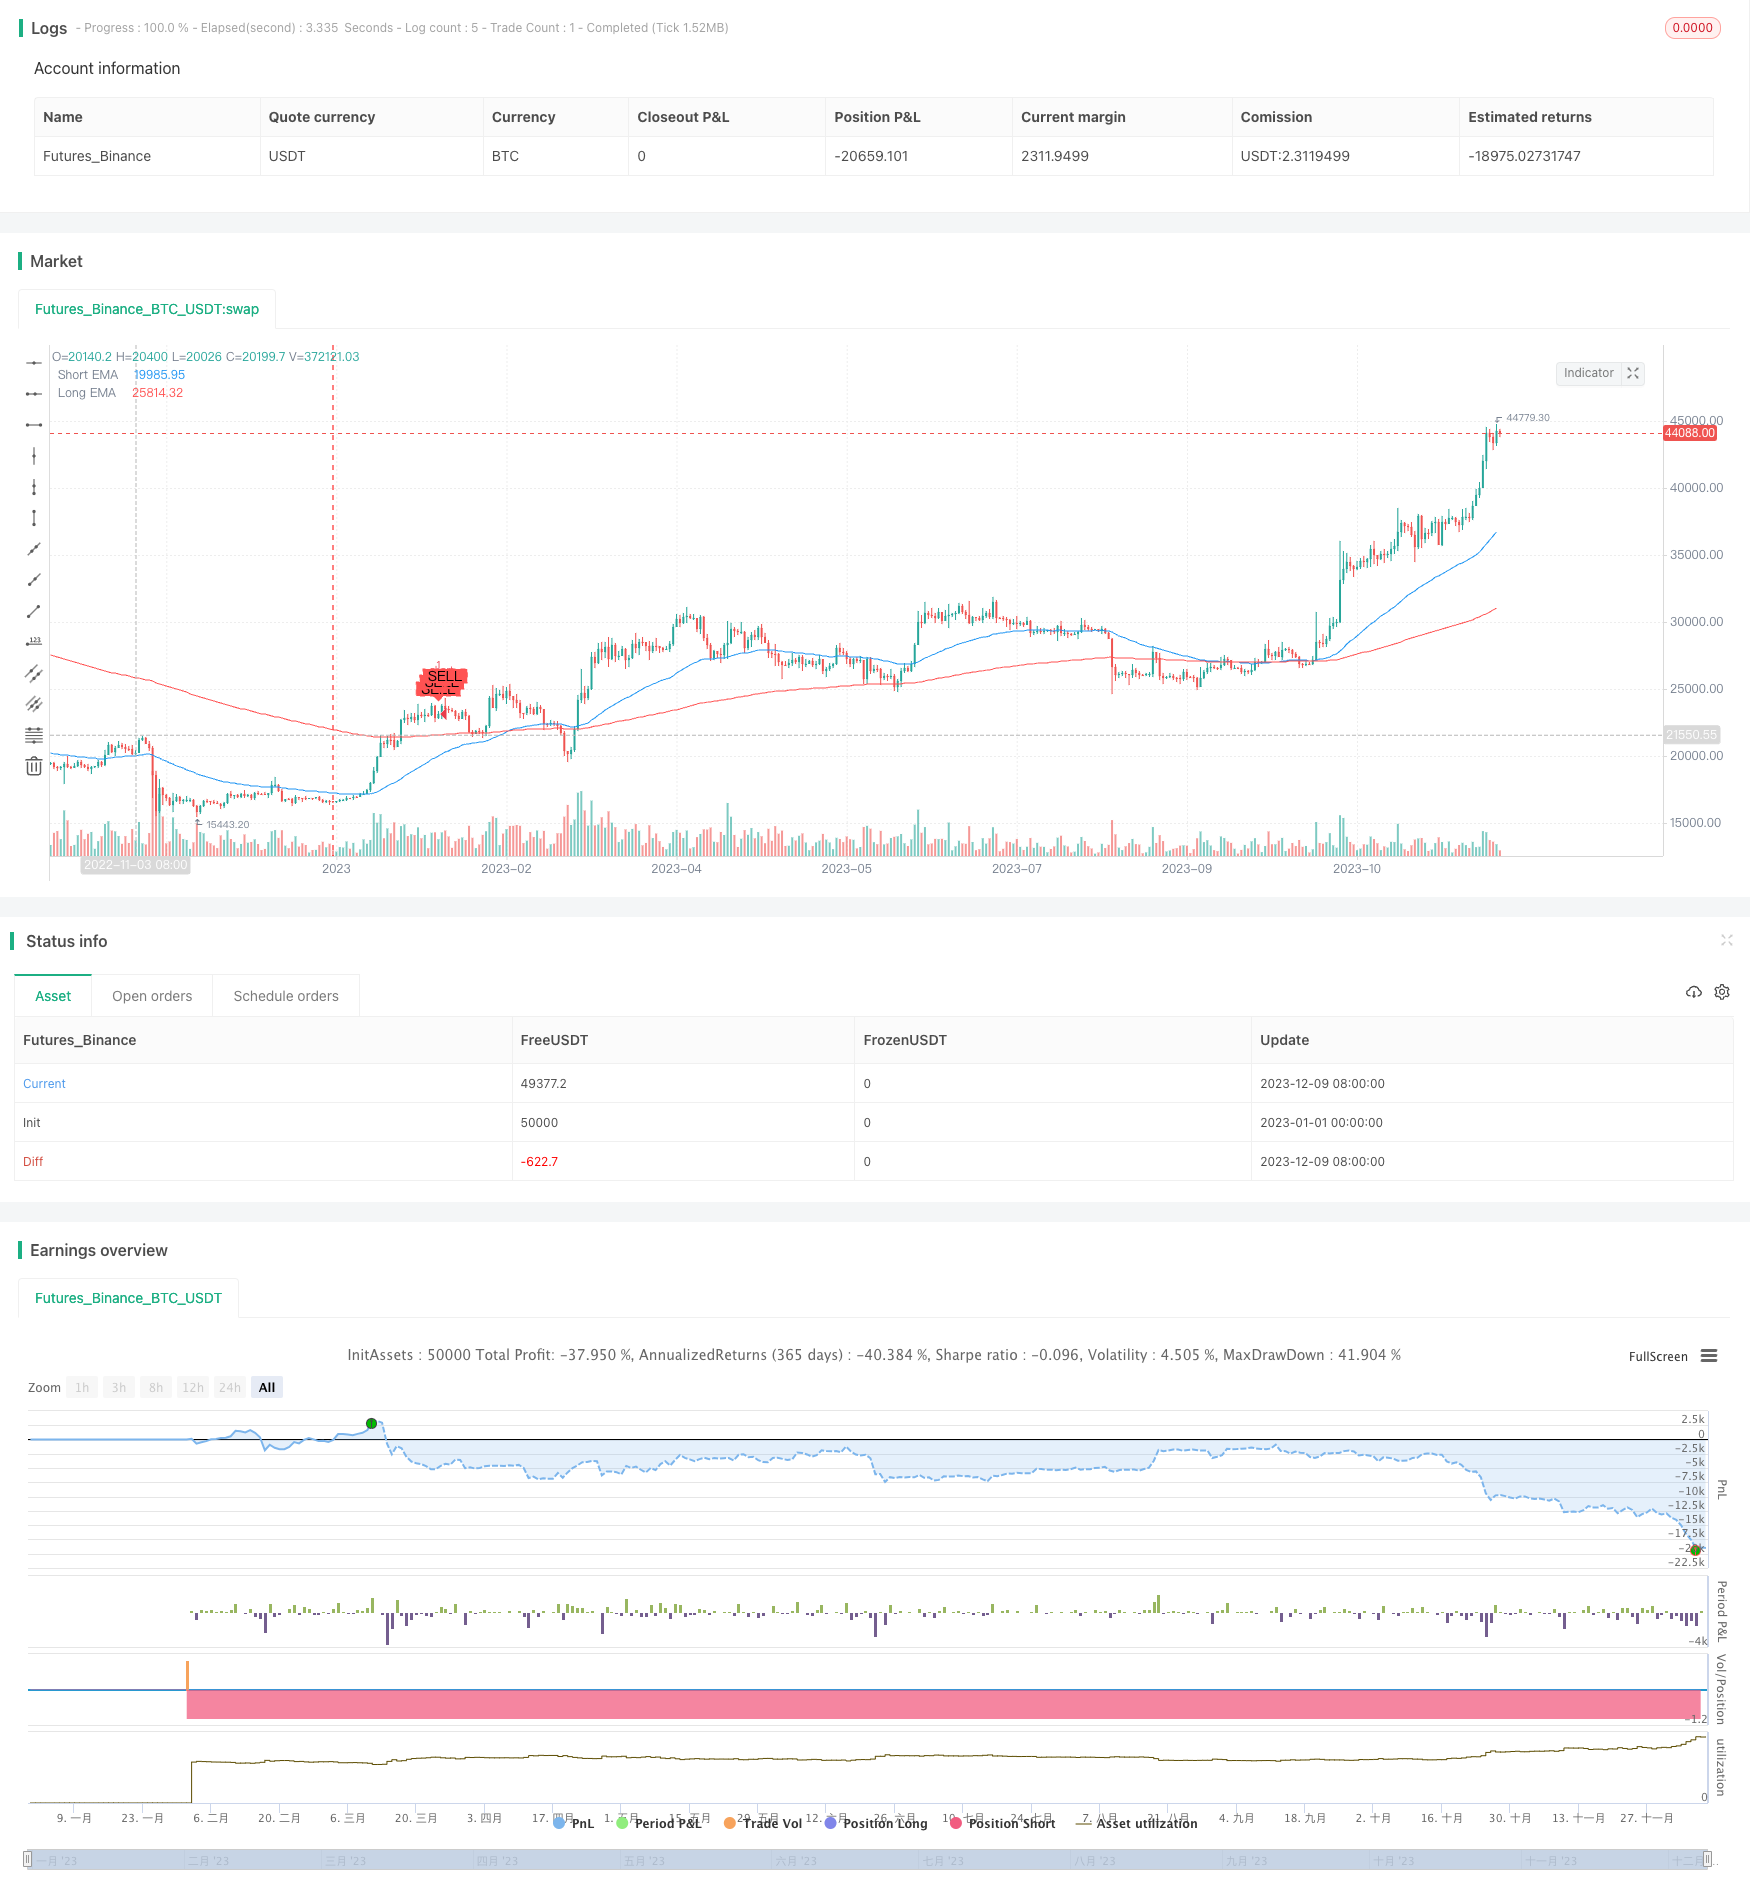 [trans]
概述
本策略通过结合移动平均线、相对强度指数(RSI)、波动带和MACD多个指标,实现了一个可以跟踪市场趋势的动量反转策略。该策略可以自动识别买入和卖出信号。
策略原理
本策略使用两个移动平均线,其中50周期均线代表短期趋势,200周期均线代表长期趋势。当50周期线高于200周期线时,表示目前处于短线上涨的多头市场;反之,50周期线低于200周期线时,表示目前处于空头市场。
Relative Strength Index(RSI)指标用于判断市场是否处于超买超卖状态。当RSI低于30时,表示已经超卖;当高于70时,表示已经超买。本策略以30和70作为超买超卖的阈值。
Bollinger Bands用于判断价格是否处于波动带上下轨附近,从而判断价格波动是否过大。当价格接近上轨时,表示可能要形成短期调整;当接近下轨时,表示可能形成反弹。
MACD指标用于判断市场趋势的变化。当MACD的快线上穿慢线时,表示市场趋势由跌转涨;反之则表示市场趋势由涨转跌。
综合多个指标,本策略的买入信号是:50日均线上穿200日均线,RSI低于30超卖,价格接近下轨,MACD金叉。满足这些条件时,表示市场可能由空头转为多头,形成反弹行情,因此采取做多操作。
卖出信号与买入信号所依据的判断相反,即空头行情,超买状况,价格接近上轨,MACD死叉等。此时做空以获利了结头寸。
优势分析
本策略结合趋势判断和反转信号,既可以跟踪趋势又可以捕捉反转机会。使用多个指标进行组合,可以提高信号的可靠性,避免由于单一指标造成的假信号。通过动量指标的判断,也可以及时捕捉市场反转时点。
相比单一使用移动平均线等趋势跟踪策略,本策略加入了超买超卖判断,可以避免在历史高位附近追高或者在历史低位附近追低,从而控制了风险。
风险分析
本策略主要风险在于多个指标发出的信号可能存在时间差,因此在平仓的时机把握可能不当,从而导致亏损放大。此外,反转信号只能判断可能反转的时机,不能保证反转一定成立或反转力度足够。
为降低风险,可以适当调整各个参数,确保多个指标能尽量同步发出信号。此外也可以设置止损来控制最大损失。在反转后,也需要及时评估形态以确保反转的可靠性。
优化方向
本策略可以从以下几个方面进行优化:
-
调整移动平均线、RSI和MACD的参数,使得它们能更加同步地给出信号。
-
加入止损逻辑,在损失超过限定值后主动停损。
-
评估布林带作为辅助指标的效果,也可以测试KD、WR等其他反转指标的效果。
-
增加机器学习算法,使用历史数据训练判断买入卖出时机的模型。
-
结合互联网情绪指标等非定量因素提供更多参考依据。
总结
本策略综合运用了多种技术分析工具判断市场的趋势和反转点。它融合了趋势跟踪和反转交易的优点,既可跟踪长线趋势又可捕捉短线机会。该策略参数设定合理、风险可控,有望取得较好的收益。如果进一步优化和改进,本策略的实盘表现还可望得到提升。
||
Overview
This strategy combines moving averages, Relative Strength Index (RSI), Bollinger Bands and MACD indicators to implement a momentum reversal strategy that can track market trends. It can automatically identify buy and sell signals.
Principles
The strategy uses two moving averages - 50 periods for the short term trend and 200 periods for the long term trend. When the 50-period MA is above the 200-period one, it indicates an upward trending bull market. When below, it signals a bear market.
The Relative Strength Index (RSI) identifies overbought/oversold conditions. Below 30 is oversold while above 70 is overbought. This strategy uses 30/70 as thresholds.
Bollinger Bands judge if prices are near the upper/lower bands, indicating excessive volatility. Prices near the upper band may see short term reversal while lower band may see bounce.
MACD signals momentum changes. MACD line crossing above signal line indicates uptrend while crossing below indicates downtrend.
Buy signals require the 50-day MA to cross above 200-day MA, RSI below 30 oversold level, price near the lower Bollinger Band and a MACD bullish crossover - indicating reversal from bear to bull market.
Sell signals are the opposite - bear trend, overbought levels, approaching upper band and MACD death cross, prompting short positions.
Advantages
This strategy combines trend tracking and reversal signals, allowing it to follow trends and capture reversals. Using multiple indicators improves reliability and avoids false signals. Judging momentum changes allows timely reversal spotting.
Compared to pure trend following strategies, overbought/oversold measures avoid buying high or selling low. Risk is thus contained.
Risk Analysis
The main risk is signal time lag across indicators, causing inappropriate exit timing and magnified losses. Reversal signals only suggest probability without guarantee of success or sufficiency.
Fine tuning parameters to sync indicators can mitigate this issue. Stop loss controls maximum loss. Post-reversal pattern assessment ensures validity too.
Enhancement Opportunities
Some enhancement ideas:
-
Adjust parameters for better signal synchronization
-
Incorporate stop loss logic to exit positions crossing loss limits
-
Evaluate Bollinger Bands' effectiveness and test other oscillators like KD and WR
-
Add machine learning model trained on historical data to determine entry/exit timing
-
Incorporate sentiment indicators for more reference
Conclusion
This strategy leverages multiple technical analysis tools to determine market trends and reversals. Combining trend following and reversal trading allows riding long term moves while capturing short term swings. With reasonable parameters and risks in place, it promises good profits. Further optimizations can potentially improve live performance.
[/trans]
Source (PineScript)
//@version=5
strategy("Forex and Crypto Trading Strategy", overlay=true)

// Parameters
short_ema_length = 50
long_ema_length = 200
rsi_length = 14
rsi_overbought = 70
rsi_oversold = 30
bb_length = 20
macd_fast_length = 12
macd_slow_length = 26
macd_signal_smoothing = 9

// Moving Averages
short_ema = ta.ema(close, short_ema_length)
long_ema = ta.ema(close, long_ema_length)
plot(short_ema, color=color.blue, title="Short EMA")
plot(long_ema, color=color.red, title="Long EMA")

// RSI
rsi = ta.rsi(close, rsi_length)

// Bollinger Bands
[bb_upper, bb_middle, bb_lower] = ta.bb(close, bb_length, 2)

// MACD
[macd_line, signal_line, _] = ta.macd(close, macd_fast_length, macd_slow_length, macd_signal_smoothing)

// Buy and Sell Conditions
buy_condition = short_ema > long_ema and rsi < rsi_oversold and close < bb_lower and macd_line > signal_line
sell_condition = short_ema < long_ema and rsi > rsi_overbought and close > bb_upper and macd_line < signal_line

// Plotting Buy and Sell Signals
plotshape(series=buy_condition, title="Buy Signal", location=location.belowbar, color=color.green, style=shape.labelup, text="BUY")
plotshape(series=sell_condition, title="Sell Signal", location=location.abovebar, color=color.red, style=shape.labeldown, text="SELL")

// Strategy Execution
strategy.entry("Buy", strategy.long, when=buy_condition)
strategy.close("Buy", when=sell_condition)
strategy.entry("Sell", strategy.short, when=sell_condition)
strategy.close("Sell", when=buy_condition)
Detail
https://www.fmz.com/strategy/434970
Last Modified
2023-12-11 13:45:55