
270 lines
12 KiB
Markdown
270 lines
12 KiB
Markdown
|
||
> Name
|
||
|
||
优势均线突破趋势跟踪系统Advantage-Moving-Average-Breakout-Trend-Following-System
|
||
|
||
> Author
|
||
|
||
ChaoZhang
|
||
|
||
> Strategy Description
|
||
|
||
|
||
[trans]
|
||
|
||
## 概述
|
||
|
||
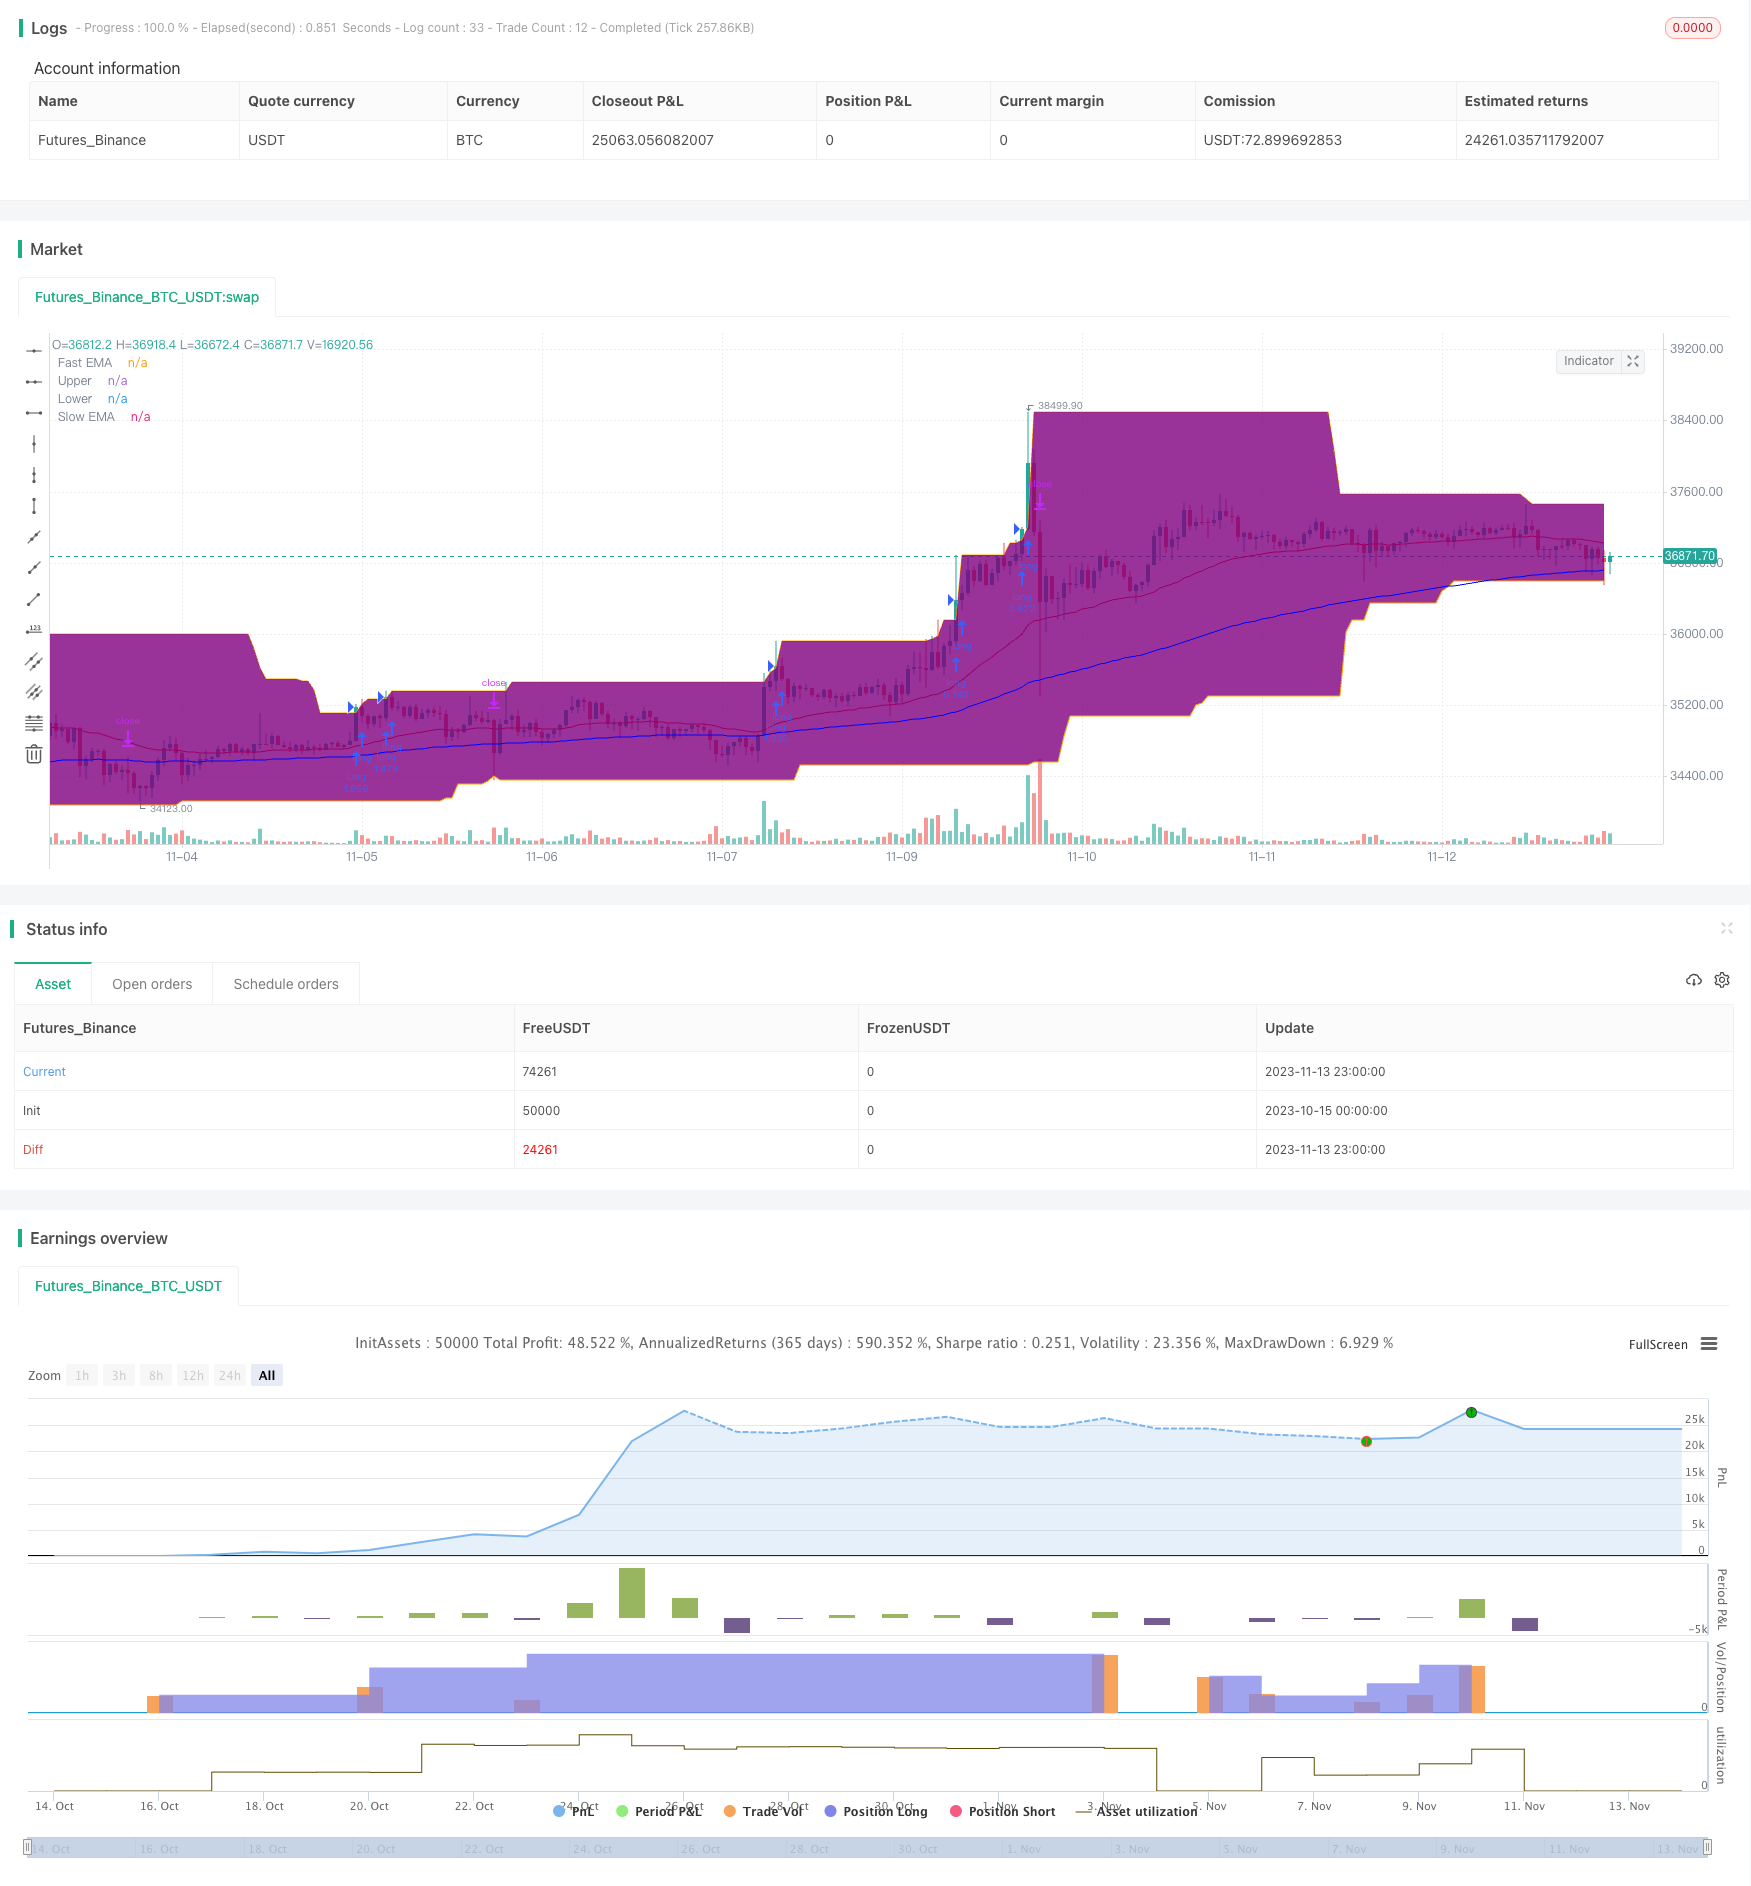
本策略是一种经典的趋势跟踪系统。它利用移动平均线的金叉死叉来判断趋势方向,并在突破唐奇安通道时入场。唐奇安通道的参数设置为50日,可有效过滤掉短期市场噪音。移动平均线设置为40日和120日的指数移动平均线,可以更好地捕捉中长线趋势。止损点设置为价格之下的4倍ATR,可有效控制个别交易的损失。
|
||
|
||
## 策略原理
|
||
|
||
该策略主要基于以下几个要点:
|
||
|
||
1. 使用40日和120日的指数移动平均线构建趋势判断指标。当快线从下方上穿慢线时,为金叉信号,表明进入上涨趋势;当快线从上方下穿慢线时,为死叉信号,表明进入下跌趋势。
|
||
|
||
2. 唐奇安通道参数设置为50日,过滤市场短期波动。只有当价格突破上轨时才做多,突破下轨时才做空,避免被套。
|
||
|
||
3. 止损点设置为价格之下的4倍ATR。ATR可有效衡量市场波动度和风险,设置止损为其一定倍数可以控制单笔交易的损失。
|
||
|
||
4. 指数移动平均线更符合当前价格趋势,而简单移动平均线过于平滑。
|
||
|
||
5. 50日通道期限与40、120日均线配合使用,能够有效过滤假突破。
|
||
|
||
## 优势分析
|
||
|
||
该策略具有以下优势:
|
||
|
||
1. 移动平均线组合可以有效判断市场趋势方向。40日均线可捕捉短期趋势,120日均线可判断中长线趋势。
|
||
|
||
2. 唐奇安通道过滤噪音,避免追高杀跌。只有价格突破通道才入场,可以有效避免交易市场中间的震荡区域。
|
||
|
||
3. 止损点设定合理,可以控制单笔交易损失,避免爆仓。单笔损失控制则可以保证盈利的可持续性。
|
||
|
||
4. 指数移动平均线更符合价格变化趋势,系统的持仓时间可以更长,符合趋势交易思路。
|
||
|
||
5. 移动平均线参数选取兼顾了捕捉趋势的灵敏度和过滤噪音的稳定性。
|
||
|
||
## 风险分析
|
||
|
||
该策略也存在一些风险:
|
||
|
||
1. 长期持仓带来的风险:本策略属于趋势跟踪策略,当出现长期横盘整理,或者趋势反转时,将面临较大亏损。
|
||
|
||
2. 假突破风险:当价格触及通道附近时,可能出现一定比例的假突破,从而导致不必要的交易。
|
||
|
||
3. 参数设置风险:移动平均线和通道参数的设置过于主观,不同市场需要调整参数组合,否则会影响系统稳定性。
|
||
|
||
4. 止损点过小风险:设置的止损点过小,将面临过多的停损出场,影响盈利。
|
||
|
||
对应解决方法:
|
||
1. 谨慎决定持仓时间,防止长期持仓带来的风险。
|
||
2. 优化参数,使突破信号更稳定可靠。
|
||
3. 测试不同市场的数据,优化参数组合。
|
||
4. 适当放宽止损点,防止过于频繁停损。
|
||
|
||
## 优化方向
|
||
|
||
本策略可以从以下几个方向进行优化:
|
||
|
||
1. 测试不同均线的组合,寻找最佳参数组合。可以测试各种简单、指数、Hull等移动平均线的组合。
|
||
|
||
2. 对通道周期和参数进行优化,使突破信号更有效。可以结合市场的波动频率进行优化。
|
||
|
||
3. 优化止损策略,在趋势运行中采用趋势跟踪止损,趋势结束后采用固定止损。
|
||
|
||
4. 利用MACD、KD等指标进行多因子验证,提高信号的准确率。
|
||
|
||
5. 增加仓位管理策略,在趋势运行中加仓,优化盈利。
|
||
|
||
6. 根据不同品种特点选择参数组合,使系统参数鲁棒性更强。
|
||
|
||
## 总结
|
||
|
||
本策略整体作为一个趋势跟踪系统较为典型和简单。核心在于移动平均线的运用和通道的突破过滤。止损策略也经典而实用。本策略可作为量化系统开发的基础框架,也可直接投入使用,收益也较为稳定。通过优化测试可以进一步提高系统的稳定性和收益率。总体来说,本策略具有易操作性与通用性,适合作为量化交易的基础策略之一。
|
||
|
||
||
|
||
|
||
## Overview
|
||
|
||
This is a classic trend following system. It uses moving average crossovers to determine trend direction and enters when price breaks out of Donchian Channels. The Donchian Channel parameter is set to 50 days to filter out short-term market noise. The moving averages are 40-day and 120-day exponential moving averages, which can better capture mid- to long-term trends. The stop loss is set at 4x ATR below price to effectively control loss on individual trades.
|
||
|
||
## Strategy Logic
|
||
|
||
The strategy is mainly based on the following points:
|
||
|
||
1. 40-day and 120-day exponential moving averages are used to construct a trend determination indicator. When the fast line crosses above the slow line from below, it's a golden cross signal, indicating an uptrend. When the fast line crosses below the slow line from above, it's a death cross signal, indicating a downtrend.
|
||
|
||
2. The Donchian Channel parameter is set to 50 days to filter out market noise. Go long only when price breaks out above the upper band, and go short only when price breaks out below the lower band to avoid being trapped.
|
||
|
||
3. The stop loss is set at 4x ATR below price. ATR can effectively measure market volatility and risk. Setting the stop loss at a multiple of it can control the loss on individual trades.
|
||
|
||
4. Exponential moving averages fit better to current price trends, while simple moving averages are too smooth.
|
||
|
||
5. The 50-day channel period works well with the 40-day and 120-day moving averages to effectively filter out false breakouts.
|
||
|
||
## Advantage Analysis
|
||
|
||
The advantages of this strategy include:
|
||
|
||
1. The moving average combination can effectively determine the market trend direction. The 40-day MA captures short-term trends while the 120-day MA judges longer-term trends.
|
||
|
||
2. The Donchian Channel filters out noise and avoids chasing tops and bottoms. Only entering on channel breakouts effectively avoids trading the consolidation areas in the middle.
|
||
|
||
3. The stop loss setting is reasonable to control loss on individual trades and avoid account blowups. Controlling single trade loss ensures profit sustainability.
|
||
|
||
4. Exponential moving averages fit better to price change tendencies, allowing longer holding periods fitting the trend trading idea.
|
||
|
||
5. The moving average parameters strike a balance between trend capture sensitivity and noise filter stability.
|
||
|
||
## Risk Analysis
|
||
|
||
The risks of this strategy include:
|
||
|
||
1. Long holding period risk: As a trend following strategy, large losses may occur during prolonged sideways ranges or trend reversals.
|
||
|
||
2. False breakout risk: There may be some percentage of false breakouts when price touches near the channel bands, causing unnecessary trades.
|
||
|
||
3. Parameter setting risk: The settings for moving averages and channels are subjective. Different markets need adjusted combinations, otherwise system stability is affected.
|
||
|
||
4. Stop loss too tight risk: Setting the stop loss too tight may result in too many stop outs, impacting profitability.
|
||
|
||
Solutions:
|
||
1. Cautiously determine holding periods to avoid long holding period risks.
|
||
2. Optimize parameters to make breakout signals more stable and reliable.
|
||
3. Test data from different markets and optimize parameter combinations.
|
||
4. Loosen stops reasonably to prevent overly frequent stop outs.
|
||
|
||
## Optimization Directions
|
||
|
||
The strategy can be optimized in the following aspects:
|
||
|
||
1. Test different moving average combinations to find the optimal parameters. Various simple, exponential, Hull moving averages can be tested.
|
||
|
||
2. Optimize channel period and settings to make breakout signals more effective. Optimize based on market fluctuation frequency.
|
||
|
||
3. Optimize stop loss strategy. Adopt trailing stops during trending periods and fixed stops after trends end.
|
||
|
||
4. Add confirmation indicators like MACD, KD to improve signal accuracy.
|
||
|
||
5. Introduce position sizing strategies. Pyramid during trending periods to optimize profits.
|
||
|
||
6. Select parameter combinations according to different product characteristics to make the system more robust.
|
||
|
||
## Conclusion
|
||
|
||
Overall this is a typical and simple trend following system. The core lies in using moving averages and channel breakouts. The stop loss strategy is also classic and practical. The strategy can work as a basic framework for quant system development, and can also be directly deployed for relatively stable profits. Further optimization through testing can improve system stability and profitability. In summary, the strategy features ease of use and versatility, making it suitable as a fundamental quantitative trading strategy.
|
||
|
||
[/trans]
|
||
|
||
> Strategy Arguments
|
||
|
||
|
||
|
||
|Argument|Default|Description|
|
||
|----|----|----|
|
||
|v_input_3_close|0|Source Fast MA: close|high|low|open|hl2|hlc3|hlcc4|ohlc4|
|
||
|v_input_4_close|0|Source Slow MA: close|high|low|open|hl2|hlc3|hlcc4|ohlc4|
|
||
|v_input_1|timestamp(01 Jan 2017 00:00 +0000)|(?backtest window)Backtest Start Date|
|
||
|v_input_2|timestamp(01 Jan 2100 00:00 +0000)|Backtest End Date|
|
||
|v_input_int_1|40|(?Moving Average Inputs)Length Fast EMA|
|
||
|v_input_int_2|120|Length Slow EMA|
|
||
|v_input_color_1|red|Color Fast EMA|
|
||
|v_input_color_2|blue|Color Slow EMA|
|
||
|v_input_int_3|50|(?Donchian Channels Inputs)Length Upper Channel|
|
||
|v_input_int_4|50|Length Lower Channel|
|
||
|v_input_color_3|purple|Fill Color|
|
||
|v_input_color_4|orange| Color Upper Channel|
|
||
|v_input_color_5|orange| Color Lower Channel|
|
||
|v_input_int_5|14|(?ATR Inputs)ATR Period|
|
||
|v_input_5|0.01|Risk Per Trade|
|
||
|v_input_6|2|ATR Multiplier|
|
||
|
||
|
||
> Source (PineScript)
|
||
|
||
``` pinescript
|
||
/*backtest
|
||
start: 2023-10-15 00:00:00
|
||
end: 2023-11-14 00:00:00
|
||
period: 1h
|
||
basePeriod: 15m
|
||
exchanges: [{"eid":"Futures_Binance","currency":"BTC_USDT"}]
|
||
*/
|
||
|
||
// This source code is subject to the terms of the Mozilla Public License 2.0 at https://mozilla.org/MPL/2.0/
|
||
// © Robrecht99
|
||
|
||
//@version=5
|
||
strategy("Long Term Trend Following System", overlay=true, margin_long=0, margin_short=0, pyramiding=4)
|
||
|
||
// Backtest Range //
|
||
|
||
Start = input(defval = timestamp("01 Jan 2017 00:00 +0000"), title = "Backtest Start Date", group = "backtest window")
|
||
Finish = input(defval = timestamp("01 Jan 2100 00:00 +0000"), title = "Backtest End Date", group = "backtest window")
|
||
|
||
//Moving Averages //
|
||
|
||
len1 = input.int(40, minval=1, title="Length Fast EMA", group="Moving Average Inputs")
|
||
len2 = input.int(120, minval=1, title="Length Slow EMA", group="Moving Average Inputs")
|
||
src1 = input(close, title="Source Fast MA")
|
||
src2 = input(close, title="Source Slow MA")
|
||
maFast = input.color(color.new(color.red, 0), title = "Color Fast EMA", group = "Moving Average Inputs", inline = "maFast")
|
||
maSlow = input.color(color.new(color.blue, 0), title = "Color Slow EMA", group = "Moving Average Inputs", inline = "maSlow")
|
||
fast = ta.ema(src1, len1)
|
||
slow = ta.ema(src2, len2)
|
||
plot(fast, color=maFast, title="Fast EMA")
|
||
plot(slow, color=maSlow, title="Slow EMA")
|
||
|
||
// Donchian Channels //
|
||
|
||
Length1 = input.int(title="Length Upper Channel", defval=50, minval=1, group="Donchian Channels Inputs")
|
||
Length2 = input.int(title="Length Lower Channel", defval=50, minval=1, group="Donchian Channels Inputs")
|
||
h1 = ta.highest(high[1], Length1)
|
||
l1 = ta.lowest(low[1], Length2)
|
||
fillColor = input.color(color.new(color.purple, 95), title = "Fill Color", group = "Donchian Channels Inputs")
|
||
upperColor = input.color(color.new(color.orange, 0), title = " Color Upper Channel", group = "Donchian Channels Inputs", inline = "upper")
|
||
lowerColor = input.color(color.new(color.orange, 0), title = " Color Lower Channel", group = "Donchian Channels Inputs", inline = "lower")
|
||
u = plot(h1, "Upper", color=upperColor)
|
||
l = plot(l1, "Lower", color=upperColor)
|
||
fill(u, l, color=fillColor)
|
||
strategy.initial_capital = 50000
|
||
//ATR and Position Size //
|
||
|
||
length = input.int(title="ATR Period", defval=14, minval=1, group="ATR Inputs")
|
||
risk = input(title="Risk Per Trade", defval=0.01, group="ATR Inputs")
|
||
multiplier = input(title="ATR Multiplier", defval=2, group="ATR Inputs")
|
||
atr = ta.atr(length)
|
||
amount = (risk * strategy.initial_capital / (multiplier * atr))
|
||
|
||
// Buy and Sell Conditions //
|
||
|
||
entrycondition1 = ta.crossover(fast, slow)
|
||
entrycondition2 = fast > slow
|
||
sellcondition1 = ta.crossunder(fast, slow)
|
||
sellcondition2 = slow > fast
|
||
|
||
// Buy and Sell Signals //
|
||
|
||
if (close > h1 and entrycondition2)
|
||
strategy.entry("long", strategy.long, qty=amount)
|
||
stoploss = close - atr * 4
|
||
strategy.exit("exit sl", stop=stoploss, trail_offset=stoploss)
|
||
if (sellcondition1 and sellcondition2)
|
||
strategy.close(id="long")
|
||
|
||
if (close < l1 and sellcondition2)
|
||
strategy.entry("short", strategy.short, qty=amount)
|
||
stoploss = close + atr * 4
|
||
strategy.exit("exit sl", stop=stoploss, trail_offset=stoploss)
|
||
if (entrycondition1 and entrycondition2)
|
||
strategy.close(id="short")
|
||
```
|
||
|
||
> Detail
|
||
|
||
https://www.fmz.com/strategy/432180
|
||
|
||
> Last Modified
|
||
|
||
2023-11-15 11:00:25
|