
669 lines
39 KiB
Markdown
669 lines
39 KiB
Markdown
|
|
> Name
|
|
|
|
TrendHunter-w-MF-多时间框架趋势策略TrendHunter-w-MF-Multi-Timeframe-Trend-Strategy
|
|
|
|
> Author
|
|
|
|
ChaoZhang
|
|
|
|
> Strategy Description
|
|
|
|
|
|
[trans]
|
|
|
|
## 概述
|
|
|
|
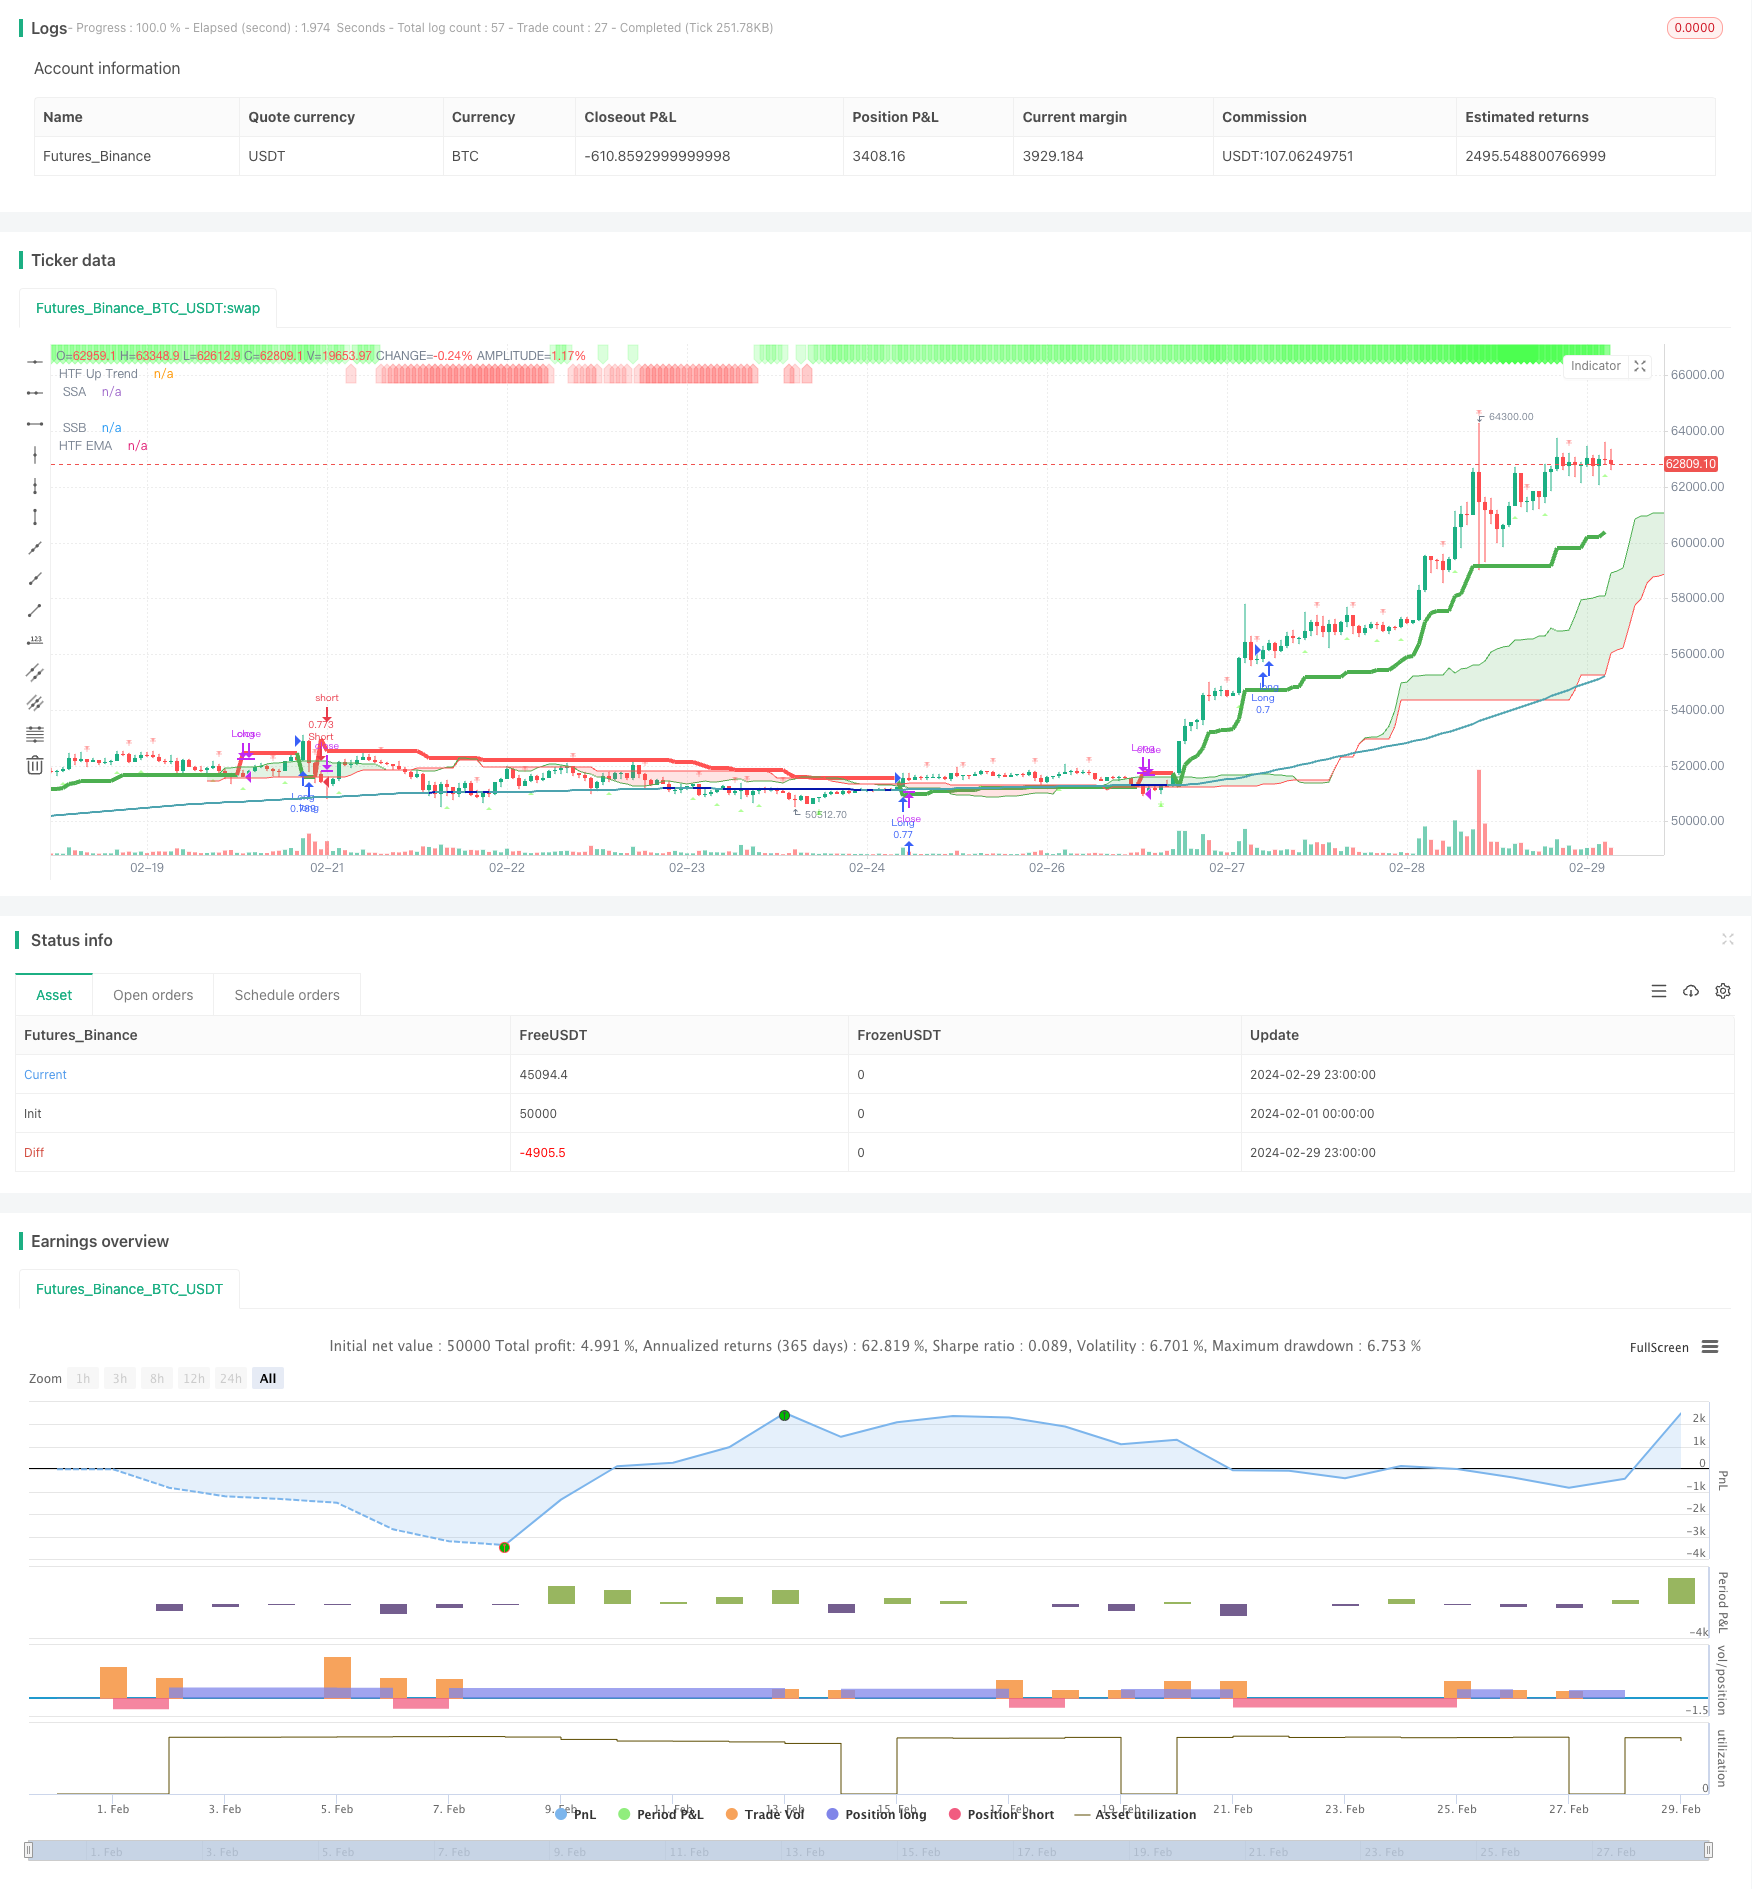
TrendHunter w/MF 多时间框架趋势策略是一种基于多个技术指标和多时间框架分析的趋势跟踪策略。该策略综合考虑了市场云图、均线、超级趋势、波浪趋势和资金流等因素,通过严格的条件来确定进场点,以捕捉市场的主要趋势。
|
|
|
|
## 策略原理
|
|
|
|
该策略的核心原理是基于多个技术指标在多个时间框架上的综合分析。具体来说:
|
|
|
|
1. 市场云图(Ichimoku):通过分析价格与云图的相对位置,以及均线与云图的相对位置,来判断当前的市场趋势。当价格在云图之上,且均线也在云图之上时,被认为是上升趋势;反之则被认为是下降趋势。
|
|
|
|
2. 超级趋势(SuperTrend):通过分析价格与超级趋势的相对位置,来确认当前的市场趋势。当价格在超级趋势之上时,被认为是上升趋势;反之则被认为是下降趋势。
|
|
|
|
3. 波浪趋势(WaveTrend):通过分析波浪趋势指标的走向和位置,来判断当前的市场趋势。当波浪趋势向上且未达到超买区时,被认为是上升趋势;当波浪趋势向下且未达到超卖区时,被认为是下降趋势。
|
|
|
|
4. 资金流(MoneyFlow):通过分析资金流指标的状态,来确认当前的市场趋势。当资金流为正时,被认为是上升趋势;反之则被认为是下降趋势。
|
|
|
|
策略在做多时,要求价格在云图之上,均线在云图之上,超级趋势向上,波浪趋势向上且未达到超买区,资金流为正。做空则相反。这种多指标,多时间框架的严格过滤,可以有效避免在震荡市中频繁交易,从而提高策略的稳定性和可靠性。
|
|
|
|
## 优势分析
|
|
|
|
1. 多指标综合判断,可靠性高:该策略综合考虑了多个技术指标,这些指标在不同的市场状态下互为补充,可以全面反映市场趋势,避免了单一指标可能出现的失误。
|
|
|
|
2. 严格的进场条件,避免频繁交易:策略设置了严格的进场条件,多个指标需要同时满足才能进场,这有效避免了在震荡市中频繁交易,降低了策略的损耗。
|
|
|
|
3. 多时间框架分析,把握大趋势:策略在多个时间框架上进行分析,这有助于策略从更大的视角把握市场的主要趋势,避免被短期噪音所干扰。
|
|
|
|
4. 止损策略明确,风险可控:策略使用超级趋势作为止损条件,一旦市场趋势发生变化,策略可以及时止损,将损失控制在可接受的范围内。
|
|
|
|
## 风险分析
|
|
|
|
1. 缺乏动态调整,应对市场变化能力有限:该策略的参数设置是固定的,缺乏根据市场状态进行动态调整的能力。在市场状态发生重大变化时,策略可能会失效。
|
|
|
|
2. 进场条件过于严格,可能错失良机:策略的进场条件非常严格,这虽然可以避免频繁交易,但也可能导致策略错失一些良好的进场机会。
|
|
|
|
3. 对极端行情的适应性未知:策略在常规市场状态下表现良好,但对于一些极端行情,如快速大幅变盘,策略的适应性还有待检验。
|
|
|
|
4. 止损策略相对简单,有优化空间:目前策略仅使用超级趋势作为止损条件,这虽然简单明了,但止损策略还有进一步优化的空间,以更好地控制风险。
|
|
|
|
## 优化方向
|
|
|
|
1. 引入市场状态判断,动态调整参数:可以考虑引入一些市场状态判断指标,如波动率指标等,根据市场状态的变化动态调整策略参数,以适应不同的市场环境。
|
|
|
|
2. 优化进场条件,提高灵敏度:可以考虑对进场条件进行一些优化,如引入更多的确认指标,以在保证可靠性的同时提高策略的灵敏度,捕捉更多的交易机会。
|
|
|
|
3. 增加极端行情的应对措施:对于一些极端行情,如快速大幅变盘,可以考虑引入一些特殊的应对措施,如加大止损力度,或者暂停交易等,以降低策略在极端行情下的风险。
|
|
|
|
4. 优化止损策略,提高风险控制能力:可以考虑引入更多的止损条件,如时间止损,横幅止损等,也可以考虑引入一些动态止损策略,如跟踪止损等,以更好地控制风险。
|
|
|
|
## 总结
|
|
|
|
TrendHunter w/MF 多时间框架趋势策略是一个基于多指标,多时间框架分析的趋势跟踪策略。该策略通过综合考虑市场云图、均线、超级趋势、波浪趋势和资金流等因素,严格的进场条件设置,以及多时间框架的分析,可以比较可靠地捕捉市场的主要趋势,避免在震荡市中频繁交易,具有较好的稳定性和可靠性。
|
|
|
|
同时,该策略也存在一些局限性和风险,如缺乏动态调整能力,进场条件可能过于严格,对极端行情的适应性未知,以及止损策略相对简单等。这些都是该策略未来可以优化和改进的方向。
|
|
|
|
总的来说,TrendHunter w/MF 多时间框架趋势策略是一个具有良好潜力的趋势跟踪策略。在使用该策略时,交易者应当充分了解它的原理、优势和风险,并根据自己的风险偏好和交易风格进行必要的调整和优化。同时,也要密切关注市场状态的变化,及时调整策略以适应市场的变化。只有在深入理解、审慎使用的基础上,该策略才能发挥其潜在的优势,为交易者带来稳定的收益。
|
|
|
|
||
|
|
|
|
## Overview
|
|
|
|
TrendHunter w/MF Multi-Timeframe Trend Strategy is a trend-following strategy based on the comprehensive analysis of multiple technical indicators across multiple timeframes. This strategy takes into account factors such as Ichimoku Cloud, Moving Averages, SuperTrend, WaveTrend, and MoneyFlow, using strict conditions to determine entry points and capture the main trends of the market.
|
|
|
|
## Strategy Principle
|
|
|
|
The core principle of this strategy is the comprehensive analysis of multiple technical indicators across multiple timeframes. Specifically:
|
|
|
|
1. Ichimoku Cloud: By analyzing the relative position of price and cloud, as well as the relative position of moving averages and cloud, the current market trend is determined. When the price is above the cloud and the moving average is also above the cloud, it is considered an uptrend; otherwise, it is considered a downtrend.
|
|
|
|
2. SuperTrend: By analyzing the relative position of price and SuperTrend, the current market trend is confirmed. When the price is above the SuperTrend, it is considered an uptrend; otherwise, it is considered a downtrend.
|
|
|
|
3. WaveTrend: By analyzing the direction and position of the WaveTrend indicator, the current market trend is determined. When the WaveTrend is rising and has not reached the overbought zone, it is considered an uptrend; when the WaveTrend is falling and has not reached the oversold zone, it is considered a downtrend.
|
|
|
|
4. MoneyFlow: By analyzing the state of the MoneyFlow indicator, the current market trend is confirmed. When the MoneyFlow is positive, it is considered an uptrend; otherwise, it is considered a downtrend.
|
|
|
|
For long positions, the strategy requires the price to be above the cloud, the moving average to be above the cloud, the SuperTrend to be up, the WaveTrend to be rising and not in the overbought zone, and the MoneyFlow to be positive. The opposite applies for short positions. This strict filtering based on multiple indicators across multiple timeframes can effectively avoid frequent trading in range-bound markets, thereby improving the stability and reliability of the strategy.
|
|
|
|
## Advantage Analysis
|
|
|
|
1. Comprehensive judgment based on multiple indicators, high reliability: This strategy comprehensively considers multiple technical indicators, which complement each other under different market conditions, providing a comprehensive reflection of market trends and avoiding the errors that may occur with a single indicator.
|
|
|
|
2. Strict entry conditions, avoiding frequent trading: The strategy sets strict entry conditions, requiring multiple indicators to be satisfied simultaneously before entering a position, which effectively avoids frequent trading in range-bound markets and reduces the attrition of the strategy.
|
|
|
|
3. Multi-timeframe analysis, grasping the big trend: The strategy performs analysis across multiple timeframes, which helps the strategy grasp the main trends of the market from a larger perspective, avoiding interference from short-term noise.
|
|
|
|
4. Clear stop-loss strategy, controllable risk: The strategy uses SuperTrend as a stop-loss condition. Once the market trend changes, the strategy can stop loss in a timely manner, keeping losses within an acceptable range.
|
|
|
|
## Risk Analysis
|
|
|
|
1. Lack of dynamic adjustment, limited ability to respond to market changes: The parameter settings of this strategy are fixed and lack the ability to dynamically adjust according to market conditions. When market conditions change significantly, the strategy may fail.
|
|
|
|
2. Overly strict entry conditions may miss good opportunities: The entry conditions of the strategy are very strict, which, although it can avoid frequent trading, may also lead to the strategy missing some good entry opportunities.
|
|
|
|
3. Adaptability to extreme market conditions is unknown: The strategy performs well under normal market conditions, but its adaptability to some extreme market conditions, such as rapid and substantial reversals, remains to be tested.
|
|
|
|
4. Relatively simple stop-loss strategy, room for optimization: Currently, the strategy only uses SuperTrend as a stop-loss condition. Although this is simple and straightforward, there is further room for optimization in the stop-loss strategy to better control risk.
|
|
|
|
## Optimization Directions
|
|
|
|
1. Introduce market condition judgment, dynamically adjust parameters: Consider introducing some market condition judgment indicators, such as volatility indicators, to dynamically adjust strategy parameters according to changes in market conditions to adapt to different market environments.
|
|
|
|
2. Optimize entry conditions, improve sensitivity: Consider optimizing the entry conditions, such as introducing more confirmation indicators, to improve the sensitivity of the strategy while ensuring reliability, capturing more trading opportunities.
|
|
|
|
3. Add response measures for extreme market conditions: For some extreme market conditions, such as rapid and substantial reversals, consider introducing some special response measures, such as increasing the intensity of stop-loss or suspending trading, to reduce the risk of the strategy under extreme market conditions.
|
|
|
|
4. Optimize stop-loss strategy, improve risk control capabilities: Consider introducing more stop-loss conditions, such as time stop-loss, range stop-loss, etc. Also consider introducing some dynamic stop-loss strategies, such as trailing stop-loss, to better control risk.
|
|
|
|
## Summary
|
|
|
|
TrendHunter w/MF Multi-Timeframe Trend Strategy is a trend-following strategy based on multi-indicator, multi-timeframe analysis. This strategy, through the comprehensive consideration of factors such as Ichimoku Cloud, Moving Averages, SuperTrend, WaveTrend, and MoneyFlow, strict entry condition settings, and multi-timeframe analysis, can capture the main trends of the market relatively reliably, avoiding frequent trading in range-bound markets, and has good stability and reliability.
|
|
|
|
At the same time, this strategy also has some limitations and risks, such as the lack of dynamic adjustment capabilities, potentially overly strict entry conditions, unknown adaptability to extreme market conditions, and a relatively simple stop-loss strategy. These are all areas where this strategy can be optimized and improved in the future.
|
|
|
|
Overall, TrendHunter w/MF Multi-Timeframe Trend Strategy is a trend-following strategy with good potential. When using this strategy, traders should fully understand its principles, advantages, and risks, and make necessary adjustments and optimizations according to their own risk preferences and trading styles. At the same time, they should also closely monitor changes in market conditions and adjust the strategy in a timely manner to adapt to market changes. Only on the basis of in-depth understanding and prudent use can this strategy give full play to its potential advantages and bring stable returns for traders.
|
|
|
|
[/trans]
|
|
|
|
> Strategy Arguments
|
|
|
|
|
|
|
|
|Argument|Default|Description|
|
|
|----|----|----|
|
|
|v_input_int_1|200|(?== EMA ==)EMA Length|
|
|
|v_input_bool_1|true|Colour EMA|
|
|
|v_input_1|10|(?== Supertrend ==)ATR: Period|
|
|
|v_input_float_1|3|Mult|
|
|
|v_input_source_1_hl2|0|Src: hl2|high|low|open|close|hlc3|hlcc4|ohlc4|
|
|
|v_input_int_2|9|(?== Ichimoku ==)Conversion|
|
|
|v_input_int_3|26|Base|
|
|
|v_input_int_4|52|Lagging|
|
|
|v_input_int_5|26|Displacement|
|
|
|v_input_2|false|Conversion|
|
|
|v_input_3|false|Base|
|
|
|v_input_4|false|Lagging|
|
|
|v_input_5|true|Cloud|
|
|
|v_input_6|9|(?== WaveTrend ==)Channel Length|
|
|
|v_input_7|12|Average Length|
|
|
|v_input_8|60|Over Bought|
|
|
|v_input_9|-60|Over Sold|
|
|
|v_input_10|60|(?== Money Flow ==)Money Flow Length|
|
|
|v_input_11|190|RSI+MFI Area multiplier|
|
|
|v_input_string_1|0|Money Flow MA Type: SMA|RMA|EMA|WMA|VWMA|
|
|
|v_input_bool_2|false|(?== Strategy Options ==)Trade Table|
|
|
|v_input_bool_3|true|Enter Longs|
|
|
|v_input_bool_4|true|Enter Shorts|
|
|
|v_input_bool_5|true|Price outside cloud|
|
|
|v_input_string_2|0|priceActionOption: Close|Candle Body|Full Candle|
|
|
|v_input_bool_6|false|Price above/below EMA|
|
|
|v_input_string_3|0|priceEMAOption: Close|Candle Body|Full Candle|
|
|
|v_input_bool_7|true|Supertrend transistions|
|
|
|v_input_bool_8|true|EMA Outside Cloud|
|
|
|v_input_bool_9|false|EMA above/below Cloud|
|
|
|v_input_bool_10|false|Money Flow|
|
|
|v_input_bool_11|false|Wavetrend|
|
|
|v_input_bool_12|false|Overbought/sold|
|
|
|v_input_bool_13|true|Super Trend Exits|
|
|
|
|
|
|
> Source (PineScript)
|
|
|
|
``` pinescript
|
|
/*backtest
|
|
start: 2024-02-01 00:00:00
|
|
end: 2024-02-29 23:59:59
|
|
period: 1h
|
|
basePeriod: 15m
|
|
exchanges: [{"eid":"Futures_Binance","currency":"BTC_USDT"}]
|
|
*/
|
|
|
|
// This Pine Script™ code is subject to the terms of the Mozilla Public License 2.0 at https://mozilla.org/MPL/2.0/
|
|
// © godzcopilot / blockybears
|
|
|
|
// Thanks to anthonyf50 for his MTF Ichimoku https://www.tradingview.com/script/Pw9cBFma/
|
|
// Thanks to KivancOzbilgic for his SuperTrend https://www.tradingview.com/script/r6dAP7yi/
|
|
// Thanks to ZenAndTheArtOfTrading / PineScriptMastery for their Higher Timeframe EMA https://www.tradingview.com/script/Vh3XG9sD-Higher-Timeframe-EMA/
|
|
// Thanks to LazyBear for WaveTrend Oscillator https://www.tradingview.com/script/2KE8wTuF-Indicator-WaveTrend-Oscillator-WT/
|
|
// Thanks to andreholanda73 for MFI+RSI Area https://www.tradingview.com/script/UlGZzUAr/
|
|
|
|
//@version=5
|
|
strategy("TrendHunter w/MF [Blocky]", overlay=true, default_qty_type=strategy.percent_of_equity, default_qty_value=80, initial_capital=1000, pyramiding=0)
|
|
|
|
// ================
|
|
// Strategy Inputs
|
|
// ================
|
|
|
|
// Defines user inputs for configuring the strategy.
|
|
|
|
// Inputs for EMA
|
|
len = input.int(title="EMA Length", defval=200, group ='== EMA ==')
|
|
col = input.bool(title="Colour EMA", defval=true, group ='== EMA ==')
|
|
|
|
// SuperTrend
|
|
Periods = input(title='ATR: Period', defval=10, group = '== Supertrend ==', inline = 'atr')
|
|
Multiplier = input.float(title='Mult', step=0.1, defval=3.0, group = '== Supertrend ==', inline = 'atr')
|
|
Src = input.source(title='Src', defval=hl2, group = '== Supertrend ==', inline = 'atr')
|
|
|
|
// Ichimoku
|
|
conversionPeriods = input.int(9, minval=1, title='Conversion', group = '== Ichimoku ==', inline = 'ich1')
|
|
basePeriods = input.int(26, minval=1, title='Base', group = '== Ichimoku ==', inline = 'ich1')
|
|
laggingSpan2Periods = input.int(52, minval=1, title='Lagging', group = '== Ichimoku ==', inline = 'ich2')
|
|
displacement = input.int(26, minval=1, title='Displacement', group = '== Ichimoku ==', inline = 'ich2')
|
|
|
|
// Ichimoku Display Options
|
|
isActiveConversion = input(false, 'Conversion', group = '== Ichimoku ==', inline = 'lines1')
|
|
isActiveBase = input(false, 'Base', group = '== Ichimoku ==', inline = 'lines1')
|
|
isActiveLagging = input(false, 'Lagging', group = '== Ichimoku ==', inline = 'lines1')
|
|
isActiveCloud = input(true, 'Cloud', group = '== Ichimoku ==', inline = 'lines1')
|
|
|
|
|
|
// Input for WaveTrend
|
|
n1 = input(9, 'Channel Length', group = '== WaveTrend ==', inline = 'wt1')
|
|
n2 = input(12, 'Average Length', group = '== WaveTrend ==', inline = 'wt1')
|
|
|
|
obLevel = input(60, 'Over Bought', group = '== WaveTrend ==', inline = 'wt2')
|
|
osLevel = input(-60, 'Over Sold', group = '== WaveTrend ==', inline = 'wt2')
|
|
|
|
// Input for Money Flow
|
|
rsiMFIperiod = input(60, 'Money Flow Length', group = '== Money Flow ==', inline = 'mf')
|
|
rsiMFIMultiplier = input(190, 'RSI+MFI Area multiplier', group = '== Money Flow ==', inline = 'mf')
|
|
MFRSIMA = input.string(defval='SMA', title='Money Flow MA Type', options=['RMA', 'SMA', 'EMA', 'WMA', 'VWMA'], group = '== Money Flow ==', inline = 'mf')
|
|
|
|
|
|
// ================
|
|
// Strategy Options
|
|
// ================
|
|
|
|
bTable = input.bool(false, title='Trade Table', group='== Strategy Options ==', tooltip = "Show table that shows current selected options and trade trade entry parameters")
|
|
|
|
bLong = input.bool(true, title='Enter Longs', group='== Strategy Options ==', inline = 'LongShort')
|
|
bShort = input.bool(true, title='Enter Shorts', group='== Strategy Options ==', inline = 'LongShort', tooltip = "Filter long / short trade signals")
|
|
|
|
bPriceCloud = input.bool(true, title='Price outside cloud', group='== Strategy Options ==', inline='PriceCloud')
|
|
priceActionOption = input.string(title="", defval="Close", options=["Close", "Candle Body", "Full Candle"], group = "== Strategy Options ==", inline='PriceCloud')
|
|
|
|
bPriceEMA = input.bool(false, title='Price above/below EMA', group='== Strategy Options ==', inline='PriceEMA')
|
|
priceEMAOption = input.string(title="", defval="Close", options=["Close", "Candle Body", "Full Candle"], group = "== Strategy Options ==", inline='PriceEMA')
|
|
|
|
bSuper = input.bool(true, title='Supertrend transistions', group='== Strategy Options ==', tooltip = "Trade in direction of the supertrend transitions")
|
|
|
|
bEMACloud1 = input.bool(true, title='EMA Outside Cloud', group='== Strategy Options ==', tooltip = "EMA must be outside the ichimoku cloud")
|
|
bEMACloud2 = input.bool(false, title='EMA above/below Cloud', group='== Strategy Options ==', tooltip = "Longs when EMA above the cloud.\nShort when EMA below the cloud")
|
|
|
|
bMFI = input.bool(false, title='Money Flow', group='== Strategy Options ==', tooltip = "Money Flow Green for Long\nMoney Flow Red for Short")
|
|
bWT = input.bool(false, title='Wavetrend', group='== Strategy Options ==', inline = 'WT')
|
|
bWTOB = input.bool(false, title='Overbought/sold', group='== Strategy Options ==', tooltip = "Longs when WT Rising\nShort when WT Falling\n\nRestrict entries if in overbough or oversold levels",inline = 'WT')
|
|
|
|
bExitHTFTrail = input.bool(true, title='Super Trend Exits', group='== Strategy Options ==', inline = 'Exits')
|
|
|
|
|
|
// ===========================
|
|
// EMA Functions and Plotting
|
|
// ===========================
|
|
|
|
// Calculate EMA
|
|
ema = ta.ema(close, len)
|
|
emaSmooth = request.security(syminfo.tickerid, "", ema[barstate.isrealtime ? 1 : 0], gaps=barmerge.gaps_on)[barstate.isrealtime ? 0 : 1]
|
|
|
|
|
|
// Draw EMA
|
|
plot(emaSmooth, color=col ? (close > emaSmooth ? color.rgb(76, 163, 175) : color.rgb(6, 23, 173)) : color.black, linewidth=2, title="HTF EMA")
|
|
|
|
|
|
// ==================================
|
|
// Supertrend Functions and Plotting
|
|
// ==================================
|
|
|
|
// Function to calculate SuperTrend
|
|
calcSuperTrend(src, atrPeriods, multiplier) =>
|
|
atr = ta.atr(atrPeriods)
|
|
up = src - multiplier * atr
|
|
up1 = nz(up[1], up)
|
|
up := close[1] > up1 ? math.max(up, up1) : up
|
|
dn = src + multiplier * atr
|
|
dn1 = nz(dn[1], dn)
|
|
dn := close[1] < dn1 ? math.min(dn, dn1) : dn
|
|
trend = 1
|
|
trend := nz(trend[1], trend)
|
|
trend := trend == -1 and close > dn1 ? 1 : trend == 1 and close < up1 ? -1 : trend
|
|
[up, dn, trend]
|
|
|
|
|
|
// Fetching the higher time frame data
|
|
[HTF_up, HTF_dn, HTF_trend] = request.security(syminfo.tickerid, "", calcSuperTrend(hl2, Periods, Multiplier), lookahead=barmerge.lookahead_on)
|
|
|
|
// Plotting for the higher time frame
|
|
plot(HTF_trend == 1 ? HTF_up : HTF_dn, title='HTF Up Trend', color= HTF_trend == 1 ? color.green : color.red, linewidth=4)
|
|
|
|
|
|
// ===============================
|
|
// Ichimoku Functions and Plotting
|
|
// ===============================
|
|
|
|
// Function to convert timeframe to hours
|
|
f_convertTimeframeToHours(tf) =>
|
|
val = 0.0
|
|
if tf == "1S" or tf == "S"
|
|
val := 1.0 / 3600.0
|
|
else if str.contains(tf, "S")
|
|
val := str.tonumber(str.replace(tf, "S", "")) / 3600.0
|
|
else if tf == "1D" or tf == "D"
|
|
val := 24.0
|
|
else if str.contains(tf, "D")
|
|
val := str.tonumber(str.replace(tf, "D", "")) * 24.0
|
|
else if tf == "1W" or tf == "W"
|
|
val := 24.0 * 7.0
|
|
else if str.contains(tf, "W")
|
|
val := str.tonumber(str.replace(tf, "W", "")) * 24.0 * 7.0
|
|
else if tf == "1M" or tf == "M"
|
|
val := 24.0 * 30.0 // Approximation for a month
|
|
else if str.contains(tf, "M")
|
|
val := str.tonumber(str.replace(tf, "M", "")) * 24.0 * 30.0 // Approximation for months
|
|
else
|
|
// Default to minutes
|
|
val := str.tonumber(tf) / 60.0
|
|
val
|
|
|
|
// Time
|
|
timeOffset = time - time[1]
|
|
|
|
|
|
// Returns the displacement based on the chart / HTF resolution
|
|
f_getDisplacement(_res) =>
|
|
_res == '' ? displacement : math.round(f_convertTimeframeToHours(_res) / f_convertTimeframeToHours(timeframe.period) * displacement)
|
|
//f_avgDilationOf(_res) * displacement
|
|
|
|
// Returns average value between lowest and highest
|
|
f_avgLH(_len) =>
|
|
math.avg(ta.lowest(_len), ta.highest(_len))
|
|
|
|
// Returns f_donchian data
|
|
f_donchian(_tf, _src) =>
|
|
request.security(syminfo.tickerid, _tf, _src, barmerge.gaps_off, barmerge.lookahead_on)
|
|
|
|
// Returns ichimoku data
|
|
f_ichimokuData(_tf) =>
|
|
_isShow = _tf == '' or f_convertTimeframeToHours(_tf) >= f_convertTimeframeToHours(timeframe.period)
|
|
_displacement = _isShow ? f_getDisplacement(_tf) : na
|
|
_Conversion = _isShow ? f_donchian(_tf, f_avgLH(conversionPeriods)) : na
|
|
_Base = _isShow ? f_donchian(_tf, f_avgLH(basePeriods)) : na
|
|
_Lagging = _isShow ? f_donchian(_tf, close) : na
|
|
_SSA = _isShow ? math.avg(_Conversion, _Base) : na
|
|
_SSB = _isShow ? f_donchian(_tf, f_avgLH(laggingSpan2Periods)) : na
|
|
_middleCloud = _isShow ? _SSA[0] > _SSB[0] ? _SSA[0] - math.abs(_SSA[0] - _SSB[0]) / 2 : _SSA[0] + math.abs(_SSA[0] - _SSB[0]) / 2 : na
|
|
[_displacement, _Conversion, _Base, _Lagging, _SSA, _SSB, _middleCloud]
|
|
|
|
// Plotting ichimoku data
|
|
|
|
[Displacement, Conversion, Base, Lagging, SSA, SSB, fisrtMiddleCloud] = f_ichimokuData("")
|
|
|
|
// ————— Conversion
|
|
plot(isActiveConversion ? Conversion : na, color=color.new(color.blue, 0), title=' Conversion', linewidth=1)
|
|
// ————— Base
|
|
plot(isActiveBase ? Base : na, color=color.new(color.fuchsia, 0), title=' Base', linewidth=2)
|
|
// ————— Lagging
|
|
plot(isActiveLagging ? Lagging : na, offset=-Displacement, color=color.new(color.green, 0), title=' Lagging')
|
|
|
|
// ————— SSA + SSB
|
|
ssa = plot(isActiveCloud ? SSA : na, offset=Displacement, color=color.new(color.green, 0), title=' SSA', linewidth=1)
|
|
ssb = plot(isActiveCloud ? SSB : na, offset=Displacement, color=color.new(color.red, 0), title=' SSB', linewidth=1)
|
|
fill(ssa, ssb, color=color.new(SSA > SSB ? color.green : color.red , 80), title=' Cloud')
|
|
|
|
|
|
// ===============================
|
|
// Makret Cypher Additions
|
|
// ===============================
|
|
|
|
|
|
// WaveTrend calculations
|
|
ap = hlc3
|
|
esa = ta.ema(ap, n1)
|
|
d = ta.ema(math.abs(ap - esa), n1)
|
|
ci = (ap - esa) / (0.015 * d)
|
|
tci = ta.ema(ci, n2)
|
|
|
|
wt1 = tci
|
|
wt2 = ta.sma(wt1, 3)
|
|
|
|
// WaveTrend plotting
|
|
//plot(0, color=color.rgb(120, 123, 134), title='Zero Line')
|
|
//plot(emaSmooth + wt1, color=color.rgb(191, 228, 255), style=plot.style_linebr, title='WaveTrend 1')
|
|
//plot(emaSmooth + wt2, color=color.rgb(56, 56, 56, 40), style=plot.style_linebr, title='WaveTrend 2')
|
|
|
|
// WaveTrend shapes
|
|
plotshape(ta.crossover(wt1, wt2) and wt2[2] < osLevel ? close : na, title='Pos Crossover', location=location.belowbar, style=shape.cross, size=size.small, color=color.rgb(63, 255, 0, 60))
|
|
plotshape(ta.crossover(wt2, wt1) and wt1[2] > osLevel ? close : na, title='Neg Crossover', location=location.abovebar, style=shape.cross, size=size.small, color=color.rgb(255, 82, 82, 60))
|
|
plotshape(ta.crossover(wt1, wt2) and osLevel ? close : na, title='Positive Crossover', location=location.belowbar, style=shape.triangleup, size=size.tiny, color=color.rgb(63, 255, 0, 60))
|
|
plotshape(ta.crossover(wt2, wt1) and obLevel ? close : na, title='Negative Crossover', location=location.abovebar, style=shape.triangledown, size=size.tiny, color=color.rgb(255, 82, 82, 60))
|
|
|
|
// Function to determine WaveTrend direction and steepness
|
|
isWaveTrendUp() =>
|
|
wt1Slope = wt1 - wt1[1]
|
|
wt2Slope = wt2 - wt2[1]
|
|
if wt1 > wt2 // wt1Slope > 0 and wt2Slope > 0
|
|
1 // Both are going up
|
|
else if wt1 < wt2 // wt1Slope < 0 and wt2Slope < 0
|
|
2 // Both are going down
|
|
else
|
|
na // Trends are not in the same direction
|
|
|
|
|
|
|
|
ma(matype, src, length) =>
|
|
if matype == 'RMA'
|
|
ta.rma(src, length)
|
|
else
|
|
if matype == 'SMA'
|
|
ta.sma(src, length)
|
|
else
|
|
if matype == 'EMA'
|
|
ta.ema(src, length)
|
|
else
|
|
if matype == 'WMA'
|
|
ta.wma(src, length)
|
|
else
|
|
if matype == 'VWMA'
|
|
ta.vwma(src, length)
|
|
else
|
|
src
|
|
|
|
// Money Flow calculations
|
|
candleValue = (close - open) / (high - low)
|
|
MVC = ma(MFRSIMA, candleValue, rsiMFIperiod)
|
|
MVC := MVC * rsiMFIMultiplier
|
|
mfi_transp = math.abs(MVC) > 35 ? 0 : math.abs(MVC) > 30 ? 20 : math.abs(MVC) > 25 ? 30 : math.abs(MVC) > 20 ? 40 : math.abs(MVC) > 15 ? 50 : math.abs(MVC) > 10 ? 60 : math.abs(MVC) > 5 ? 65 : math.abs(MVC) > 2 ? 70 : 80
|
|
color_area = MVC > 0 ? color.rgb(76, 255, 80, mfi_transp) : color.rgb(255, 82, 82, mfi_transp)
|
|
|
|
// Money Flow plotting
|
|
// RSIMFIplot = plot(MVC * rsiMFIMultiplier, title='Money Flow', color=color_area, style=plot.style_area)
|
|
// fill(RSIMFIplot, plot(0), color_area)
|
|
|
|
plotshape(MVC > 0 ? true : na, title='MFI', location=location.top, style=shape.labeldown, size= size.tiny, color=color_area)
|
|
plotshape(MVC < 0 ? true : na, title='MFI', location=location.top, style= shape.labelup, size= size.tiny, color=color_area)
|
|
|
|
|
|
|
|
|
|
// ===============================
|
|
// Strategy Entries
|
|
// ===============================
|
|
|
|
// Checks whether price is inside the Ichimoku cloud
|
|
f_PriceCloud(dir) =>
|
|
_enter = false
|
|
if bPriceCloud
|
|
if bLong and dir == 1
|
|
_enter := switch priceActionOption
|
|
"Close" => close > math.max(SSA[Displacement], SSB[Displacement])
|
|
"Candle Body" => open > math.max(SSA[Displacement], SSB[Displacement]) and close > math.max(SSA[Displacement], SSB[Displacement])
|
|
"Full Candle" => low > math.max(SSA[Displacement], SSB[Displacement]) and high > math.max(SSA[Displacement], SSB[Displacement])
|
|
if bShort and dir == 2
|
|
_enter := switch priceActionOption
|
|
"Close" => close < math.min(SSA[Displacement], SSB[Displacement])
|
|
"Candle Body" => open < math.min(SSA[Displacement], SSB[Displacement]) and close < math.min(SSA[Displacement], SSB[Displacement])
|
|
"Full Candle" => low < math.min(SSA[Displacement], SSB[Displacement]) and high < math.min(SSA[Displacement], SSB[Displacement])
|
|
else
|
|
_enter := na
|
|
_enter
|
|
|
|
// Checks whether price is above / below the ema
|
|
f_PriceEMA(dir) =>
|
|
_enter = false
|
|
if bPriceEMA
|
|
if bLong and dir == 1
|
|
_enter := switch priceEMAOption
|
|
"Close" => close > math.max(SSA[Displacement], SSB[Displacement])
|
|
"Candle Body" => open > math.max(SSA[Displacement], SSB[Displacement]) and close > math.max(SSA[Displacement], SSB[Displacement])
|
|
"Full Candle" => low > math.max(SSA[Displacement], SSB[Displacement]) and high > math.max(SSA[Displacement], SSB[Displacement])
|
|
if bShort and dir == 2
|
|
_enter := switch priceEMAOption
|
|
"Close" => close < math.min(SSA[Displacement], SSB[Displacement])
|
|
"Candle Body" => open < math.min(SSA[Displacement], SSB[Displacement]) and close < math.min(SSA[Displacement], SSB[Displacement])
|
|
"Full Candle" => low < math.min(SSA[Displacement], SSB[Displacement]) and high < math.min(SSA[Displacement], SSB[Displacement])
|
|
else
|
|
_enter := na
|
|
_enter
|
|
|
|
// Checks HTF supertrend direction
|
|
f_Super(dir) =>
|
|
_enter = false
|
|
if bSuper
|
|
if bLong and dir == 1
|
|
_enter := HTF_trend == 1
|
|
if bShort and dir == 2
|
|
_enter := HTF_trend == -1
|
|
else
|
|
_enter := na
|
|
|
|
_enter
|
|
|
|
// Checks whether ema is inside the Ichimoku cloud
|
|
f_EMACloud1(dir) =>
|
|
_enter = false
|
|
if bEMACloud1
|
|
if bLong and dir == 1
|
|
_enter := (emaSmooth > math.max(SSA[Displacement], SSB[Displacement])) or (emaSmooth < math.min(SSA[Displacement], SSB[Displacement]))
|
|
if bShort and dir == 2
|
|
_enter := (emaSmooth > math.max(SSA[Displacement], SSB[Displacement])) or (emaSmooth < math.min(SSA[Displacement], SSB[Displacement]))
|
|
else
|
|
_enter := na
|
|
_enter
|
|
|
|
// Checks whether ema is above/below Ichimoku cloud
|
|
f_EMACloud2(dir) =>
|
|
_enter = false
|
|
if bEMACloud2
|
|
if bLong and dir == 1
|
|
_enter := emaSmooth > math.max(SSA[Displacement], SSB[Displacement])
|
|
if bShort and dir == 2
|
|
_enter := emaSmooth < math.min(SSA[Displacement], SSB[Displacement])
|
|
else
|
|
_enter := na
|
|
_enter
|
|
|
|
// Checks whether moneyflow is positive
|
|
f_MFI(dir) =>
|
|
_enter = false
|
|
if bMFI
|
|
if bLong and dir == 1
|
|
_enter := MVC > 0
|
|
if bShort and dir == 2
|
|
_enter := MVC < 0
|
|
else
|
|
_enter := na
|
|
_enter
|
|
|
|
|
|
// Checks whether wavetrend is rising or falling
|
|
f_WT(dir) =>
|
|
_enter = false
|
|
if bWT
|
|
if bLong and dir == 1
|
|
_enter := isWaveTrendUp() == dir
|
|
if bShort and dir == 2
|
|
_enter := isWaveTrendUp() == dir
|
|
else
|
|
_enter := na
|
|
_enter
|
|
|
|
|
|
f_WTOB(dir) =>
|
|
_enter = false
|
|
if bWT and bWTOB
|
|
if bLong and dir == 1
|
|
_enter := wt1 < obLevel
|
|
if bShort and dir == 2
|
|
_enter := wt1 > osLevel
|
|
else
|
|
_enter := na
|
|
_enter
|
|
|
|
|
|
// Check if a value is 'na' or true.
|
|
f_NATrue(val) =>
|
|
_enter = false
|
|
if na(val)
|
|
_enter := true
|
|
if val
|
|
_enter := true
|
|
_enter
|
|
|
|
|
|
// Consolidates entry conditions.
|
|
f_checkCondition(dir) =>
|
|
_enter = false
|
|
if na(f_PriceCloud(dir)) and na(f_PriceEMA(dir)) and na(f_Super(dir)) and na(f_EMACloud1(dir)) and na(f_EMACloud2(dir)) and na(f_MFI(dir)) and na(f_WT(dir)) and na(f_WTOB(dir))
|
|
_enter := false
|
|
else if f_NATrue(f_PriceCloud(dir)) and f_NATrue(f_PriceEMA(dir)) and f_NATrue(f_Super(dir)) and f_NATrue(f_EMACloud1(dir)) and f_NATrue(f_EMACloud2(dir)) and f_NATrue(f_MFI(dir)) and f_NATrue(f_WT(dir)) and f_NATrue(f_WTOB(dir))
|
|
_enter := true
|
|
_enter
|
|
|
|
|
|
// Execute long trade entries
|
|
longCondition = bLong and f_checkCondition(1)
|
|
if (longCondition)
|
|
strategy.entry("Long", strategy.long)
|
|
|
|
// Execute short trade entries
|
|
shortCondition = bShort and f_checkCondition(2)
|
|
if (shortCondition)
|
|
strategy.entry("Short", strategy.short)
|
|
|
|
// Excute trade exits
|
|
exitLong = (bExitHTFTrail and (close < HTF_up or HTF_trend == -1))
|
|
exitShort = (bExitHTFTrail and (close > HTF_dn or HTF_trend == 1))
|
|
|
|
if exitLong
|
|
strategy.close("Long")
|
|
|
|
if exitShort
|
|
strategy.close("Short")
|
|
|
|
// Creates a table shoing all the user options and their current status for entering a trade
|
|
if bTable
|
|
// Create a table
|
|
tbl = table.new(position = position.bottom_right, columns = 4, rows = 11, bgcolor=color.new(color.black,100), border_width = 0, frame_width = 0)
|
|
|
|
table.cell(tbl, 1, 0, "Selected", text_halign = text.align_center, text_size = size.small, text_color = color.rgb(207, 207, 207))
|
|
table.cell(tbl, 2, 0, "Long", bgcolor=na(bLong) ? color.new(color.black,100) : bShort ? color.rgb(4, 112, 8) : color.rgb(100, 7, 7), text_halign = text.align_center, text_size = size.small, text_color = color.rgb(207, 207, 207))
|
|
table.cell(tbl, 3, 0, "Short", bgcolor=na(bShort) ? color.new(color.black,100) : bShort ? color.rgb(4, 112, 8) : color.rgb(100, 7, 7), text_halign = text.align_center, text_size = size.small, text_color = color.rgb(207, 207, 207))
|
|
|
|
table.cell(tbl, 0, 1, "Entry", text_halign = text.align_left, text_size = size.small, text_color = color.rgb(207, 207, 207))
|
|
table.cell(tbl, 2, 1, longCondition ? "✓" : "✗", bgcolor=longCondition ? color.green : color.red, text_halign = text.align_center, text_size = size.small, text_color = color.rgb(207, 207, 207))
|
|
table.cell(tbl, 3, 1, shortCondition ? "✓" : "✗", bgcolor=shortCondition ? color.green : color.red, text_halign = text.align_center, text_size = size.small, text_color = color.rgb(207, 207, 207))
|
|
|
|
|
|
table.cell(tbl, 0, 3, "Price Cloud", text_halign = text.align_left, text_size = size.small, text_color = color.rgb(207, 207, 207))
|
|
table.cell(tbl, 1, 3, bPriceCloud ? "✓" : "✗", bgcolor=na(bPriceCloud) ? color.new(color.black,100) : bPriceCloud ? color.green : color.red, text_halign = text.align_center, text_size = size.small, text_color = color.rgb(207, 207, 207))
|
|
table.cell(tbl, 2, 3, f_PriceCloud(1) ? "✓" : "✗", bgcolor=na(f_PriceCloud(1)) ? color.new(color.black,100) : f_PriceCloud(1) ? color.green : color.red, text_halign = text.align_center, text_size = size.small, text_color = color.rgb(207, 207, 207))
|
|
table.cell(tbl, 3, 3, f_PriceCloud(2) ? "✓" : "✗", bgcolor=na(f_PriceCloud(2)) ? color.new(color.black,100) : f_PriceCloud(2) ? color.green : color.red, text_halign = text.align_center, text_size = size.small, text_color = color.rgb(207, 207, 207))
|
|
|
|
table.cell(tbl, 0, 4, "Price EMA", text_halign = text.align_left, text_size = size.small, text_color = color.rgb(207, 207, 207))
|
|
table.cell(tbl, 1, 4, bPriceEMA ? "✓" : "✗", bgcolor=na(bPriceEMA) ? color.new(color.black,100) : bPriceEMA ? color.green : color.red, text_halign = text.align_center, text_size = size.small, text_color = color.rgb(207, 207, 207))
|
|
table.cell(tbl, 2, 4, f_PriceEMA(1) ? "✓" : "✗", bgcolor=na(f_PriceEMA(1)) ? color.new(color.black,100) : f_PriceEMA(1) ? color.green : color.red, text_halign = text.align_center, text_size = size.small, text_color = color.rgb(207, 207, 207))
|
|
table.cell(tbl, 3, 4, f_PriceEMA(2) ? "✓" : "✗", bgcolor=na(f_PriceEMA(2)) ? color.new(color.black,100) : f_PriceEMA(2) ? color.green : color.red, text_halign = text.align_center, text_size = size.small, text_color = color.rgb(207, 207, 207))
|
|
|
|
table.cell(tbl, 0, 5, "SuperTrend", text_halign = text.align_left, text_size = size.small, text_color = color.rgb(207, 207, 207))
|
|
table.cell(tbl, 1, 5, bSuper ? "✓" : "✗", bgcolor=na(bSuper) ? color.new(color.black,100) : bSuper ? color.green : color.red, text_halign = text.align_center, text_size = size.small, text_color = color.rgb(207, 207, 207))
|
|
table.cell(tbl, 2, 5, f_Super(1) ? "✓" : "✗", bgcolor=na(f_Super(1)) ? color.new(color.black,100) : f_Super(1) ? color.green : color.red, text_halign = text.align_center, text_size = size.small, text_color = color.rgb(207, 207, 207))
|
|
table.cell(tbl, 3, 5, f_Super(2) ? "✓" : "✗", bgcolor=na(f_Super(2)) ? color.new(color.black,100) : f_Super(2) ? color.green : color.red, text_halign = text.align_center, text_size = size.small, text_color = color.rgb(207, 207, 207))
|
|
|
|
table.cell(tbl, 0, 6, "EMA Outside Cloud", text_halign = text.align_left, text_size = size.small, text_color = color.rgb(207, 207, 207))
|
|
table.cell(tbl, 1, 6, bEMACloud1 ? "✓" : "✗", bgcolor=na(bEMACloud1) ? color.new(color.black,100) : bEMACloud1 ? color.green : color.red, text_halign = text.align_center, text_size = size.small, text_color = color.rgb(207, 207, 207))
|
|
table.cell(tbl, 2, 6, f_EMACloud1(1) ? "✓" : "✗", bgcolor=na(f_EMACloud1(1)) ? color.new(color.black,100) : f_EMACloud1(1) ? color.green : color.red, text_halign = text.align_center, text_size = size.small, text_color = color.rgb(207, 207, 207))
|
|
table.cell(tbl, 3, 6, f_EMACloud1(2) ? "✓" : "✗", bgcolor=na(f_EMACloud1(2)) ? color.new(color.black,100) : f_EMACloud1(2) ? color.green : color.red, text_halign = text.align_center, text_size = size.small, text_color = color.rgb(207, 207, 207))
|
|
|
|
table.cell(tbl, 0, 7, "EMA Above/Below Cloud", text_halign = text.align_left, text_size = size.small, text_color = color.rgb(207, 207, 207))
|
|
table.cell(tbl, 1, 7, bEMACloud2 ? "✓" : "✗", bgcolor=na(bEMACloud2) ? color.new(color.black,100) : bEMACloud2 ? color.green : color.red, text_halign = text.align_center, text_size = size.small, text_color = color.rgb(207, 207, 207))
|
|
table.cell(tbl, 2, 7, f_EMACloud2(1) ? "✓" : "✗", bgcolor=na(f_EMACloud2(1)) ? color.new(color.black,100) : f_EMACloud2(1) ? color.green : color.red, text_halign = text.align_center, text_size = size.small, text_color = color.rgb(207, 207, 207))
|
|
table.cell(tbl, 3, 7, f_EMACloud2(2) ? "✓" : "✗", bgcolor=na(f_EMACloud2(2)) ? color.new(color.black,100) : f_EMACloud2(2) ? color.green : color.red, text_halign = text.align_center, text_size = size.small, text_color = color.rgb(207, 207, 207))
|
|
|
|
table.cell(tbl, 0, 8, "Moneyflow", text_halign = text.align_left, text_size = size.small, text_color = color.rgb(207, 207, 207))
|
|
table.cell(tbl, 1, 8, bMFI ? "✓" : "✗", bgcolor=na(bMFI) ? color.new(color.black,100) : bMFI ? color.green : color.red, text_halign = text.align_center, text_size = size.small, text_color = color.rgb(207, 207, 207))
|
|
table.cell(tbl, 2, 8, f_MFI(1) ? "✓" : "✗", bgcolor=na(f_MFI(1)) ? color.new(color.black,100) : f_MFI(1) ? color.green : color.red, text_halign = text.align_center, text_size = size.small, text_color = color.rgb(207, 207, 207))
|
|
table.cell(tbl, 3, 8, f_MFI(2) ? "✓" : "✗", bgcolor=na(f_MFI(2)) ? color.new(color.black,100) : f_MFI(2) ? color.green : color.red, text_halign = text.align_center, text_size = size.small, text_color = color.rgb(207, 207, 207))
|
|
|
|
table.cell(tbl, 0, 9, "WaveTrend", text_halign = text.align_left, text_size = size.small, text_color = color.rgb(207, 207, 207))
|
|
table.cell(tbl, 1, 9, bWT ? "✓" : "✗", bgcolor=na(bWT) ? color.new(color.black,100) : bWT ? color.green : color.red, text_halign = text.align_center, text_size = size.small, text_color = color.rgb(207, 207, 207))
|
|
table.cell(tbl, 2, 9, f_WT(1) ? "✓" : "✗", bgcolor=na(f_WT(1)) ? color.new(color.black,100) : f_WT(1) ? color.green : color.red, text_halign = text.align_center, text_size = size.small, text_color = color.rgb(207, 207, 207))
|
|
table.cell(tbl, 3, 9, f_WT(2) ? "✓" : "✗", bgcolor=na(f_WT(2)) ? color.new(color.black,100) : f_WT(2) ? color.green : color.red, text_halign = text.align_center, text_size = size.small, text_color = color.rgb(207, 207, 207))
|
|
|
|
table.cell(tbl, 0, 10, "Overbought/Sold " + str.tostring(wt1, '#.#'), text_halign = text.align_left, text_size = size.small, text_color = color.rgb(207, 207, 207))
|
|
table.cell(tbl, 1, 10, bWTOB ? "✓" : "✗", bgcolor=na(bWTOB) ? color.new(color.black,100) : bWTOB ? color.green : color.red, text_halign = text.align_center, text_size = size.small, text_color = color.rgb(207, 207, 207))
|
|
table.cell(tbl, 2, 10, f_WTOB(1) ? "✓" : "✗", bgcolor=na(f_WTOB(1)) ? color.new(color.black,100) : f_WTOB(1) ? color.green : color.red, text_halign = text.align_center, text_size = size.small, text_color = color.rgb(207, 207, 207))
|
|
table.cell(tbl, 3, 10, f_WTOB(2) ? "✓" : "✗", bgcolor=na(f_WTOB(2)) ? color.new(color.black,100) : f_WTOB(2) ? color.green : color.red, text_halign = text.align_center, text_size = size.small, text_color = color.rgb(207, 207, 207))
|
|
|
|
```
|
|
|
|
> Detail
|
|
|
|
https://www.fmz.com/strategy/444971
|
|
|
|
> Last Modified
|
|
|
|
2024-03-15 16:01:54
|