
9.2 KiB
Name
RSI-多空自动交易策略RSI-Long-Short-Automated-Trading-Strategy
Author
ChaoZhang
Strategy Description
[trans]
概述
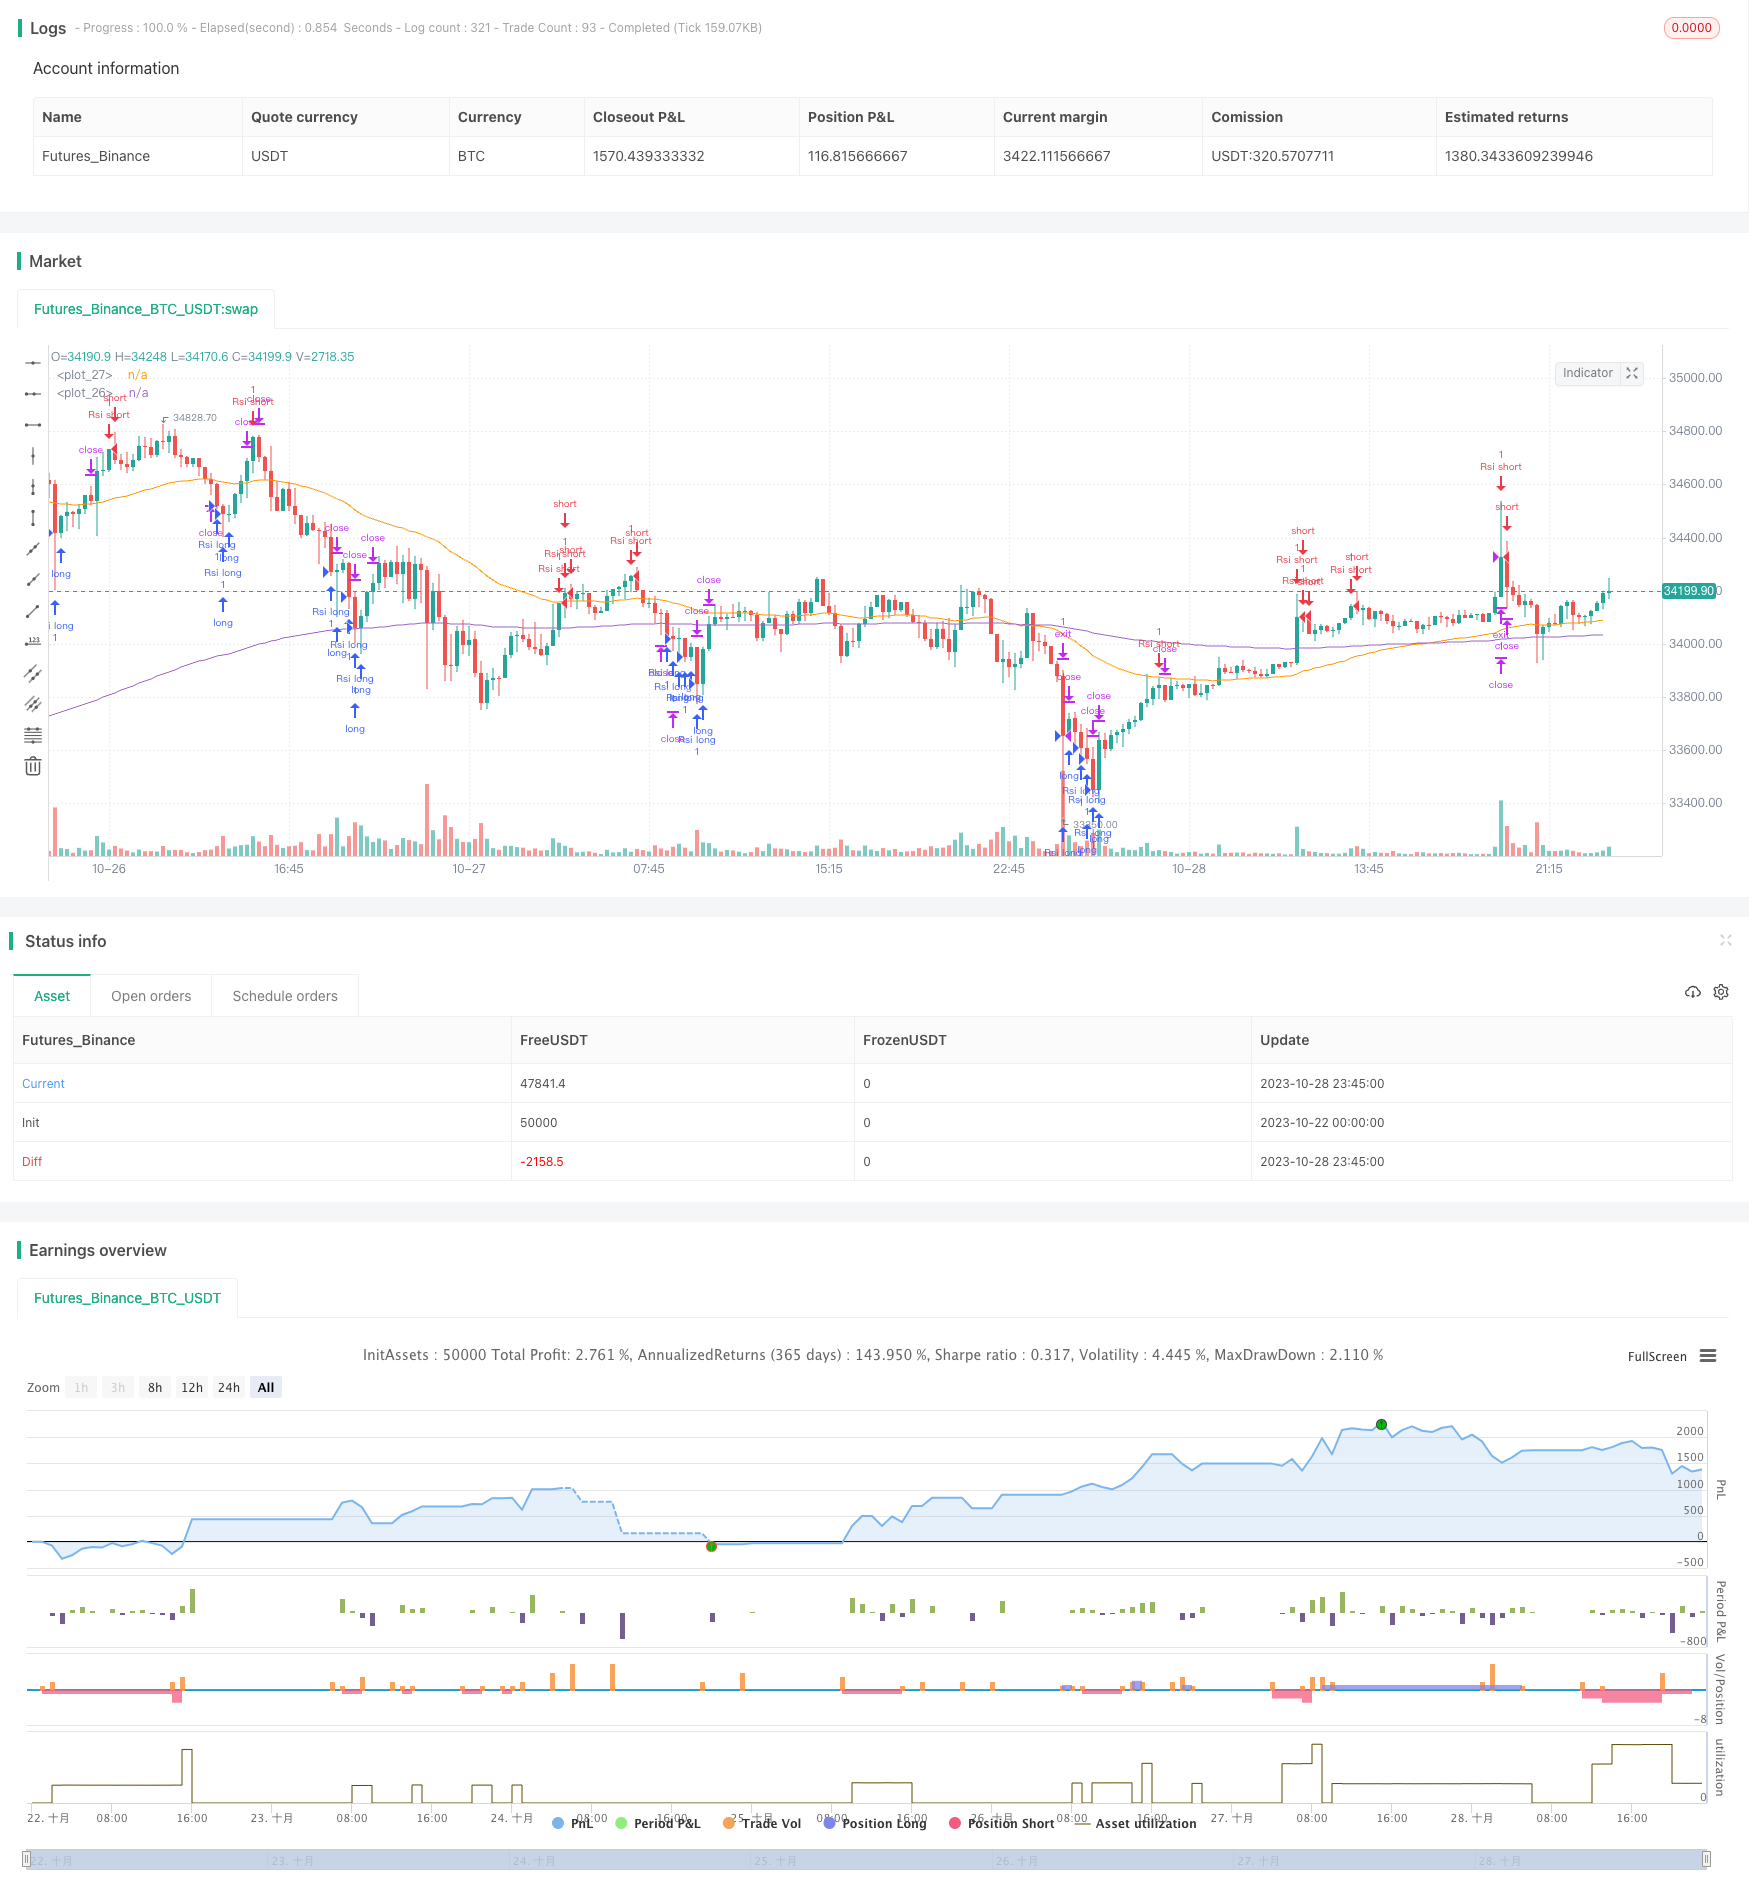
该策略基于相对强弱指数(RSI)指标设计了一个多空自动交易系统。它可以在RSI达到超买超卖区域时,自动发出做多做空信号,进行自动交易。
策略原理
该策略通过计算一定周期内的股票涨跌幅,得到0-100区间的RSI值。当RSI低于30时为超卖状态,高于70时为超买状态。策略根据这一规则,在RSI达到超卖区时自动做多,达到超买区时自动做空。
具体来说,策略首先计算15周期的RSI值。当RSI下跌到低于20时,认为处于超卖状态,此时在突破200日移动均线上方时,做多入场。当RSI上涨到超过80时,认为处于超买状态,此时做空入场。做多做空后,均设置止盈止损离场。
此外,策略还在价格发生信号时,画出相关的标记线和标签,使交易信号更加直观。
策略优势
- 策略思路清晰简单,容易理解实现
- 基于RSI指标,对超买超卖情况判断准确
- 完全自动交易,不需要人工干预
- 设置止盈止损,有效控制风险
- 交易信号直观,易于监控
策略风险
- RSI指标具有一定滞后性,可能出现误判
- 固定的超买超卖阈值不适用于所有品种
- 止损点设置不恰当可能造成较大亏损
- 趋势市场中随大趋势做多做空可能亏损
风险控制措施包括:优化RSI参数,调整超买超卖阈值适应不同品种,合理设置止损点,结合趋势指标避免逆势交易。
策略优化方向
- 优化RSI参数,提高对超买超卖的判断准确性
- 结合其他指标确认交易信号,例如KDJ,MACD等
- 根据市场情况,优化止损点的设置
- 增加趋势判断,避免逆势操作
- 设定权益曲线跟踪止损
- 开发风控模块,控制单笔和总体风险
总结
该策略overall是一个利用RSI指标判断超买超卖的自动交易策略。它在RSI达到超买超卖极端区域时发出交易信号,可以自动进行买卖操作。策略思路简单清晰,容易实现,适合作为自动交易的基础策略。但RSI指标存在一定滞后性,所以建议结合其他指标进行优化,提高信号准确性。此外还需要关注风险控制,优化止损机制,开发风控模块,以减少交易风险。如果在实盘中经过优化验证,该策略可以成为一个有效的多空自动交易系统。
||
Overview
This strategy designs an automated trading system for long and short based on the Relative Strength Index (RSI) indicator. It can automatically generate long and short signals when RSI reaches overbought or oversold levels and conduct automated trading.
Strategy Logic
The strategy calculates the RSI values in the range of 0-100 based on the price rises and falls within a certain period. When RSI is below 30, it is oversold status. When RSI is above 70, it is overbought status. According to this rule, the strategy automatically goes long when RSI reaches the oversold zone and goes short when RSI reaches the overbought zone.
Specifically, the strategy first calculates the 15-period RSI. When the RSI falls below 20, it is considered oversold. At this time, when the price breaks above the 200-day moving average, a long position is opened. When the RSI rises above 80, it is considered overbought. At this time, a short position is opened. After going long or short, take profit and stop loss are set to exit positions.
In addition, the strategy draws corresponding landmark lines and labels when price signals occur to make trading signals more intuitive.
Advantages of the Strategy
- The strategy idea is clear and easy to understand and implement
- Based on the RSI indicator, the judgment of overbought and oversold is accurate
- Fully automated trading without manual intervention
- Take profit and stop loss set to effectively control risks
- Trading signals intuitive and easy to monitor
Risks of the Strategy
- RSI indicator has some lagging, may cause misjudgement
- Fixed overbought and oversold thresholds are not suitable for all products
- Improper stop loss setting may cause greater losses
- Trading with the major trend in trending markets may cause losses
Risk control measures include: optimizing RSI parameters, adjusting overbought and oversold thresholds to suit different products, reasonably setting stop loss, combining with trend indicators to avoid trading against the trend.
Directions for Strategy Optimization
- Optimize RSI parameters to improve the accuracy of judging overbought and oversold
- Confirm trading signals with other indicators such as KDJ, MACD etc.
- Optimize stop loss setting according to market conditions
- Add trend judgment to avoid reverse operations
- Set equity curve tracking stop loss
- Develop risk control module to control single and overall risks
Summary
Overall this is an automated trading strategy using the RSI indicator to judge overbought and oversold conditions. It generates trading signals when RSI reaches extreme overbought or oversold levels, and can automatically conduct long and short trading. The strategy idea is simple and clear, easy to implement, and suitable as a basic automated trading strategy. But RSI indicator has some lagging, so it is recommended to optimize it with other indicators to improve signal accuracy. In addition, attention should be paid to risk control, optimizing the stop loss mechanism, developing risk control modules to reduce trading risks. If optimized and verified in live trading, the strategy can become an effective automated system for long and short trading.
[/trans]
Strategy Arguments
| Argument | Default | Description |
|---|---|---|
| v_input_timeframe_1 | 0 | Resolution: 15 |
| v_input_1 | 1600 | Reward |
| v_input_2 | 1600 | Risk |
| v_input_3 | 5 | length |
| v_input_4 | 30 | overSold |
| v_input_5 | 70 | overBought |
| v_input_6 | 200 | EMA |
Source (PineScript)
/*backtest
start: 2023-10-22 00:00:00
end: 2023-10-29 00:00:00
period: 15m
basePeriod: 5m
exchanges: [{"eid":"Futures_Binance","currency":"BTC_USDT"}]
*/

//@version=5
strategy("RSI Improved strategy", overlay=true)
higherTF1 = input.timeframe('15' , "Resolution", options = ['5', '15', '1H', 'D', 'W', 'M'])
dailyopen = request.security(syminfo.tickerid, higherTF1, close)

Reward = input(1600)
Risk = input(1600)

length = input( 5 )
overSold = input( 30 )
overBought = input( 70 )
EMA = input(200)
price = close

vrsi = ta.rsi(price, length)

RSIlowest =  vrsi[1] > vrsi ? true : false
RSIhighest = vrsi[1] < vrsi ? true : false

//ro = ta.crossunder(vrsi, 20)
//ru = ta.crossover(vrsi, 80)

co = ta.crossunder(vrsi, overSold)
cu = ta.crossunder(vrsi, overBought)

plot(ta.ema(close, EMA))
plot(ta.ema(close, 50), color = color.orange)

UponEMA = close > ta.ema(close, EMA) ? true : false
belowEMA = close < ta.ema(close, EMA) ? true : false
//transfer 'float' to 'int' to 'string'
r = int(vrsi)
value = str.tostring(r)

m = int(strategy.openprofit)
money = str.tostring(m)
if (not na(vrsi))
	//when price stand up on 200ema and rsi is at oversold area, open long position
//	if (co and UponEMA)
  //      strategy.order("Rsi long", strategy.long, 1 , comment = "Rsi long")

    if(vrsi < 20 and RSIlowest)
        // line1 = line.new(x1=bar_index, y1=dailyopen, x2=bar_index+1, y2=dailyopen, xloc=xloc.bar_index, style=line.style_solid,extend=extend.right, color=color.aqua, width = 2)
        // line.delete(line1[1])  // remove the previous line when new bar appears
        // label1 = label.new(x=bar_index, y=dailyopen,yloc=yloc.belowbar, text = value,textcolor = color.white, color = color.green, style = label.style_label_up)
        // label.delete(label1[1])
        strategy.order("Rsi long", strategy.long, 1 , comment = "Rsi long")
        strategy.exit("exit", "Rsi long", profit = Reward, loss = Risk, comment = "Rsi long exit")
//strategy.close("Rsi short", comment = "Rsi close")


	if(vrsi > 80 and RSIhighest)
        // line2 = line.new(x1=bar_index, y1=dailyopen, x2=bar_index+1, y2=dailyopen, xloc=xloc.bar_index, style=line.style_solid,extend=extend.right, color = #e65100, width = 2)
        // line.delete(line2[1])  // remove the previous line when new bar appears
        // label2 = label.new(x=bar_index, y=dailyopen,yloc=yloc.abovebar, text = value, textcolor = color.white, color = color.red)
        // label.delete(label2[1])
        strategy.order("Rsi short",strategy.short, 1,  comment = "Rsi short ")
        strategy.exit("exit", "Rsi short", profit = Reward,loss = Risk, comment = "Rsi short exit")
//	if(UponEMA)
//        strategy.close("Rsi short", comment = "Rsi short close")
//plot(strategy.equity, title="equity", color=color.red, linewidth=2, style=plot.style_cross)
//plotshape(confirmPH, title="Label",offset = 1,text="Bull",style=shape.labeldown,location=location.abovebar,color=color.green,textcolor=color.green)


//when Rsi reaches overbought, draw a Horizontal Ray to close prices, similarly when it comes to oversold.(accomplished)
//detects when there is more lower/higher RSI values, adjust horizontal Ray and label to new posistion.(accomplished)
Detail
https://www.fmz.com/strategy/430596
Last Modified
2023-10-30 17:13:24