
296 lines
13 KiB
Markdown
296 lines
13 KiB
Markdown
|
|
> Name
|
|
|
|
RSI趋势跟踪移动止损策略RSI-Trend-Following-Strategy-with-Trailing-Stop-Loss
|
|
|
|
> Author
|
|
|
|
ChaoZhang
|
|
|
|
> Strategy Description
|
|
|
|
|
|
[trans]
|
|
|
|
## 概述
|
|
|
|
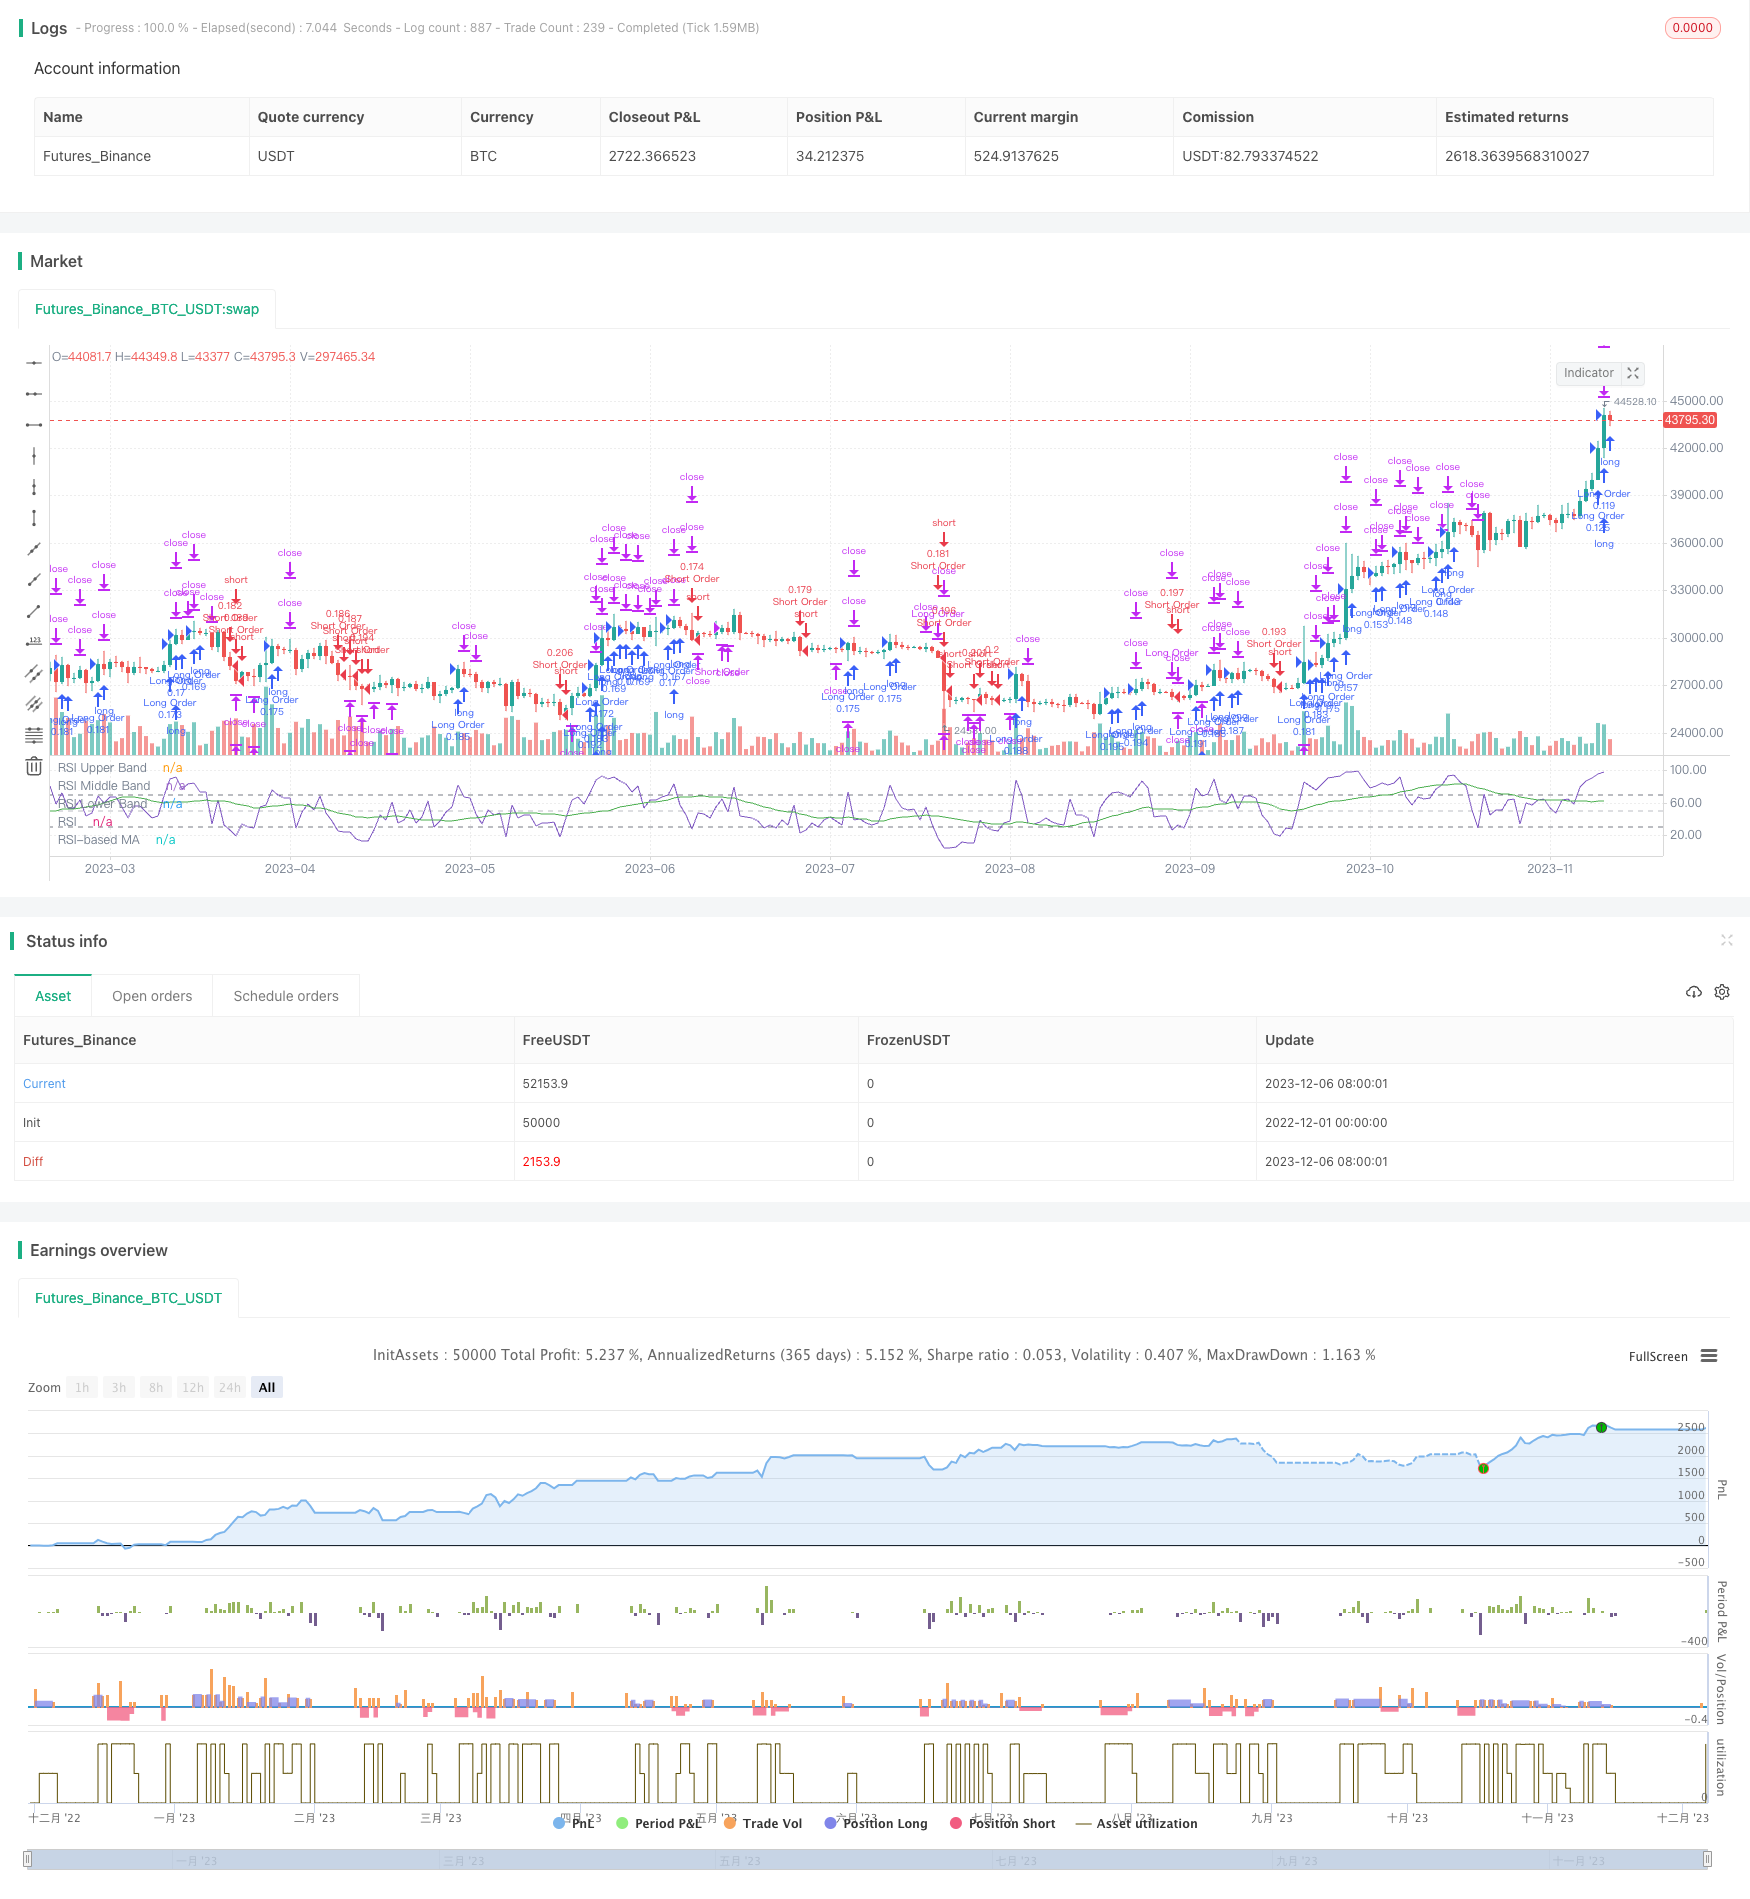
该策略是一个利用RSI指标识别趋势,并结合移动均线进行趋势确认,设置止损止盈的自动交易策略。当RSI大于68并且当前移动平均线上穿之前移动平均线时,做多;当RSI小于28并且当前移动平均线下穿之前移动平均线时,做空。同时设置止损止盈点。
|
|
|
|
## 策略原理
|
|
|
|
该策略主要利用RSI指标判断超买超卖现象识别趋势。当RSI大于70时为超买区,小于30时为超卖区。结合移动平均线的黄金交叉和死亡交叉进行趋势确认。具体交易信号为:
|
|
|
|
多头信号:RSI大于68并且当前移动平均线上穿之前移动平均线,做多。
|
|
空头信号:RSI小于28并且当前移动平均线下穿之前移动平均线,做空。
|
|
|
|
止损止盈设置为每个点位设置不同的止损止盈比例,从更为宽松到更严格,具体为:
|
|
|
|
多头止盈:高点的1.4%止盈一半仓位,高点的0.8%止盈全部平仓。
|
|
多头止损:入场价的2%设止损。
|
|
|
|
空头止盈:低点的0.4%止盈一半仓位,低点的0.8%止盈全部平仓。
|
|
空头止损:入场价的2%设止损。
|
|
|
|
同时当趋势反转时,例如做多时RSI下破30就市价全部平仓;做空时RSI上破60就市价全部平仓。
|
|
|
|
## 策略优势
|
|
|
|
1. 使用RSI指标判断超买超卖现象,避免追高杀跌。
|
|
2. 移动平均线进行趋势过滤,减少非主流方向操作。
|
|
3. 递进止盈设定,让利润最大化。
|
|
4. 较高止损点设定,给予趋势适当空间。
|
|
5. 结合趋势转向指标的反向清仓策略,快速反应突发事件。
|
|
|
|
## 策略风险
|
|
|
|
1. RSI参数设置问题,导致识别效果欠佳。
|
|
2. 移动平均线参数设置问题,导致滤波效果不佳。
|
|
3. 止损点过于宽松,亏损扩大的风险。
|
|
4. 止盈点过于偏紧,盈利无法最大化。
|
|
5. 反转清仓策略判断失误,造成不必要亏损。
|
|
|
|
针对以上风险,参数要多次测试优化。止损止盈设置要适当,宽松一定区间,并视市场波动度调整参数。清仓策略要审慎,避免因指标误判带来损失。
|
|
|
|
## 优化方向
|
|
|
|
可以从以下几个方面进一步优化:
|
|
|
|
1. 增加更多滤波指标,提高信号准确率。例如增设交易量过滤。
|
|
2. 调整止损策略,追踪最高价最低价,实现移动止损。
|
|
3. 调整部分止盈为跟踪止盈,让利润最大化。
|
|
4. 增加数据源切换,不同品种使用不同周期等参数组合。
|
|
5. 增加期货空仓持有成本考量,动态调整止损止盈。
|
|
|
|
## 总结
|
|
|
|
该策略整体是一个较为成熟可靠的趋势跟踪策略。利用RSI判断超买超卖现象确定交易方向。运用移动平均线进行滤波确认。同时设置恰当的止损和递进止盈。能够在趋势中获得较好收益。如果参数调优到位,在趋势行情中表现优异。通过进一步优化后可以获得更出色表现。
|
|
|
|
||
|
|
|
|
## Overview
|
|
|
|
This strategy is an automated trading strategy that identifies trend using the RSI indicator and confirms the trend with moving averages, with stop loss and take profit settings. It goes long when RSI goes above 68 and the current moving average crosses above the previous moving average, and goes short when RSI drops below 28 and the current moving average crosses below the previous moving average. Stop loss and take profit points are also configured.
|
|
|
|
## Strategy Logic
|
|
|
|
The strategy mainly uses the RSI indicator to identify overbought and oversold conditions to determine the trend. Values above 70 for RSI indicate an overbought condition and values below 30 indicate an oversold condition. The trend is confirmed using the golden cross and death cross signals from the moving averages. The specific trading signals are:
|
|
|
|
Long signal: RSI goes above 68 and current moving average crosses above previous moving average, go long.
|
|
Short signal: RSI goes below 28 and current moving average crosses below previous moving average, go short.
|
|
|
|
The stop loss and take profit settings are staggered, from more loose to more strict:
|
|
|
|
Long take profit: Take profit 50% of position at 1.4% above the high, take profit 100% at 0.8% above the high.
|
|
Long stop loss: Set stop loss at 2% below the entry price.
|
|
|
|
Short take profit: Take profit 50% of position at 0.4% below the low, take profit 100% at 0.8% below the low.
|
|
Short stop loss: Set stop loss at 2% above the entry price.
|
|
|
|
Also, when trend reverses, like RSI breaking below 30 when long, close entire long position at market; when RSI breaks above 60 when short, close entire short position at market.
|
|
|
|
## Advantages
|
|
|
|
1. Use RSI to determine overbought/oversold to avoid buying high and selling low.
|
|
2. Filters with moving averages to reduce trades against the major trend.
|
|
3. Staggered take profit targets to maximize profits.
|
|
4. Wider stop loss allows for some retracement.
|
|
5. Trend reversal based position closing reacts fast to sudden events.
|
|
|
|
## Risks
|
|
|
|
1. Poor RSI parameter tuning leading to inaccurate signals.
|
|
2. Poor moving average parameter tuning leading to weak filtering.
|
|
3. Stop loss too wide leading to large losses.
|
|
4. Take profit too tight leaving profits on the table.
|
|
5. Inaccurate reversal signal closing positions unnecessarily.
|
|
|
|
To address the above risks, extensive parameter tuning should be done. Stop loss and take profit should also be set appropriately based on market volatility. Reversal signals should be used carefully to avoid unnecessary losses.
|
|
|
|
## Enhancement Opportunities
|
|
|
|
The strategy can be further improved:
|
|
|
|
1. Add more filters like volume to improve signal accuracy.
|
|
2. Implement trailing stop loss to lock in profits.
|
|
3. Use trailing take profit for some exits to maximize profits.
|
|
4. Add instrument switching for using optimal parameters.
|
|
5. Incorporate cost of carry for futures to dynamically adjust stops.
|
|
|
|
## Conclusion
|
|
|
|
Overall this is a mature and reliable trend following strategy. It identifies trend well using RSI and further filters with moving averages. It also implements sensible stop loss and staggered take profit settings. It can perform very well in trending markets if tuned appropriately. Further optimizations can lead to even better performance.
|
|
|
|
[/trans]
|
|
|
|
> Strategy Arguments
|
|
|
|
|
|
|
|
|Argument|Default|Description|
|
|
|----|----|----|
|
|
|v_input_int_3|true|Start Date|
|
|
|v_input_int_4|6|Start Month|
|
|
|v_input_int_5|2022|Start Year|
|
|
|v_input_1|2|Return Precision|
|
|
|v_input_int_1|4|(?RSI Settings)RSI Length|
|
|
|v_input_source_1_close|0|Source: close|high|low|open|hl2|hlc3|hlcc4|ohlc4|
|
|
|v_input_string_1|0|(?MA Settings)MA Type: SMA|Bollinger Bands|EMA|SMMA (RMA)|WMA|VWMA|
|
|
|v_input_int_2|23|MA Length|
|
|
|v_input_float_1|2|BB StdDev|
|
|
|
|
|
|
> Source (PineScript)
|
|
|
|
``` pinescript
|
|
// © CRabbit
|
|
//@version=5
|
|
|
|
// Starting with $100 and using 10% of the account per trade
|
|
strategy("RSI Template", shorttitle="RSI", overlay=false, initial_capital=100, default_qty_value=10, default_qty_type=strategy.percent_of_equity)
|
|
|
|
// RSI Indicator
|
|
ma(source, length, type) =>
|
|
switch type
|
|
"SMA" => ta.sma(source, length)
|
|
"Bollinger Bands" => ta.sma(source, length)
|
|
"EMA" => ta.ema(source, length)
|
|
"SMMA (RMA)" => ta.rma(source, length)
|
|
"WMA" => ta.wma(source, length)
|
|
"VWMA" => ta.vwma(source, length)
|
|
|
|
rsiLengthInput = input.int(4, minval=1, title="RSI Length", group="RSI Settings")
|
|
rsiSourceInput = input.source(close, "Source", group="RSI Settings")
|
|
maTypeInput = input.string("SMA", title="MA Type", options=["SMA", "Bollinger Bands", "EMA", "SMMA (RMA)", "WMA", "VWMA"], group="MA Settings")
|
|
maLengthInput = input.int(23, title="MA Length", group="MA Settings")
|
|
bbMultInput = input.float(2.0, minval=0.001, maxval=50, title="BB StdDev", group="MA Settings")
|
|
|
|
up = ta.rma(math.max(ta.change(rsiSourceInput), 0), rsiLengthInput)
|
|
down = ta.rma(-math.min(ta.change(rsiSourceInput), 0), rsiLengthInput)
|
|
rsi = down == 0 ? 100 : up == 0 ? 0 : 100 - (100 / (1 + up / down))
|
|
rsiMA = ma(rsi, maLengthInput, maTypeInput)
|
|
isBB = maTypeInput == "Bollinger Bands"
|
|
|
|
plot(rsi, "RSI", color=#7E57C2)
|
|
plot(rsiMA, "RSI-based MA", color=color.green)
|
|
rsiUpperBand = hline(70, "RSI Upper Band", color=#787B86)
|
|
hline(50, "RSI Middle Band", color=color.new(#787B86, 50))
|
|
rsiLowerBand = hline(30, "RSI Lower Band", color=#787B86)
|
|
fill(rsiUpperBand, rsiLowerBand, color=color.rgb(126, 87, 194, 90), title="RSI Background Fill")
|
|
|
|
|
|
// Configure backtest start date with inputs
|
|
startDate = input.int(title="Start Date", defval=1, minval=1, maxval=31)
|
|
startMonth = input.int(title="Start Month", defval=6, minval=1, maxval=12)
|
|
startYear = input.int(title="Start Year", defval=2022, minval=1800, maxval=2100)
|
|
|
|
// See if this bar's time happened on/after start date
|
|
afterStartDate = (time >= timestamp(syminfo.timezone,
|
|
startYear, startMonth, startDate, 0, 0))
|
|
|
|
|
|
// Long and Short buy strategy
|
|
// Submit a market open/ close Long order, but only on/after start date
|
|
if (afterStartDate)
|
|
if rsi > 68 and (rsiMA > rsiMA[1])
|
|
strategy.entry("Long Order", strategy.long, comment="ENTER-LONG")
|
|
if rsi < 30
|
|
strategy.close("Long Order", alert_message="L-CL")
|
|
|
|
strategy.exit("L-TP1", from_entry="Long Order", limit=high * 1.004, qty_percent=50, alert_message="L-TP1" + str.tostring(high * 1.004))
|
|
strategy.exit("L-TP2", from_entry="Long Order", limit=high * 1.008, qty_percent=100, alert_message="L-TP2" + str.tostring(high * 1.008))
|
|
strategy.exit("Exit Long", from_entry="Long Order", stop=low * 0.98, alert_message="L-SL" + str.tostring(low * 0.98))
|
|
|
|
|
|
// Submit a market Open/ Close Short order, but only on/after start date
|
|
if (afterStartDate)
|
|
if rsi < 28 and (rsiMA < rsiMA[1])
|
|
strategy.entry("Short Order", strategy.short, comment="ENTER-SHORT")
|
|
if rsi > 60
|
|
strategy.close("Short Order", alert_message="S-CL")
|
|
|
|
strategy.exit("S-TP1", from_entry="Short Order", limit=low * 0.996, qty_percent=50, alert_message="S-TP1" + str.tostring(low * 0.996))
|
|
strategy.exit("S-TP2", from_entry="Short Order", limit=low * 0.992, qty_percent=100, alert_message="S-TP2" + str.tostring(low * 0.992))
|
|
strategy.exit("Exit Short", from_entry="Short Order", stop=high * 1.02, alert_message="S-SL" + str.tostring(high * 1.02))
|
|
|
|
// MONTHLY TABLE //
|
|
|
|
prec = input(2, title = "Return Precision")
|
|
|
|
new_month = month(time) != month(time[1])
|
|
new_year = year(time) != year(time[1])
|
|
|
|
eq = strategy.equity
|
|
|
|
bar_pnl = eq / eq[1] - 1
|
|
|
|
cur_month_pnl = 0.0
|
|
cur_year_pnl = 0.0
|
|
|
|
// Current Monthly P&L
|
|
cur_month_pnl := new_month ? 0.0 :
|
|
(1 + cur_month_pnl[1]) * (1 + bar_pnl) - 1
|
|
|
|
// Current Yearly P&L
|
|
cur_year_pnl := new_year ? 0.0 :
|
|
(1 + cur_year_pnl[1]) * (1 + bar_pnl) - 1
|
|
|
|
// Arrays to store Yearly and Monthly P&Ls
|
|
var month_pnl = array.new_float(0)
|
|
var month_time = array.new_int(0)
|
|
|
|
var year_pnl = array.new_float(0)
|
|
var year_time = array.new_int(0)
|
|
|
|
if (not na(cur_month_pnl[1]) and (new_month or barstate.islast))
|
|
array.push(month_pnl , cur_month_pnl[1])
|
|
array.push(month_time, time[1])
|
|
|
|
if (not na(cur_year_pnl[1]) and (new_year or barstate.islast))
|
|
array.push(year_pnl , cur_year_pnl[1])
|
|
array.push(year_time, time[1])
|
|
|
|
// Monthly P&L Table
|
|
var monthly_table = table(na)
|
|
|
|
if (barstate.islast)
|
|
monthly_table := table.new(position.bottom_right, columns = 14, rows = array.size(year_pnl) + 1, border_width = 1)
|
|
|
|
table.cell(monthly_table, 0, 0, "", bgcolor = #cccccc)
|
|
table.cell(monthly_table, 1, 0, "Jan", bgcolor = #cccccc)
|
|
table.cell(monthly_table, 2, 0, "Feb", bgcolor = #cccccc)
|
|
table.cell(monthly_table, 3, 0, "Mar", bgcolor = #cccccc)
|
|
table.cell(monthly_table, 4, 0, "Apr", bgcolor = #cccccc)
|
|
table.cell(monthly_table, 5, 0, "May", bgcolor = #cccccc)
|
|
table.cell(monthly_table, 6, 0, "Jun", bgcolor = #cccccc)
|
|
table.cell(monthly_table, 7, 0, "Jul", bgcolor = #cccccc)
|
|
table.cell(monthly_table, 8, 0, "Aug", bgcolor = #cccccc)
|
|
table.cell(monthly_table, 9, 0, "Sep", bgcolor = #cccccc)
|
|
table.cell(monthly_table, 10, 0, "Oct", bgcolor = #cccccc)
|
|
table.cell(monthly_table, 11, 0, "Nov", bgcolor = #cccccc)
|
|
table.cell(monthly_table, 12, 0, "Dec", bgcolor = #cccccc)
|
|
table.cell(monthly_table, 13, 0, "Year", bgcolor = #999999)
|
|
|
|
|
|
for yi = 0 to array.size(year_pnl) - 1
|
|
table.cell(monthly_table, 0, yi + 1, str.tostring(year(array.get(year_time, yi))), bgcolor = #cccccc)
|
|
|
|
y_color = array.get(year_pnl, yi) > 0 ? color.new(color.green, transp = 50) : color.new(color.red, transp = 50)
|
|
table.cell(monthly_table, 13, yi + 1, str.tostring(math.round(array.get(year_pnl, yi) * 100, prec)), bgcolor = y_color)
|
|
|
|
for mi = 0 to array.size(month_time) - 1
|
|
m_row = year(array.get(month_time, mi)) - year(array.get(year_time, 0)) + 1
|
|
m_col = month(array.get(month_time, mi))
|
|
m_color = array.get(month_pnl, mi) > 0 ? color.new(color.green, transp = 70) : color.new(color.red, transp = 70)
|
|
|
|
table.cell(monthly_table, m_col, m_row, str.tostring(math.round(array.get(month_pnl, mi) * 100, prec)), bgcolor = m_color)
|
|
|
|
```
|
|
|
|
> Detail
|
|
|
|
https://www.fmz.com/strategy/434679
|
|
|
|
> Last Modified
|
|
|
|
2023-12-08 11:41:31
|