
19 KiB
Name
RSI真实区域突破策略RSI-True-Level-Breakout-Strategy
Author
ChaoZhang
Strategy Description
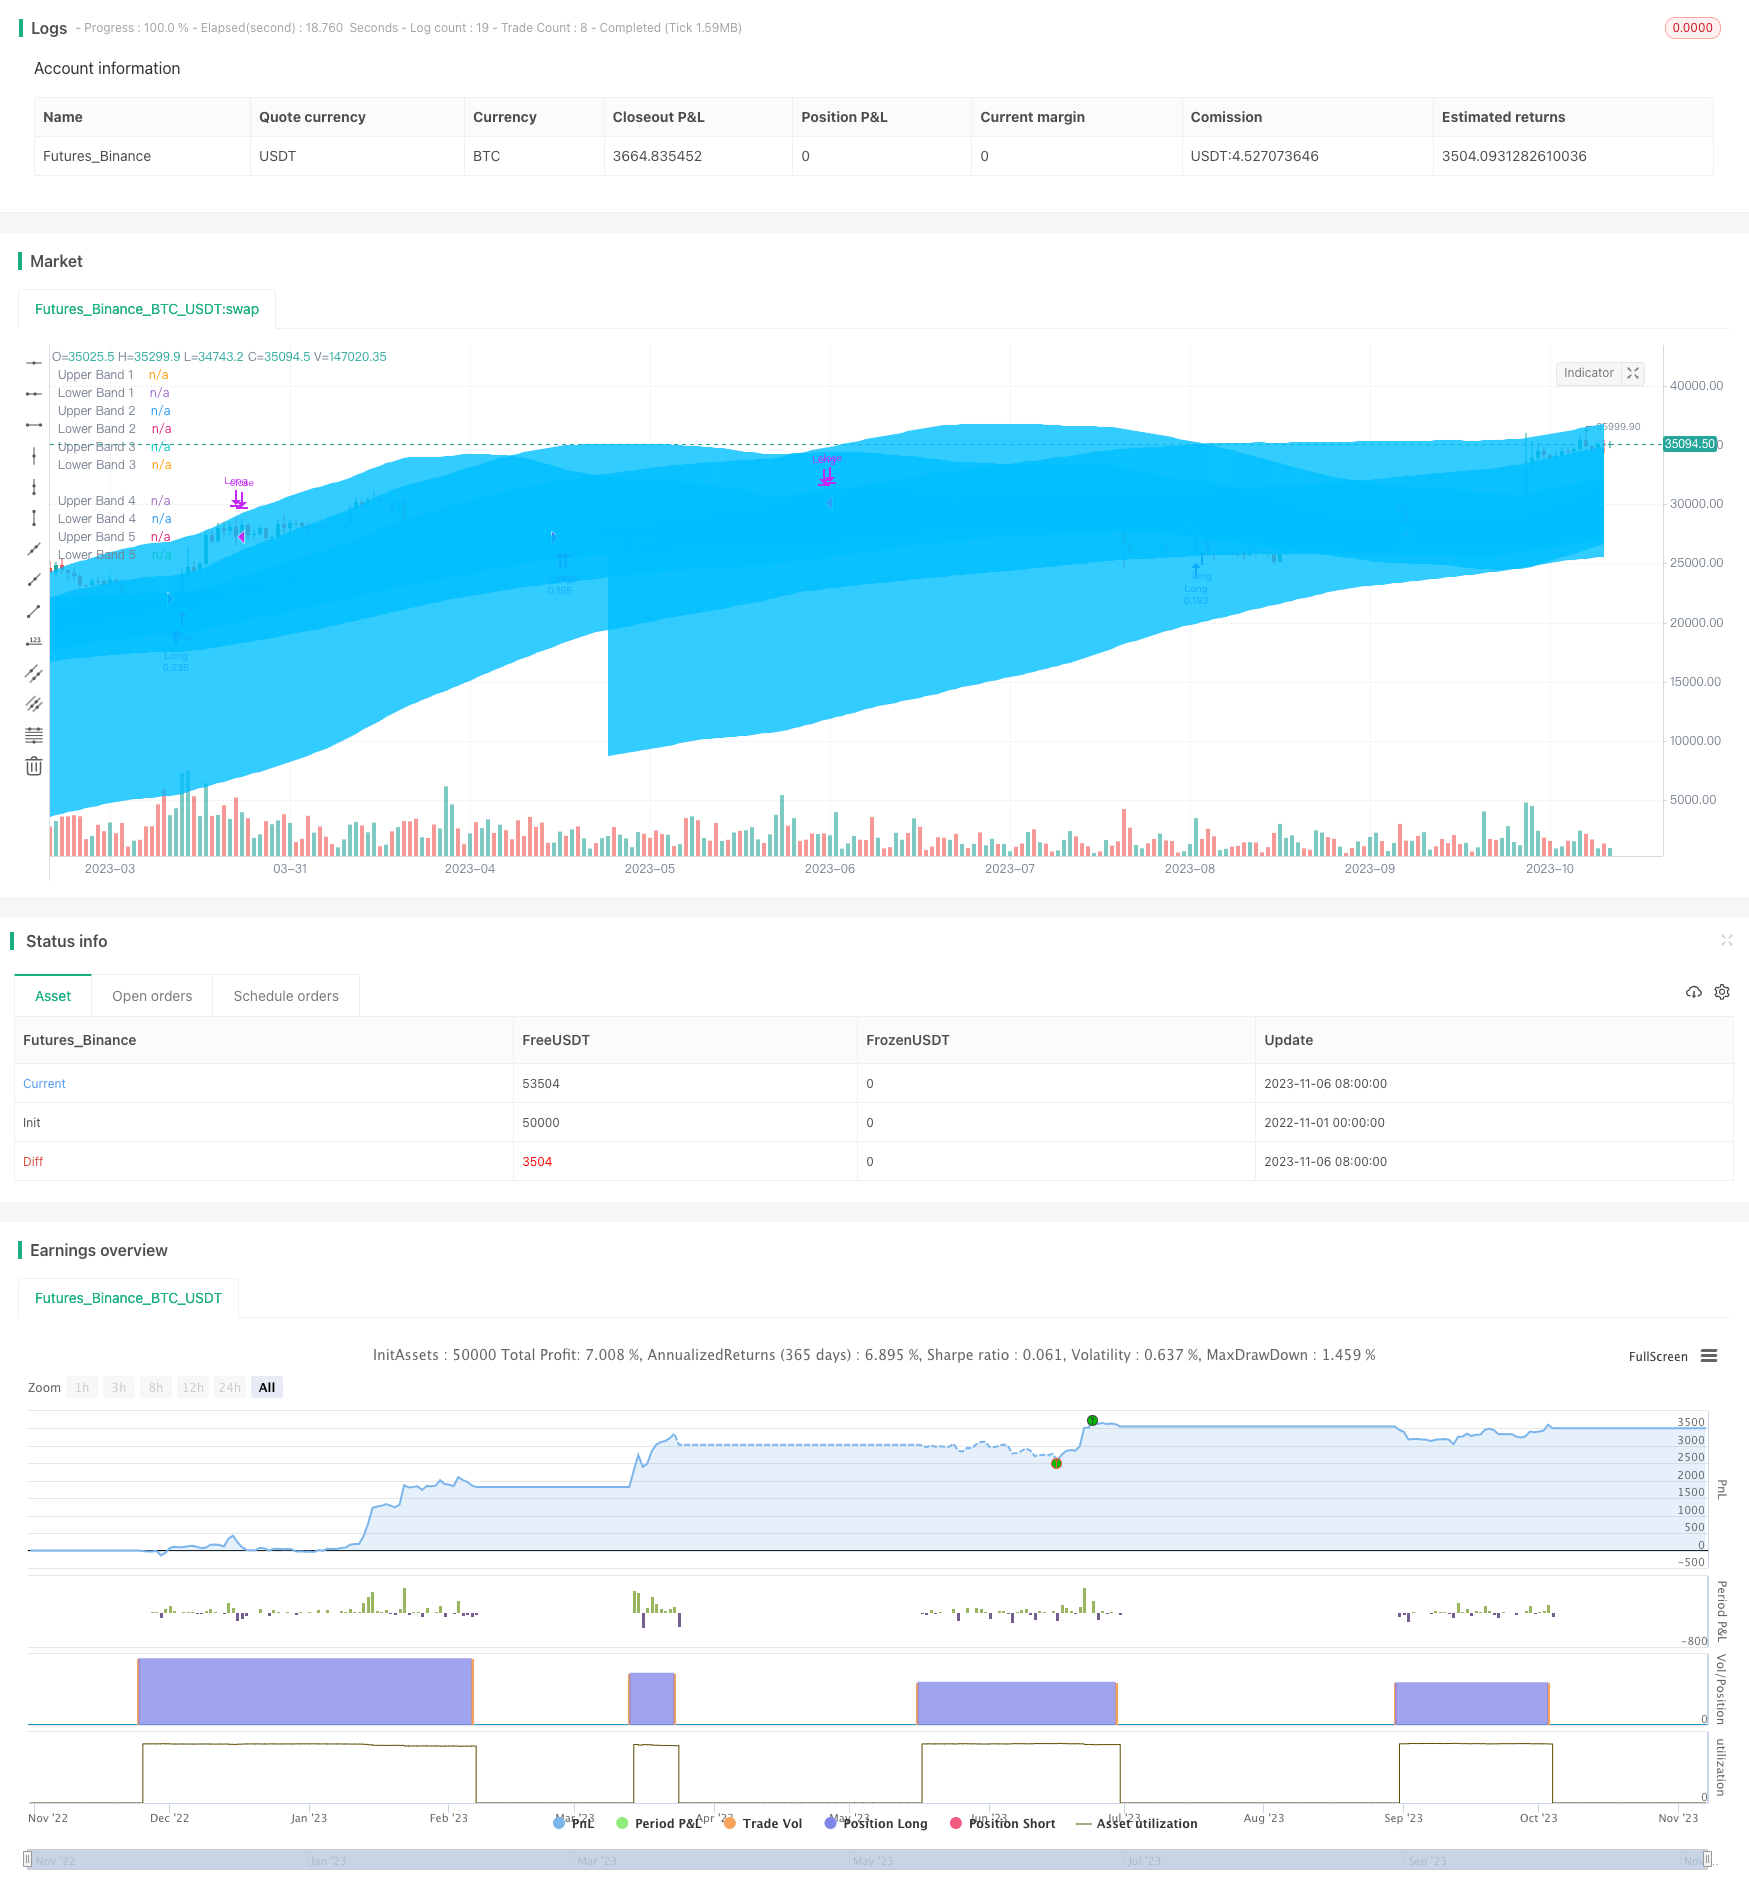 [trans]
概述
RSI真实区域突破策略是一种利用 RSI 指标与真实区域震荡区间进行结合,实现突破交易的量化策略。该策略通过计算真实区域的上下限带,并结合 RSI 指标的过买过卖信号进行突破交易。在强势行情中,它能够提前捕捉趋势方向;而在震荡行情中,它能够有效过滤噪音,锁定较大方向性机会。
策略原理
该策略首先需要手动设置14个不同参数的真实区域上下限。真实区域的计算方式是以收盘价为基础,计算一定周期内的标准差和线性回归值,上限线为 线性回归线+n倍标准差,下限线为线性回归线-n倍标准差。参数n可以通过界面调节。这样可以画出14条不同参数的真实区域上下限线。
之后,策略在每个周期内会实时计算14条限位线中最高的作为真实区域上限,最低的作为真实区域下限。再结合RSI指标的数值,判断其是否进入超买或超卖区间。当RSI指标进入超买区或价格跌破真实区域上限时,做空;当RSI指标进入超卖区或价格涨破真实区域下限时,做多。
最后,策略还设置了入场线和出场线。入场线代表真实区域下限,出场线代表真实区域上限。这样在开仓后,价格再次触碰出场线就会止损出场。
总的来说,该策略同时利用了趋势指标RSI和自适应真实区域通道的优势,能够有效判断市场趋势方向,在震荡行情中发现较大方向性机会,并以真实区域出场线进行风险控制。
策略优势
-
使用自适应真实区域。该区域上下限能够实时变化,适应市场波动。
-
真实区域参数可调。用户可以选择不同的参数组合,适应不同市场环境。
-
结合RSI指标判定超买超卖现象,避免在震荡行情中错失方向。
-
入场线和出场线设定合理,可以控制风险。
策略风险
-
RSI指标参数设置需要谨慎。RSI周期过短易产生误导信号,过长则无法及时捕捉转折。
-
真实区域参数设置需要测试优化。参数过大过小都会影响策略表现。
-
震荡剧烈行情中止损风险较大。价格可能在真实区域内频繁触碰出场线造成过多损失。
-
真实区域需要一定周期形成。在数据不足情况下,该策略可能无法正常工作。
可以通过优化RSI参数,调整真实区域参数,并结合其它指标确认入场时机来降低误交易风险。也可以适当放宽出场线降低止损风险。总体来说,需要针对不同市场环境做出适当调整。
策略优化方向
-
优化RSI参数设置,寻找最佳参数组合。可以测试不同的RSI周期参数。
-
优化真实区域参数,找到最适合当前市场环境的参数设置。
-
增加其它指标过滤,例如MACD,KD等,避免在震荡行情中产生错误交易。
-
设置不同的交易时间或品种,适应策略适用的具体交易环境。
-
优化止损策略,例如选用振荡止损,或根据ATR来设置止损幅度。
-
进行参数组合测试,找到策略最大稳定收益的参数设置。
-
增加机器学习算法,利用大数据自动优化参数。
总结
RSI真实区域突破策略综合运用了趋势指标和自适应通道技术的优势。它能够有效判断市场趋势方向,在震荡行情中捕捉较大方向性机会。同时设置止损线进行风险控制。该策略参数优化空间大,可以通过调整参数适应不同的市场环境,是一个非常灵活的突破策略。总体而言,它融合了多个指标的优势,在趋势判断和风险控制方面都有一定优势,是一个值得推荐的量化策略。
||
Overview
The RSI True Level breakout strategy combines the RSI indicator with adaptive True Level channels to implement breakout trading. It calculates True Level upper and lower bands and uses RSI overbought/oversold signals to generate breakout trades. In trending markets, it can early capture the trend direction. In range-bound markets, it can effectively filter out noise and catch significant directional opportunities.
Strategy Logic
The strategy first requires manually setting 14 True Level bands with different parameters. True Levels are calculated based on closing prices, standard deviation and linear regression over a certain period. The upper band is linear regression + n standard deviations. The lower band is linear regression - n standard deviations. The n can be adjusted through the input panel. This plots 14 True Level bands with different parameters.
Next, the strategy calculates the highest of the 14 bands as the True Level upper band, and the lowest as the lower band in each period. Combined with the RSI indicator values, it determines if RSI enters overbought or oversold zones. When RSI is overbought or price breaks below the upper band, it goes short. When RSI is oversold or price breaks above the lower band, it goes long.
Finally, entry and exit bands are set. The entry band is the lower True Level and the exit band is the upper True Level. After opening positions, prices touching the exit band again will close the trades.
In summary, the strategy utilizes both the trending strength of RSI and the adaptive ability of True Level channels to effectively determine trend direction, catch big opportunities in range-bound markets, and control risk with the exit bands.
Advantages
-
Uses adaptive True Level zones. The upper and lower bands change dynamically to adapt to market fluctuations.
-
Customizable True Level parameters. Users can optimize parameters for different market conditions.
-
Combines RSI overbought/oversold to avoid whipsaws in sideways markets.
-
Reasonable entry and exit line design controls risk.
Risks
-
RSI parameters need careful optimization. Wrong values may generate bad signals.
-
True Level parameters need testing and optimization. Unsuitable settings could undermine performance.
-
High whipsaw risk in choppy markets when prices hit exit bands frequently.
-
True Level bands need sufficient period to form. The strategy may fail with inadequate data.
Risks can be mitigated by optimizing RSI parameters, adjusting True Level settings, adding filters and using wise exits. Parameters should be tuned for different market environments.
Optimization Directions
-
Optimize RSI parameters to find best settings. Test different RSI periods.
-
Optimize True Level parameters for current markets.
-
Add other filters like MACD, KD to avoid bad trades in choppy markets.
-
Test different trading times or products to find optimal environment.
-
Optimize exits, like trailing stops or ATR-based stops.
-
Combine parameters and test for maximum stability.
-
Utilize machine learning and big data to auto optimize.
Conclusion
The RSI True Level breakout strategy combines the strengths of a trend indicator and adaptive channels. It can effectively determine trend direction and catch big opportunities in range-bound markets while controlling risk with stop loss. The high parameter customization allows tuning it for different market conditions. Overall, by integrating multiple indicators, it has advantages in trend determination and risk control. With further optimization, it is a recommended quantitative trading strategy.
[/trans]
Strategy Arguments
| Argument | Default | Description |
|---|---|---|
| v_input_1 | 14 | RSI Period |
| v_input_2 | 65 | RSI Overbought Level |
| v_input_3 | 40 | RSI Oversold Level |
| v_input_4 | 12 | Entry TrueLevel Band |
| v_input_5 | 12 | Exit TrueLevel Band |
| v_input_6 | false | Enable Long and Short |
| v_input_7 | 126 | Length 1 |
| v_input_8 | 189 | Length 2 |
| v_input_9 | 252 | Length 3 |
| v_input_10 | 378 | Length 4 |
| v_input_11 | 504 | Length 5 |
| v_input_12 | 630 | Length 6 |
| v_input_13 | 756 | Length 7 |
| v_input_14 | 1008 | Length 8 |
| v_input_15 | 1260 | Length 9 |
| v_input_16 | 1638 | Length 10 |
| v_input_17 | 2016 | Length 11 |
| v_input_18 | 2646 | Length 12 |
| v_input_19 | 3276 | Length 13 |
| v_input_20 | 4284 | Length 14 |
| v_input_21 | #00bfff | Fill Color |
| v_input_22 | 0 | Multiple: 1 |
| v_input_23_close | 0 | Source: close |
Source (PineScript)
/*backtest
start: 2022-11-01 00:00:00
end: 2023-11-07 00:00:00
period: 1d
basePeriod: 1h
exchanges: [{"eid":"Futures_Binance","currency":"BTC_USDT"}]
*/

// This source code is subject to the terms of the Mozilla Public License 2.0 at https://mozilla.org/MPL/2.0/
// © Julien_Eche

//@version=4
strategy("RSI TrueLevel Strategy", shorttitle="RSI TL", overlay=true, default_qty_type=strategy.percent_of_equity, default_qty_value=10)

// Input parameters for RSI
rsiPeriod = input(14, title="RSI Period", type=input.integer)
rsiOverbought = input(65, title="RSI Overbought Level", type=input.integer)
rsiOversold = input(40, title="RSI Oversold Level", type=input.integer)

// Inputs for selecting bands
entry_band = input(12, title="Entry TrueLevel Band", type=input.integer, minval=1, maxval=14)
exit_band = input(12, title="Exit TrueLevel Band", type=input.integer, minval=1, maxval=14)

// Input for long and short mode
long_and_short = input(false, title="Enable Long and Short", type=input.bool)

// Calculate the RSI
rsi = rsi(close, rsiPeriod)

// User inputs
len1 = input(title="Length 1", type=input.integer, defval=126)
len2 = input(title="Length 2", type=input.integer, defval=189)
len3 = input(title="Length 3", type=input.integer, defval=252)
len4 = input(title="Length 4", type=input.integer, defval=378)
len5 = input(title="Length 5", type=input.integer, defval=504)
len6 = input(title="Length 6", type=input.integer, defval=630)
len7 = input(title="Length 7", type=input.integer, defval=756)
len8 = input(title="Length 8", type=input.integer, defval=1008)
len9 = input(title="Length 9", type=input.integer, defval=1260)
len10 = input(title="Length 10", type=input.integer, defval=1638)
len11 = input(title="Length 11", type=input.integer, defval=2016)
len12 = input(title="Length 12", type=input.integer, defval=2646)
len13 = input(title="Length 13", type=input.integer, defval=3276)
len14 = input(title="Length 14", type=input.integer, defval=4284)

fill_color = input(title="Fill Color", type=input.color, defval=color.rgb(0, 191, 255, 95))
mult = input(title="Multiple", type=input.float, defval=1, step=0.2, options=[0.6, 0.8, 1, 1.2, 1.4])
src = input(title="Source", type=input.source, defval=close)

// Upper band calculation function
upperBand(length) =>
    linreg = linreg(src, length, 0)
    stddev = mult * stdev(src, length)
    upperband = linreg + stddev
    upperband

// Lower band calculation function
lowerBand(length) =>
    linreg = linreg(src, length, 0)
    stddev = mult * stdev(src, length)
    lowerband = linreg - stddev
    lowerband

// Calculate upper and lower bands for each length
upperband_1 = upperBand(len1)
upperband_2 = upperBand(len2)
upperband_3 = upperBand(len3)
upperband_4 = upperBand(len4)
upperband_5 = upperBand(len5)
upperband_6 = upperBand(len6)
upperband_7 = upperBand(len7)
upperband_8 = upperBand(len8)
upperband_9 = upperBand(len9)
upperband_10 = upperBand(len10)
upperband_11 = upperBand(len11)
upperband_12 = upperBand(len12)
upperband_13 = upperBand(len13)
upperband_14 = upperBand(len14)

lowerband_1 = lowerBand(len1)
lowerband_2 = lowerBand(len2)
lowerband_3 = lowerBand(len3)
lowerband_4 = lowerBand(len4)
lowerband_5 = lowerBand(len5)
lowerband_6 = lowerBand(len6)
lowerband_7 = lowerBand(len7)
lowerband_8 = lowerBand(len8)
lowerband_9 = lowerBand(len9)
lowerband_10 = lowerBand(len10)
lowerband_11 = lowerBand(len11)
lowerband_12 = lowerBand(len12)
lowerband_13 = lowerBand(len13)
lowerband_14 = lowerBand(len14)

// Plot envelope bands for each length
upperband_1_plot = plot(upperband_1, color=color.rgb(14, 116, 212, 95), linewidth=1, title="Upper Band 1")
lowerband_1_plot = plot(lowerband_1, color=color.rgb(14, 116, 212, 95), linewidth=1, title="Lower Band 1")

upperband_2_plot = plot(upperband_2, color=color.rgb(14, 116, 212, 95), linewidth=1, title="Upper Band 2")
lowerband_2_plot = plot(lowerband_2, color=color.rgb(14, 116, 212, 95), linewidth=1, title="Lower Band 2")

upperband_3_plot = plot(upperband_3, color=color.rgb(14, 116, 212, 95), linewidth=1, title="Upper Band 3")
lowerband_3_plot = plot(lowerband_3, color=color.rgb(14, 116, 212, 95), linewidth=1, title="Lower Band 3")

upperband_4_plot = plot(upperband_4, color=color.rgb(14, 116, 212, 95), linewidth=1, title="Upper Band 4")
lowerband_4_plot = plot(lowerband_4, color=color.rgb(14, 116, 212, 95), linewidth=1, title="Lower Band 4")

upperband_5_plot = plot(upperband_5, color=color.rgb(14, 116, 212, 95), linewidth=1, title="Upper Band 5")
lowerband_5_plot = plot(lowerband_5, color=color.rgb(14, 116, 212, 95), linewidth=1, title="Lower Band 5")

upperband_6_plot = plot(upperband_6, color=color.rgb(14, 116, 212, 95), linewidth=1, title="Upper Band 6")
lowerband_6_plot = plot(lowerband_6, color=color.rgb(14, 116, 212, 95), linewidth=1, title="Lower Band 6")

upperband_7_plot = plot(upperband_7, color=color.rgb(14, 116, 212, 95), linewidth=1, title="Upper Band 7")
lowerband_7_plot = plot(lowerband_7, color=color.rgb(14, 116, 212, 95), linewidth=1, title="Lower Band 7")

upperband_8_plot = plot(upperband_8, color=color.rgb(14, 116, 212, 95), linewidth=1, title="Upper Band 8")
lowerband_8_plot = plot(lowerband_8, color=color.rgb(14, 116, 212, 95), linewidth=1, title="Lower Band 8")

upperband_9_plot = plot(upperband_9, color=color.rgb(14, 116, 212, 95), linewidth=1, title="Upper Band 9")
lowerband_9_plot = plot(lowerband_9, color=color.rgb(14, 116, 212, 95), linewidth=1, title="Lower Band 9")

upperband_10_plot = plot(upperband_10, color=color.rgb(14, 116, 212, 95), linewidth=1, title="Upper Band 10")
lowerband_10_plot = plot(lowerband_10, color=color.rgb(14, 116, 212, 95), linewidth=1, title="Lower Band 10")

upperband_11_plot = plot(upperband_11, color=color.rgb(14, 116, 212, 95), linewidth=1, title="Upper Band 11")
lowerband_11_plot = plot(lowerband_11, color=color.rgb(14, 116, 212, 95), linewidth=1, title="Lower Band 11")

upperband_12_plot = plot(upperband_12, color=color.rgb(14, 116, 212, 95), linewidth=1, title="Upper Band 12")
lowerband_12_plot = plot(lowerband_12, color=color.rgb(14, 116, 212, 95), linewidth=1, title="Lower Band 12")

upperband_13_plot = plot(upperband_13, color=color.rgb(14, 116, 212, 95), linewidth=1, title="Upper Band 13")
lowerband_13_plot = plot(lowerband_13, color=color.rgb(14, 139, 212, 95), linewidth=1, title="Lower Band 13")

upperband_14_plot = plot(upperband_14, color=color.rgb(14, 116, 212, 95), linewidth=1, title="Upper Band 14")
lowerband_14_plot = plot(lowerband_14, color=color.rgb(14, 139, 212, 95), linewidth=1, title="Lower Band 14")


// Plot fills for each length
fill(upperband_1_plot, lowerband_1_plot, color=fill_color, title="Fill 1")
fill(upperband_2_plot, lowerband_2_plot, color=fill_color, title="Fill 2")
fill(upperband_3_plot, lowerband_3_plot, color=fill_color, title="Fill 3")
fill(upperband_4_plot, lowerband_4_plot, color=fill_color, title="Fill 4")
fill(upperband_5_plot, lowerband_5_plot, color=fill_color, title="Fill 5")
fill(upperband_6_plot, lowerband_6_plot, color=fill_color, title="Fill 6")
fill(upperband_7_plot, lowerband_7_plot, color=fill_color, title="Fill 7")
fill(upperband_8_plot, lowerband_8_plot, color=fill_color, title="Fill 8")
fill(upperband_9_plot, lowerband_9_plot, color=fill_color, title="Fill 9")
fill(upperband_10_plot, lowerband_10_plot, color=fill_color, title="Fill 10")
fill(upperband_11_plot, lowerband_11_plot, color=fill_color, title="Fill 11")
fill(upperband_12_plot, lowerband_12_plot, color=fill_color, title="Fill 12")
fill(upperband_13_plot, lowerband_13_plot, color=fill_color, title="Fill 13")
fill(upperband_14_plot, lowerband_14_plot, color=fill_color, title="Fill 14")

// Add variables to store the highest upper band and lowest lower band values
var float highestUpperBand = na
var float lowestLowerBand = na

// Calculate the trueLevelUpperBand and trueLevelLowerBand
trueLevelUpperBand = max(upperband_1, max(upperband_2, max(upperband_3, max(upperband_4, max(upperband_5, max(upperband_6, max(upperband_7, max(upperband_8, max(upperband_9, max(upperband_10, max(upperband_11, max(upperband_12, max(upperband_13, upperband_14)))))))))))))
trueLevelLowerBand = min(lowerband_1, min(lowerband_2, min(lowerband_3, min(lowerband_4, min(lowerband_5, min(lowerband_6, min(lowerband_7, min(lowerband_8, min(lowerband_9, min(lowerband_10, min(lowerband_11, min(lowerband_12, min(lowerband_13, lowerband_14)))))))))))))

// Update the highest upper band and lowest lower band
highestUpperBand := highest(trueLevelUpperBand, 1)
lowestLowerBand := lowest(trueLevelLowerBand, 1)

// Store the upper and lower bands in an array for easy access
upperbands = array.new_float(14)
lowerbands = array.new_float(14)

array.set(upperbands, 0, upperband_1)
array.set(upperbands, 1, upperband_2)
array.set(upperbands, 2, upperband_3)
array.set(upperbands, 3, upperband_4)
array.set(upperbands, 4, upperband_5)
array.set(upperbands, 5, upperband_6)
array.set(upperbands, 6, upperband_7)
array.set(upperbands, 7, upperband_8)
array.set(upperbands, 8, upperband_9)
array.set(upperbands, 9, upperband_10)
array.set(upperbands, 10, upperband_11)
array.set(upperbands, 11, upperband_12)
array.set(upperbands, 12, upperband_13)
array.set(upperbands, 13, upperband_14)

array.set(lowerbands, 0, lowerband_1)
array.set(lowerbands, 1, lowerband_2)
array.set(lowerbands, 2, lowerband_3)
array.set(lowerbands, 3, lowerband_4)
array.set(lowerbands, 4, lowerband_5)
array.set(lowerbands, 5, lowerband_6)
array.set(lowerbands, 6, lowerband_7)
array.set(lowerbands, 7, lowerband_8)
array.set(lowerbands, 8, lowerband_9)
array.set(lowerbands, 9, lowerband_10)
array.set(lowerbands, 10, lowerband_11)
array.set(lowerbands, 11, lowerband_12)
array.set(lowerbands, 12, lowerband_13)
array.set(lowerbands, 13, lowerband_14)

// Get the selected bands for entry and exit
selected_entry_lowerband = array.get(lowerbands, entry_band - 1)
selected_exit_upperband = array.get(upperbands, exit_band - 1)


// Entry conditions
longCondition = crossover(rsi, rsiOversold) or crossover(close, selected_entry_lowerband)
shortCondition = crossunder(rsi, rsiOverbought) or crossunder(close, selected_exit_upperband)

if (longCondition)
    strategy.entry("Long", strategy.long)

if (long_and_short and shortCondition)
    strategy.entry("Short", strategy.short)

// Exit conditions
exitLongCondition = crossunder(rsi, rsiOverbought) or crossunder(close, selected_exit_upperband)
exitShortCondition = crossover(rsi, rsiOversold) or crossover(close, selected_entry_lowerband)

strategy.close("Long", when=exitLongCondition)
strategy.close("Short", when=long_and_short and exitShortCondition)
Detail
https://www.fmz.com/strategy/431501
Last Modified
2023-11-08 12:25:59