
260 lines
21 KiB
Markdown
260 lines
21 KiB
Markdown
|
|
> Name
|
|
|
|
RSI动量反转短期趋势跟踪策略与移动平均线聚合-RSI-Momentum-Reversal-Short-Term-Trend-Following-Strategy-with-Moving-Average-Confluence
|
|
|
|
> Author
|
|
|
|
ianzeng123
|
|
|
|
> Strategy Description
|
|
|
|
|
|
|
|
|
|
|
|
|
|
|
|
[trans]
|
|
#### 概述
|
|
|
|
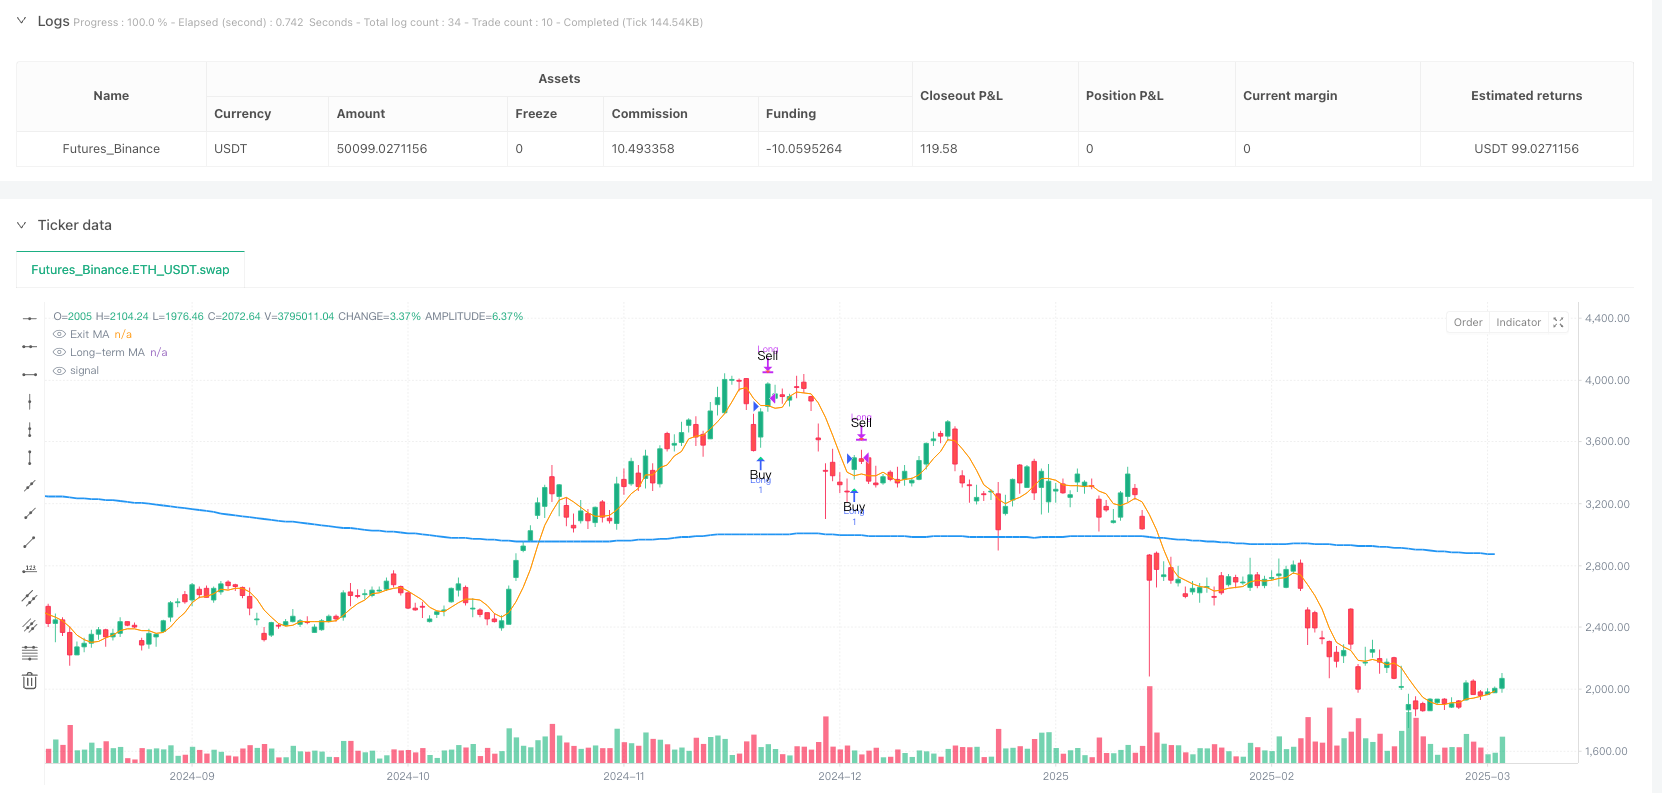
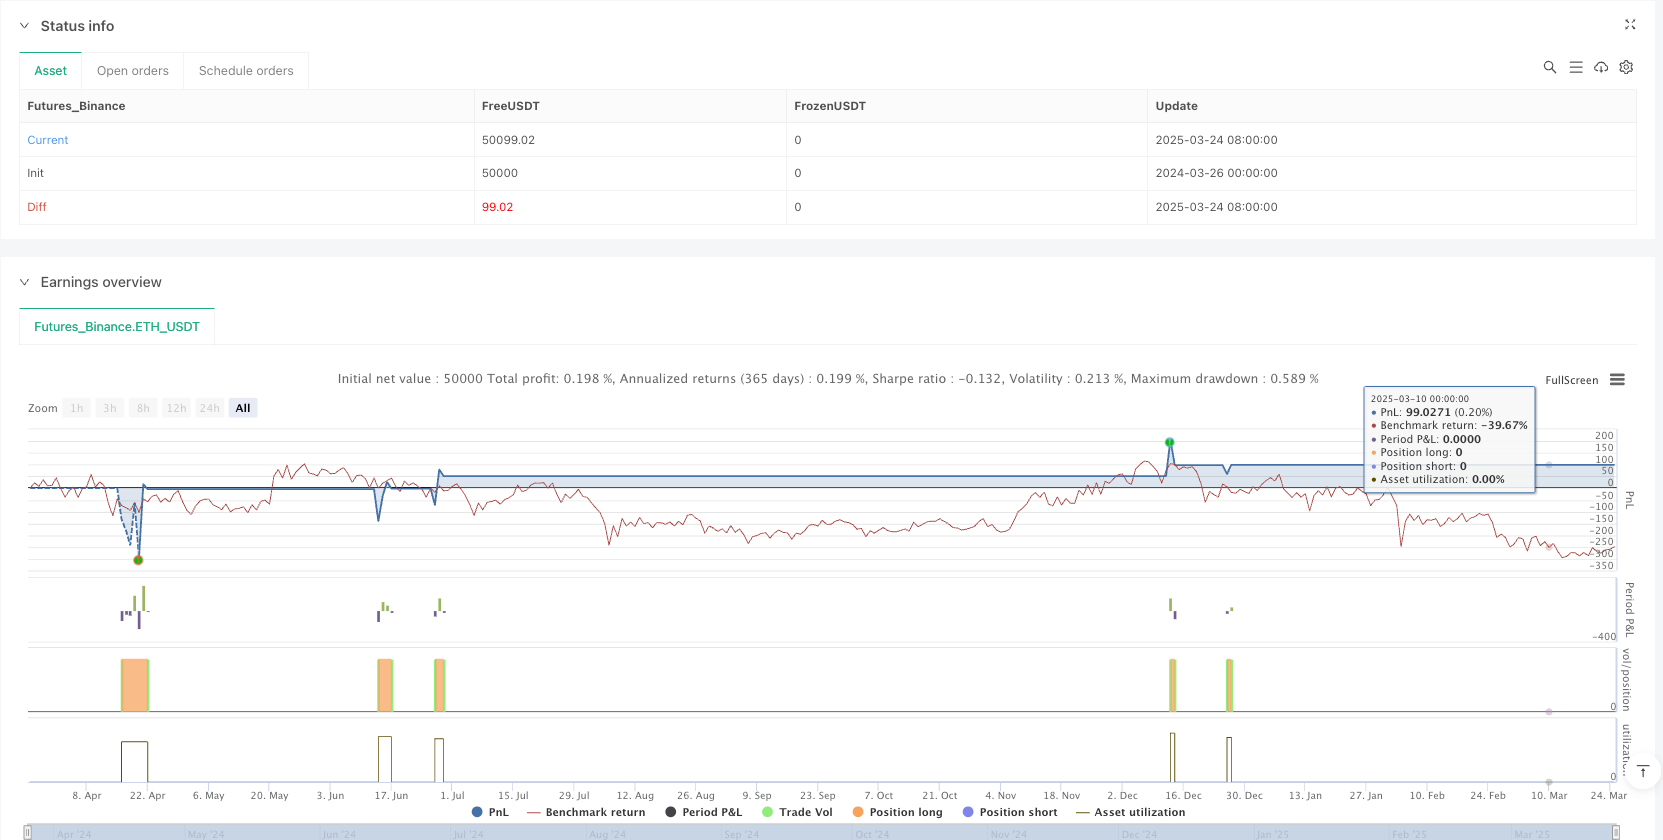
本策略是一个基于RSI超卖反转的趋势跟踪交易系统,核心思想是在强势上升趋势中寻找短期超卖的回调机会进行买入。该策略利用2周期RSI指标跌破极度超卖水平(低于5)后反弹作为入场信号,同时结合长期移动平均线(默认200周期)确认市场整体处于上升趋势。这种方法特别适用于像SPY、QQQ等ETF以及大型科技股的交易,能够在市场短期超跌后捕捉高概率的反弹机会。策略采用5周期移动平均线作为获利了结点,以锁定合理利润。根据回测数据,该策略在多种时间周期上都表现出了60%以上的胜率,适合日内和短期摇摆交易。
|
|
|
|
#### 策略原理
|
|
|
|
此策略的运作原理建立在几个关键技术指标的协同作用上:
|
|
|
|
1. **趋势确认**:策略使用200周期简单移动平均线(SMA)作为主要趋势过滤器。只有当价格位于此长期均线之上时,才考虑入场,这确保我们只在上升趋势中买入,避免在熊市中逆势操作。
|
|
|
|
2. **超卖条件识别**:采用2周期RSI指标监测短期超卖状态。当RSI跌破5这一极低水平时,表明市场可能超卖,但策略并不立即入场。
|
|
|
|
3. **入场时机精确把握**:关键的入场条件是RSI从低于5的水平向上突破5,这一交叉信号表明动量已经开始从极度悲观转向积极,是买入时机。代码中使用`ta.crossover(rsiValue, rsiBuyLevel)`函数精确捕捉这一时刻。
|
|
|
|
4. **智能获利了结**:一旦持仓,策略会监控价格与5周期SMA的关系。当价格收盘高于这一短期均线时,表明短期反弹已经实现,策略自动平仓获利。这种退出机制既能锁定合理利润,又避免了过早离场导致的利润减少。
|
|
|
|
5. **可选的风险控制**:策略内置了百分比止损机制,用户可设置相对入场价格的百分比止损水平。当启用此功能时,如果价格下跌超过设定百分比,策略将自动平仓以限制损失。
|
|
|
|
策略的核心优势在于它结合了趋势跟踪和反转交易的元素,只在强势趋势中寻找短期反转机会,提高了交易的成功概率。
|
|
|
|
#### 策略优势
|
|
|
|
深入分析该策略代码,我们可以总结出以下显著优势:
|
|
|
|
1. **高胜率潜力**:通过在已确认的上升趋势中仅捕捉极度超卖后的反弹,策略提高了交易成功的概率。回测显示在SPY和大型股上有60%以上的胜率。
|
|
|
|
2. **趋势与反转的完美结合**:该策略成功地将趋势跟踪(通过200周期MA)和反转交易(通过RSI超卖反弹)结合起来,避免了单纯反转交易的风险,同时捕捉趋势中的有利入场点。
|
|
|
|
3. **适应性强**:策略在多个时间周期上都有效,从5分钟、10分钟、1小时的日内交易到2小时、日线的短期摇摆交易都适用,为交易者提供了极大的灵活性。
|
|
|
|
4. **明确的入场和出场规则**:策略提供了精确的入场条件(RSI从低于5向上穿越5)和出场条件(价格收盘高于5周期MA),消除了交易中的主观判断,有助于保持交易纪律。
|
|
|
|
5. **内置风险管理**:可选的百分比止损机制为策略提供了额外的风险控制层,使交易者能够根据个人风险承受能力调整参数。
|
|
|
|
6. **视觉辅助**:策略在图表上标记出买入和卖出信号,使交易者能够直观地识别交易机会和管理持仓。
|
|
|
|
7. **参数可调性**:所有关键参数(RSI长度、超卖阈值、趋势MA长度、退出MA长度和止损百分比)都可以根据不同市场和个人偏好进行调整,增强了策略的适应性。
|
|
|
|
#### 策略风险
|
|
|
|
尽管该策略有诸多优势,但也存在一些潜在风险,交易者应当意识到这些风险并采取相应措施:
|
|
|
|
1. **假突破风险**:在极度波动的市场中,RSI可能出现假突破,导致错误信号。解决方法:可以考虑增加确认条件,如要求RSI突破后持续一定时间或结合其他指标进行确认。
|
|
|
|
2. **趋势变化风险**:200周期MA可能在趋势变化初期反应滞后,导致在新兴熊市中产生不当信号。解决方法:考虑添加更敏感的趋势指标作为补充,如较短期的均线交叉或价格通道突破。
|
|
|
|
3. **过早获利了结**:使用5周期MA作为出场点可能导致在更强劲的反弹中过早获利。解决方法:可以实施部分获利策略,或使用更长周期的MA作为出场条件。
|
|
|
|
4. **参数敏感性**:策略性能对RSI长度和超卖阈值等参数非常敏感。解决方法:应在实盘前进行彻底的参数优化和历史回测,找到最适合特定市场和时间周期的参数组合。
|
|
|
|
5. **市场环境适应性**:该策略在震荡市场或熊市中可能表现不佳。解决方法:应将此策略仅用于明确的牛市环境,或增加额外的市场环境过滤器。
|
|
|
|
6. **流动性风险**:尽管策略设计用于SPY、QQQ等高流动性工具,但在应用于较小市值股票时可能面临流动性问题。解决方法:限制策略应用范围在高流动性资产上,或调整仓位大小以适应不同的流动性条件。
|
|
|
|
#### 策略优化方向
|
|
|
|
基于代码分析,我建议以下几个优化方向来提升策略的稳健性和性能:
|
|
|
|
1. **动态RSI阈值**:当前策略使用固定的RSI阈值(5)作为超卖判断标准,但不同市场环境下最佳阈值可能不同。优化方向:实现基于历史波动性或市场状态自动调整的动态RSI阈值,例如在低波动期适当提高阈值,在高波动期适当降低阈值。
|
|
|
|
2. **多周期确认**:为减少假信号,可以添加多时间周期确认机制。优化方向:要求较低时间周期和较高时间周期的RSI同时满足条件,从而增加信号的可靠性。
|
|
|
|
3. **进阶趋势过滤**:当前趋势过滤仅使用单一的200周期MA。优化方向:可以增加指数移动平均线(EMA)与简单移动平均线(SMA)的组合判断,或者使用ADX等趋势强度指标来评估趋势的质量。
|
|
|
|
4. **部分获利策略**:目前采用单一退出点可能无法最大化利润。优化方向:实现分批获利机制,例如在不同价格目标分别平仓部分仓位,同时使用移动止损来保护剩余利润。
|
|
|
|
5. **时间过滤器**:某些市场时段可能更适合此类策略。优化方向:添加时间过滤条件,仅在统计上最有利的时间窗口内交易,避开低效时段。
|
|
|
|
6. **交易量确认**:目前策略没有考虑成交量因素。优化方向:在入场条件中增加交易量确认,如要求RSI反弹时成交量放大,以增强反转信号的可靠性。
|
|
|
|
7. **自适应参数**:固定参数在不同市场阶段效果可能不一。优化方向:实现基于历史数据自动调整的参数系统,使策略能够根据近期市场行为自动优化参数。
|
|
|
|
以上优化方向可以单独或组合实施,但每次修改后都应进行彻底的回测,确保改进措施确实提高了策略的整体性能。
|
|
|
|
#### 总结
|
|
|
|
"RSI动量反转短期趋势跟踪策略与移动平均线聚合"是一个设计精良的交易系统,通过结合趋势跟踪和超卖反转的交易理念,在上升趋势中寻找高概率的买入机会。其核心逻辑是使用200周期移动平均线确认上升趋势,然后等待2周期RSI跌破5的极度超卖水平并反弹,作为最佳买入时机,最后在价格收盘高于5周期移动平均线时获利了结。
|
|
|
|
这种策略特别适合SPY、QQQ等ETF和大型科技股的交易,可以应用于从分钟到日线的多种时间周期。策略的主要优势在于它的高胜率潜力、明确的交易规则和强大的适应性,而其主要风险来自于假突破、参数敏感性和市场环境变化。
|
|
|
|
通过实施建议的优化方向,如动态RSI阈值、多周期确认、进阶趋势过滤和部分获利策略,交易者可以进一步提高该策略的鲁棒性和盈利能力。最终,这是一个能够在强势市场中捕捉短期回调机会的有效工具,适合那些寻求高胜率交易方法的投资者。
|
|
|
|
||
|
|
|
|
#### Overview
|
|
|
|
This strategy is an RSI oversold reversal trend-following trading system, with the core idea of seeking short-term oversold pullback opportunities in strong uptrends. The strategy utilizes a 2-period RSI indicator dropping below an extremely oversold level (below 5) and then rebounding as an entry signal, while combining a long-term moving average (default 200 periods) to confirm that the market is in an overall uptrend. This approach is particularly suitable for trading ETFs like SPY, QQQ, and large technology stocks, capable of capturing high-probability rebound opportunities after short-term market oversold conditions. The strategy employs a 5-period moving average as the profit-taking point to secure reasonable profits. According to backtesting data, this strategy has demonstrated a win rate of over 60% across various timeframes, suitable for intraday and short-term swing trading.
|
|
|
|
#### Strategy Principles
|
|
|
|
The operating principles of this strategy are built on the synergistic effects of several key technical indicators:
|
|
|
|
1. **Trend Confirmation**: The strategy uses a 200-period Simple Moving Average (SMA) as the primary trend filter. Entry is only considered when the price is above this long-term average, ensuring we only buy in uptrends and avoid counter-trend operations in bear markets.
|
|
|
|
2. **Oversold Condition Identification**: A 2-period RSI indicator is used to monitor short-term oversold conditions. When the RSI drops below the extremely low level of 5, it suggests the market may be oversold, but the strategy does not enter immediately.
|
|
|
|
3. **Precise Entry Timing**: The critical entry condition is when RSI crosses above 5 from a level below 5. This crossover signal indicates that momentum has begun to shift from extremely pessimistic to positive, signaling a buying opportunity. The code uses the `ta.crossover(rsiValue, rsiBuyLevel)` function to precisely capture this moment.
|
|
|
|
4. **Intelligent Profit-Taking**: Once a position is established, the strategy monitors the relationship between price and the 5-period SMA. When the price closes above this short-term average, indicating that a short-term rebound has materialized, the strategy automatically closes the position for profit. This exit mechanism both secures reasonable profits and avoids premature exits that could reduce gains.
|
|
|
|
5. **Optional Risk Control**: The strategy has a built-in percentage stop-loss mechanism, allowing users to set a stop-loss level as a percentage of the entry price. When this feature is enabled, if the price drops beyond the set percentage, the strategy will automatically close the position to limit losses.
|
|
|
|
The core advantage of the strategy lies in its combination of trend-following and reversal trading elements, seeking short-term reversal opportunities only within strong trends, thereby increasing the probability of successful trades.
|
|
|
|
#### Strategy Advantages
|
|
|
|
Through in-depth analysis of the strategy code, we can summarize the following significant advantages:
|
|
|
|
1. **High Win-Rate Potential**: By capturing rebounds only after extreme oversold conditions within confirmed uptrends, the strategy increases the probability of successful trades. Backtesting shows win rates above 60% on SPY and large-cap stocks.
|
|
|
|
2. **Perfect Blend of Trend and Reversal**: The strategy successfully combines trend following (via 200-period MA) and reversal trading (via RSI oversold rebounds), avoiding the risks of pure reversal trading while capturing favorable entry points within trends.
|
|
|
|
3. **Strong Adaptability**: The strategy is effective across multiple timeframes, from 5-minute, 10-minute, 1-hour intraday trading to 2-hour and daily short-term swing trading, providing traders with tremendous flexibility.
|
|
|
|
4. **Clear Entry and Exit Rules**: The strategy provides precise entry conditions (RSI crossing above 5 from below) and exit conditions (price closing above the 5-period MA), eliminating subjective judgment in trading and helping maintain trading discipline.
|
|
|
|
5. **Built-in Risk Management**: The optional percentage stop-loss mechanism provides an additional layer of risk control for the strategy, allowing traders to adjust parameters according to their personal risk tolerance.
|
|
|
|
6. **Visual Assistance**: The strategy marks buy and sell signals on the chart, enabling traders to visually identify trading opportunities and manage positions.
|
|
|
|
7. **Parameter Adjustability**: All key parameters (RSI length, oversold threshold, trend MA length, exit MA length, and stop-loss percentage) can be adjusted according to different markets and personal preferences, enhancing the strategy's adaptability.
|
|
|
|
#### Strategy Risks
|
|
|
|
Despite its many advantages, the strategy also has some potential risks that traders should be aware of and take corresponding measures:
|
|
|
|
1. **False Breakout Risk**: In extremely volatile markets, RSI may produce false breakouts, leading to erroneous signals. Solution: Consider adding confirmation conditions, such as requiring the RSI breakout to persist for a certain period or combining with other indicators for confirmation.
|
|
|
|
2. **Trend Change Risk**: The 200-period MA may lag in response during the early stages of trend changes, potentially generating inappropriate signals in emerging bear markets. Solution: Consider adding more sensitive trend indicators as supplements, such as shorter-term moving average crossovers or price channel breakouts.
|
|
|
|
3. **Premature Profit-Taking**: Using the 5-period MA as an exit point may lead to taking profits too early during stronger rebounds. Solution: Implement a partial profit-taking strategy, or use a longer-period MA as the exit condition.
|
|
|
|
4. **Parameter Sensitivity**: Strategy performance is highly sensitive to parameters such as RSI length and oversold threshold. Solution: Thorough parameter optimization and historical backtesting should be conducted before live trading to find the parameter combinations best suited for specific markets and timeframes.
|
|
|
|
5. **Market Environment Adaptability**: The strategy may perform poorly in range-bound or bear markets. Solution: This strategy should be used only in clearly bullish market environments, or additional market environment filters should be added.
|
|
|
|
6. **Liquidity Risk**: Although the strategy is designed for highly liquid instruments like SPY and QQQ, it may face liquidity issues when applied to smaller-cap stocks. Solution: Limit the strategy's application to highly liquid assets, or adjust position sizes to accommodate different liquidity conditions.
|
|
|
|
#### Strategy Optimization Directions
|
|
|
|
Based on code analysis, I recommend the following optimization directions to enhance the strategy's robustness and performance:
|
|
|
|
1. **Dynamic RSI Threshold**: The current strategy uses a fixed RSI threshold (5) as the oversold criterion, but the optimal threshold may vary in different market environments. Optimization direction: Implement a dynamic RSI threshold that automatically adjusts based on historical volatility or market conditions, for example, raising the threshold during low volatility periods and lowering it during high volatility periods.
|
|
|
|
2. **Multi-Timeframe Confirmation**: To reduce false signals, a multi-timeframe confirmation mechanism can be added. Optimization direction: Require RSI conditions to be met simultaneously on both lower and higher timeframes, thereby increasing signal reliability.
|
|
|
|
3. **Advanced Trend Filtering**: The current trend filter uses only a single 200-period MA. Optimization direction: Add a combination of Exponential Moving Averages (EMAs) and Simple Moving Averages (SMAs) for judgment, or use trend strength indicators like ADX to assess trend quality.
|
|
|
|
4. **Partial Profit Strategy**: The current single exit point may not maximize profits. Optimization direction: Implement a staged profit-taking mechanism, such as closing portions of the position at different price targets, while using trailing stops to protect remaining profits.
|
|
|
|
5. **Time Filter**: Certain market sessions may be more suitable for this type of strategy. Optimization direction: Add time filtering conditions to trade only during statistically advantageous time windows, avoiding inefficient periods.
|
|
|
|
6. **Volume Confirmation**: The current strategy does not consider volume factors. Optimization direction: Add volume confirmation to entry conditions, such as requiring volume to increase during RSI rebounds, to enhance the reliability of reversal signals.
|
|
|
|
7. **Adaptive Parameters**: Fixed parameters may perform differently across market phases. Optimization direction: Implement an automatic parameter adjustment system based on historical data, allowing the strategy to self-optimize according to recent market behavior.
|
|
|
|
The above optimization directions can be implemented individually or in combination, but thorough backtesting should be conducted after each modification to ensure that the improvements actually enhance the strategy's overall performance.
|
|
|
|
#### Summary
|
|
|
|
The "RSI Momentum Reversal Short-Term Trend-Following Strategy with Moving Average Confluence" is a well-designed trading system that combines trend-following and oversold reversal trading concepts to seek high-probability buying opportunities in uptrends. Its core logic is to use a 200-period moving average to confirm an uptrend, then wait for a 2-period RSI to drop below the extremely oversold level of 5 and rebound, as the optimal buying opportunity, finally taking profits when the price closes above the 5-period moving average.
|
|
|
|
This strategy is particularly suitable for trading ETFs like SPY, QQQ, and large technology stocks, and can be applied across multiple timeframes from minutes to daily charts. The strategy's main advantages lie in its high win-rate potential, clear trading rules, and strong adaptability, while its primary risks come from false breakouts, parameter sensitivity, and market environment changes.
|
|
|
|
By implementing the suggested optimization directions, such as dynamic RSI thresholds, multi-timeframe confirmation, advanced trend filtering, and partial profit strategies, traders can further enhance the robustness and profitability of this strategy. Ultimately, this is an effective tool for capturing short-term pullback opportunities in strong markets, suitable for investors seeking high win-rate trading methods.
|
|
[/trans]
|
|
|
|
|
|
|
|
> Source (PineScript)
|
|
|
|
``` pinescript
|
|
/*backtest
|
|
start: 2024-03-26 00:00:00
|
|
end: 2025-03-25 00:00:00
|
|
period: 1d
|
|
basePeriod: 1d
|
|
exchanges: [{"eid":"Futures_Binance","currency":"ETH_USDT"}]
|
|
*/
|
|
|
|
//@version=5
|
|
strategy("_Rerun's Dip Bonanza", overlay=true, initial_capital=100000, currency="USD")
|
|
|
|
// === Input Parameters ===
|
|
// RSI settings
|
|
rsiLength = input.int(2, "RSI Length", minval=1)
|
|
rsiBuyLevel = input.float(5.0, "RSI Oversold Level (Buy Threshold)", minval=1, maxval=50)
|
|
// Trend filter MA length (use 200 for daily charts; for intraday, a smaller period can be considered)
|
|
trendMaLen = input.int(200, "Trend MA Length (Long Filter)", minval=1)
|
|
// Exit MA length
|
|
exitMaLen = input.int(5, "Exit MA Length", minval=1)
|
|
// Optional stop-loss (as % of entry price). Set to 0 to disable.
|
|
stopLossPerc = input.float(0.0, "Emergency Stop-Loss (%)", minval=0.0, step=0.1)
|
|
|
|
// === Indicators Calculation ===
|
|
rsiValue = ta.rsi(close, rsiLength)
|
|
longMA = ta.sma(close, trendMaLen)
|
|
exitMA = ta.sma(close, exitMaLen)
|
|
|
|
// === Entry and Exit Conditions ===
|
|
// Long entry when price is above longMA and RSI is oversold
|
|
inUptrend = close > longMA
|
|
oversold = rsiValue < rsiBuyLevel
|
|
|
|
// **We use a crossover condition to ensure RSI was below the level and is now ticking up**
|
|
entryTrigger = ta.crossover(rsiValue, rsiBuyLevel)
|
|
longCondition = inUptrend and entryTrigger
|
|
|
|
// Exit when price closes above the short exit MA
|
|
exitCondition = close > exitMA
|
|
|
|
// === Strategy Orders ===
|
|
if (longCondition)
|
|
strategy.entry(id="Long", direction=strategy.long, comment="Buy Dip")
|
|
|
|
// Exit the long when exit condition met
|
|
if (strategy.position_size > 0 and exitCondition)
|
|
strategy.close(id="Long", comment="Take Profit")
|
|
|
|
// Optional emergency stop-loss: if enabled and price falls X% below entry price, exit early
|
|
if (strategy.position_size > 0 and stopLossPerc > 0)
|
|
if (close < strategy.position_avg_price * (1 - stopLossPerc/100))
|
|
strategy.close(id="Long", comment="StopLoss")
|
|
|
|
// === Visual Cues on Chart ===
|
|
// Plot moving averages for reference
|
|
plot(longMA, color=color.blue, linewidth=2, title="Long-term MA")
|
|
plot(exitMA, color=color.orange, linewidth=1, title="Exit MA")
|
|
// Mark buy and sell points on chart
|
|
plotshape(longCondition, title="Buy Signal", text="Buy", style=shape.triangleup, location=location.belowbar, color=color.lime, size=size.small)
|
|
plotshape(exitCondition and strategy.position_size > 0, title="Exit Signal", text="Sell", style=shape.triangledown, location=location.abovebar, color=color.red, size=size.small)
|
|
|
|
```
|
|
|
|
> Detail
|
|
|
|
https://www.fmz.com/strategy/488288
|
|
|
|
> Last Modified
|
|
|
|
2025-03-26 16:13:25
|