
8.2 KiB
Name
RSI动态平仓位动量交易策略-RSI-Dynamic-Exit-Level-Momentum-Trading-Strategy
Author
ChaoZhang
Strategy Description
[trans]
概述
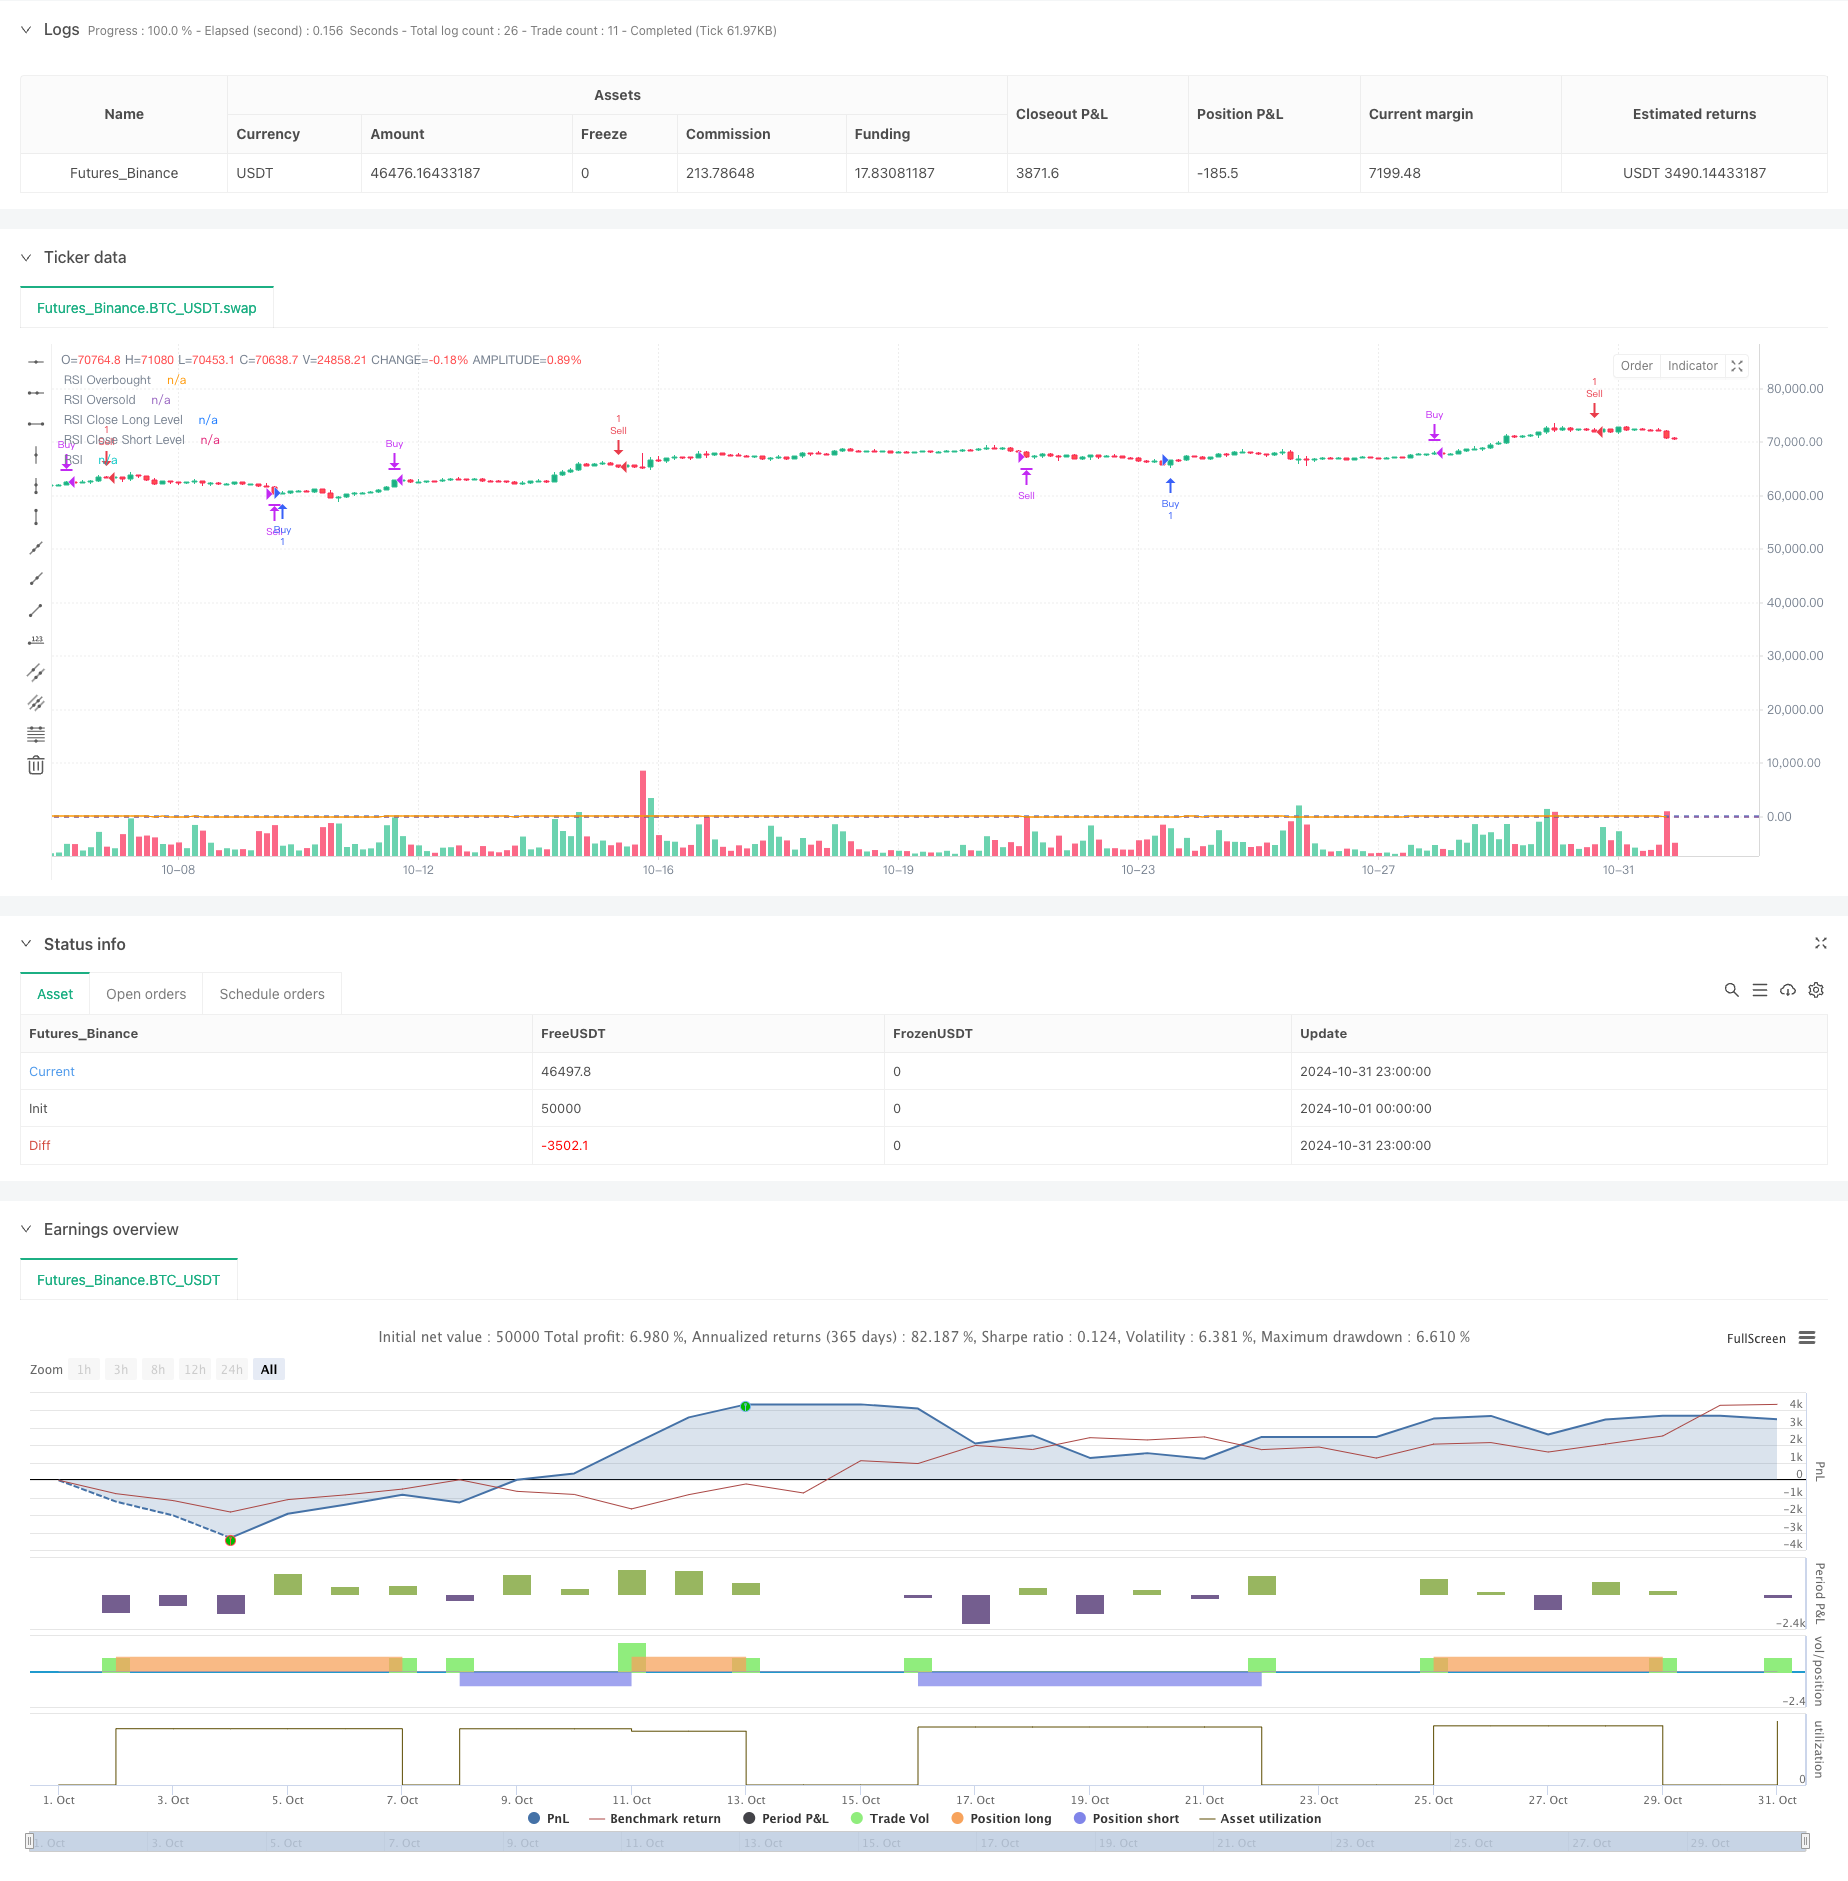
本策略是一个基于相对强弱指数(RSI)的动态平仓策略,通过设置动态的开仓和平仓条件来捕捉市场趋势。策略在RSI指标突破超买超卖水平时产生交易信号,同时引入了独特的动态平仓机制,通过在不同RSI水平设置平仓条件来优化交易表现。该策略采用完整的多空交易系统,能够在市场双向波动中捕捉交易机会。
策略原理
策略的核心逻辑包含以下几个关键组成部分:
- 信号生成机制:使用RSI指标的超买超卖水平(70/30)作为主要交易信号。当RSI向上突破30时产生买入信号,向下突破70时产生卖出信号。
- 仓位管理系统:策略采用单一持仓原则,确保在任何时刻最多只持有一个方向的仓位,有效控制风险敞口。
- 动态平仓机制:设置了差异化的RSI平仓水平(多仓60/空仓40),这种非对称设计能更好地适应市场趋势特征。
- 可视化模块:通过在图表上绘制RSI线、超买超卖水平以及平仓水平,帮助交易者直观理解市场状态。
策略优势
- 系统化交易:策略完全系统化,消除了主观判断带来的情绪干扰。
- 风险控制:通过单一持仓原则和动态平仓机制,有效控制风险。
- 适应性强:可以根据不同市场特征调整RSI参数和平仓水平。
- 双向交易:能够在上涨和下跌市场中均获得交易机会。
- 可视化支持:直观的图表展示有助于理解市场状态和策略逻辑。
策略风险
- 震荡市场风险:在横盘震荡市场中可能频繁交易,增加交易成本。
- 趋势延续风险:提前平仓可能错过更大的趋势机会。
- 参数敏感性:策略表现对RSI参数和平仓水平的设置较为敏感。
- 滑点影响:在市场剧烈波动时可能面临较大滑点风险。
策略优化方向
- 引入趋势过滤器:可以添加移动平均线等趋势指标,过滤假信号。
- 动态参数优化:根据市场波动率自动调整RSI参数和平仓水平。
- 增加仓位管理:引入资金管理模块,根据市场风险度调整持仓规模。
- 优化平仓机制:考虑添加追踪止损功能,更好地保护盈利。
总结
这是一个设计合理的动量交易策略,通过RSI指标和动态平仓机制捕捉市场机会。策略的主要特点是系统化程度高、风险控制完善、适应性强。虽然存在一些固有风险,但通过参数优化和功能扩展,策略仍有较大的改进空间。对于寻求稳健交易系统的投资者来说,这是一个值得考虑的策略框架。 ||
Overview
This strategy is a dynamic exit system based on the Relative Strength Index (RSI), capturing market trends through dynamic entry and exit conditions. The strategy generates trading signals when RSI breaks through overbought and oversold levels, incorporating a unique dynamic exit mechanism by setting exit conditions at different RSI levels to optimize trading performance. It employs a complete long-short trading system capable of capturing opportunities in both market directions.
Strategy Principles
The core logic includes several key components:
- Signal Generation: Uses RSI overbought/oversold levels (70/30) as primary trading signals. Buy signals are generated when RSI crosses above 30, sell signals when crossing below 70.
- Position Management: Implements a single position principle, ensuring only one directional position at any time to effectively control risk exposure.
- Dynamic Exit Mechanism: Sets differentiated RSI exit levels (60 for longs/40 for shorts), with this asymmetric design better adapting to market trend characteristics.
- Visualization Module: Plots RSI line, overbought/oversold levels, and exit levels on the chart for intuitive market state understanding.
Strategy Advantages
- Systematic Trading: Fully systematic approach eliminates emotional interference from subjective judgment.
- Risk Control: Effective risk management through single position principle and dynamic exit mechanism.
- High Adaptability: RSI parameters and exit levels can be adjusted for different market characteristics.
- Bilateral Trading: Captures opportunities in both rising and falling markets.
- Visual Support: Intuitive chart display aids understanding of market conditions and strategy logic.
Strategy Risks
- Choppy Market Risk: May generate frequent trades in sideways markets, increasing transaction costs.
- Trend Continuation Risk: Early exits might miss larger trend opportunities.
- Parameter Sensitivity: Strategy performance is sensitive to RSI parameter and exit level settings.
- Slippage Impact: May face significant slippage risk during volatile market conditions.
Optimization Directions
- Introduce Trend Filters: Add trend indicators like moving averages to filter false signals.
- Dynamic Parameter Optimization: Automatically adjust RSI parameters and exit levels based on market volatility.
- Enhanced Position Management: Incorporate money management module to adjust position size based on market risk levels.
- Optimize Exit Mechanism: Consider adding trailing stop functionality for better profit protection.
Summary
This is a well-designed momentum trading strategy that captures market opportunities through RSI indicators and dynamic exit mechanisms. The strategy's main features are its high systematic nature, robust risk control, and strong adaptability. While inherent risks exist, there is significant room for improvement through parameter optimization and functional extensions. For investors seeking a robust trading system, this represents a worthy strategy framework to consider.[/trans]
Source (PineScript)
/*backtest
start: 2024-10-01 00:00:00
end: 2024-10-31 23:59:59
period: 3h
basePeriod: 3h
exchanges: [{"eid":"Futures_Binance","currency":"BTC_USDT"}]
*/

//@version=5
strategy("RSI Strategy with Close Levels", shorttitle="RSI Strat", overlay=true)

// RSI Input settings
rsiLength = input.int(14, title="RSI Length")
rsiOverbought = input.int(70, title="RSI Overbought Level")
rsiOversold = input.int(30, title="RSI Oversold Level")
rsiCloseLongLevel = input.int(60, title="RSI Level to Close Long Position")
rsiCloseShortLevel = input.int(40, title="RSI Level to Close Short Position")

// Calculate RSI
rsi = ta.rsi(close, rsiLength)

// Generate buy and sell signals based on RSI levels
buySignal = ta.crossover(rsi, rsiOversold)
sellSignal = ta.crossunder(rsi, rsiOverbought)

// Check if there are open positions
var bool inPosition = na
if (strategy.opentrades > 0)
    inPosition := true
else
    inPosition := false

// Open long position on buy signal if not already in a position
if (buySignal and not inPosition)
    strategy.entry("Buy", strategy.long)
    inPosition := true

// Close long position on sell signal or when RSI reaches the close long level
if (inPosition and strategy.position_size > 0 and (sellSignal or rsi >= rsiCloseLongLevel))
    strategy.close("Buy")
    inPosition := false

// Open short position on sell signal if not already in a position
if (sellSignal and not inPosition)
    strategy.entry("Sell", strategy.short)
    inPosition := true

// Close short position on buy signal or when RSI reaches the close short level
if (inPosition and strategy.position_size < 0 and (buySignal or rsi <= rsiCloseShortLevel))
    strategy.close("Sell")
    inPosition := false

// Plot buy and sell signals
//plotshape(series=buySignal, title="Buy Signal", location=location.belowbar, color=color.green, style=shape.labelup, text="BUY")
//plotshape(series=sellSignal, title="Sell Signal", location=location.abovebar, color=color.red, style=shape.labeldown, text="SELL")

// Plot RSI for visualization
hline(rsiOverbought, "RSI Overbought", color=color.red)
hline(rsiOversold, "RSI Oversold", color=color.green)
hline(rsiCloseLongLevel, "RSI Close Long Level", color=color.blue)
hline(rsiCloseShortLevel, "RSI Close Short Level", color=color.purple)
plot(rsi, title="RSI", color=color.orange)
Detail
https://www.fmz.com/strategy/473233
Last Modified
2024-11-28 14:59:20