
251 lines
13 KiB
Markdown
251 lines
13 KiB
Markdown
|
|
> Name
|
|
|
|
RSI与随机指标融合交叉策略-RSI-and-Stochastic-Fusion-Cross-Strategy
|
|
|
|
> Author
|
|
|
|
ChaoZhang
|
|
|
|
> Strategy Description
|
|
|
|
|
|
|
|
[trans]
|
|
#### 概述
|
|
|
|
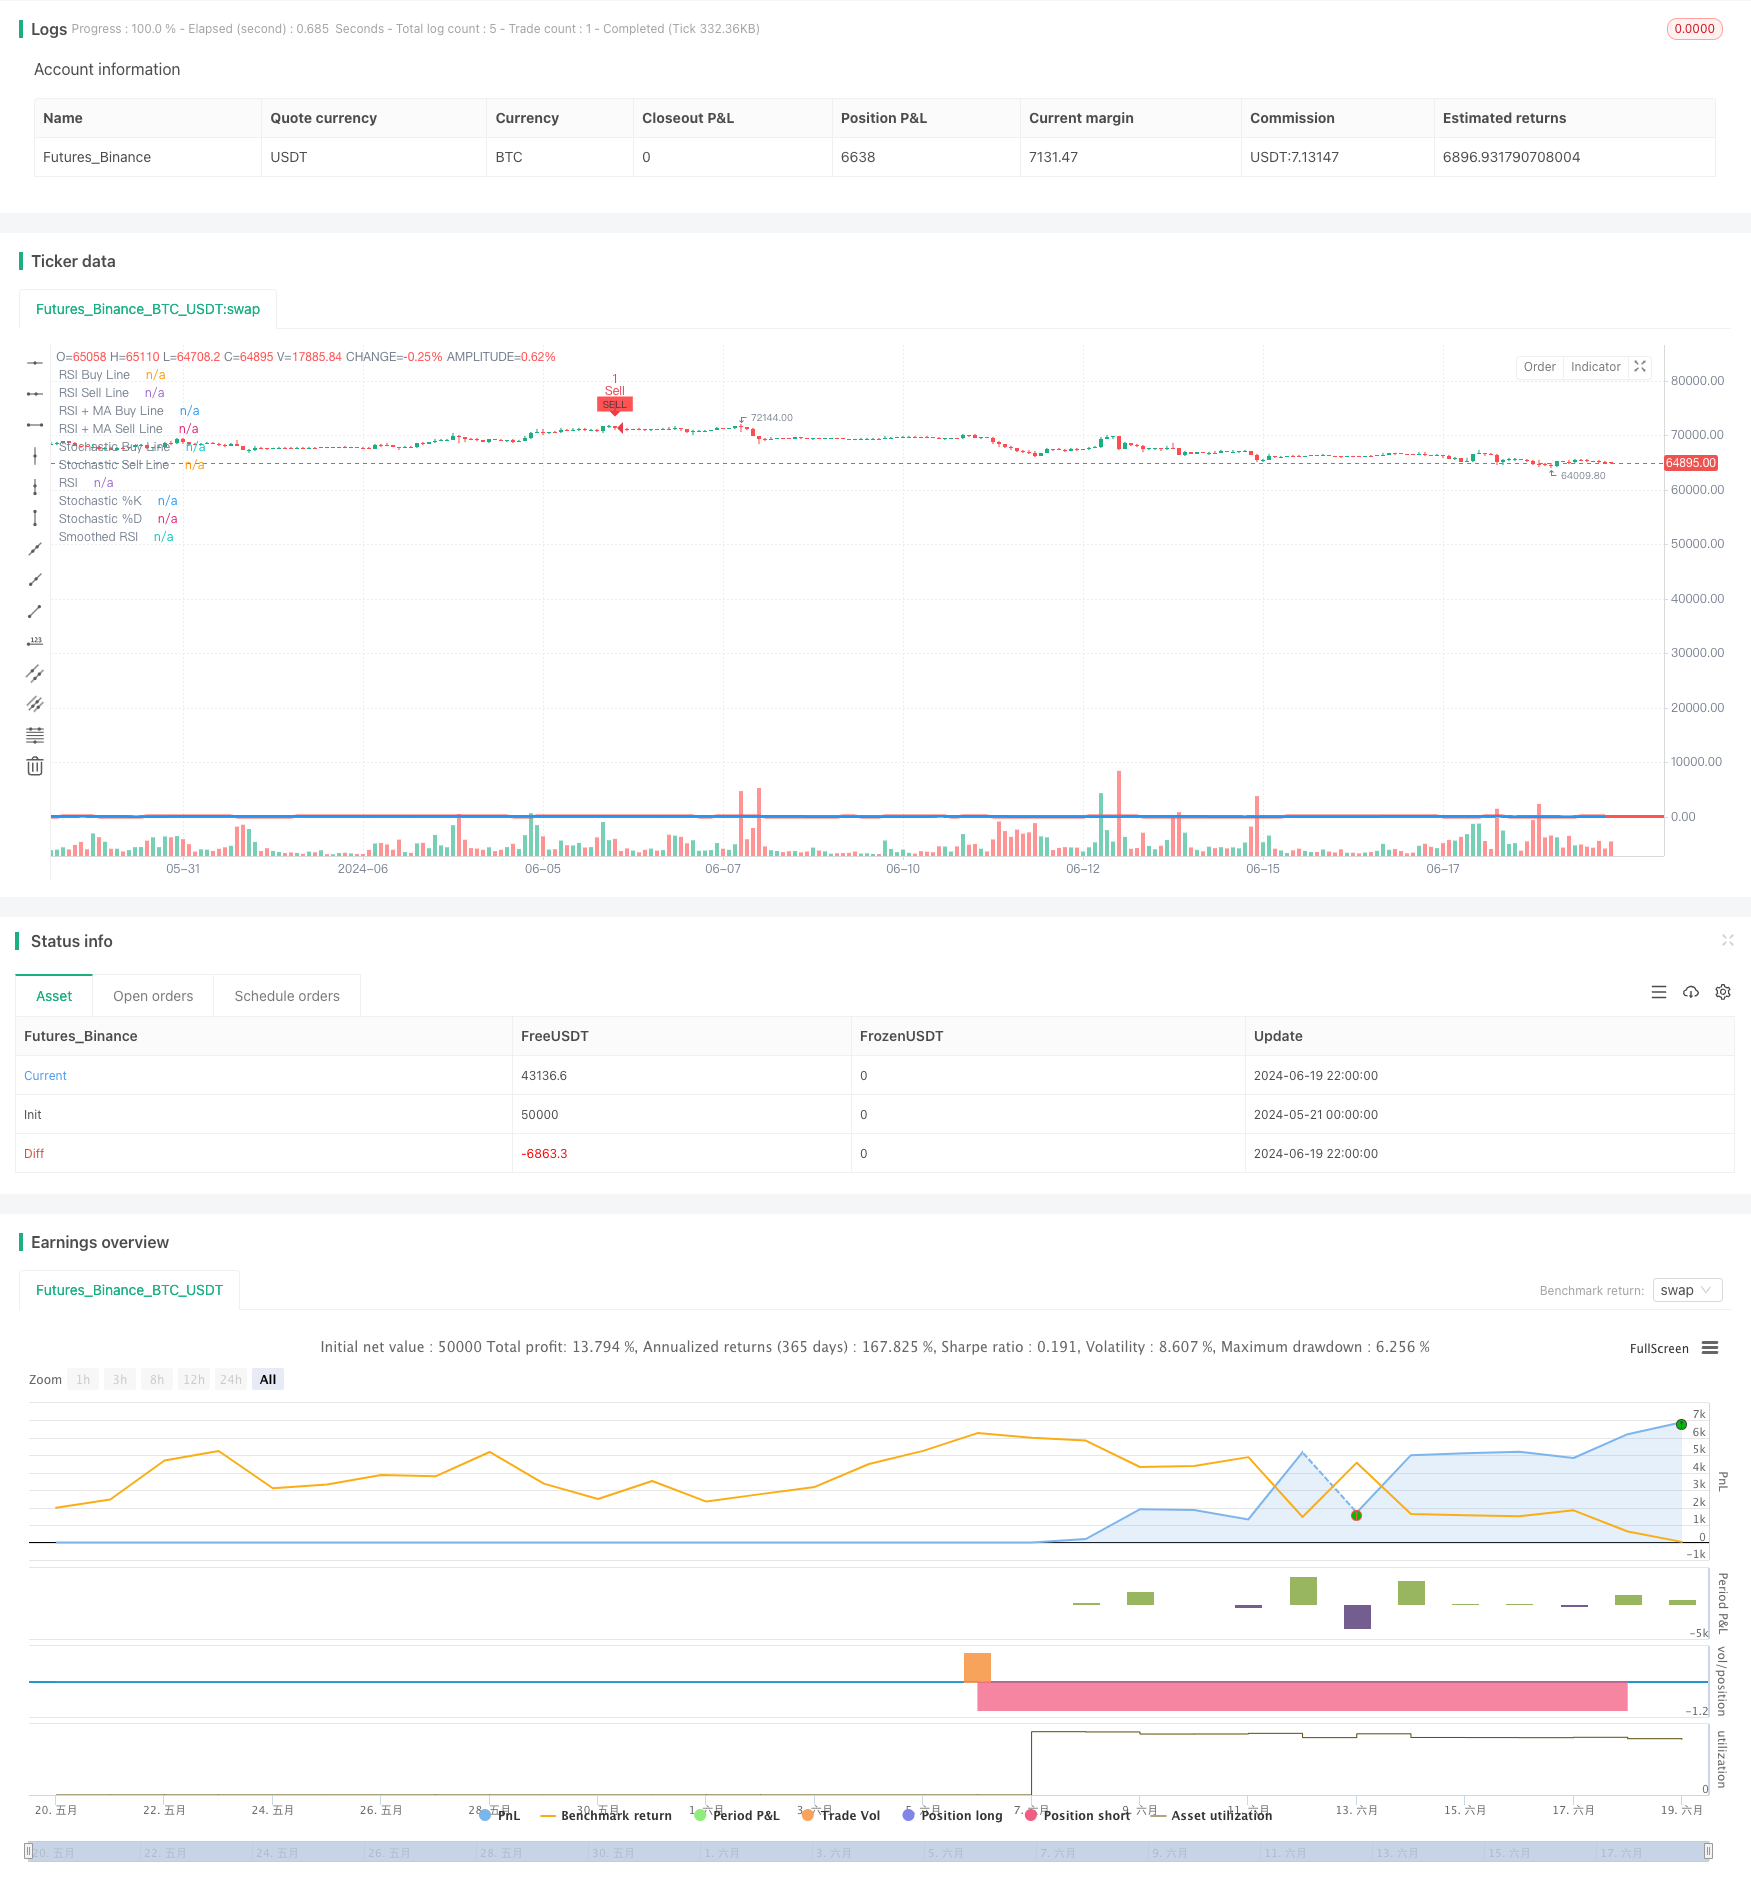
该策略是一个综合性的技术分析系统,主要结合了相对强弱指标(RSI)和随机指标(Stochastic)的特性,同时融入了移动平均线(MA)的概念。策略的核心思想是通过多个动量指标的交叉和阈值判断来捕捉市场的转折点,从而产生买入和卖出信号。这种多维度的分析方法旨在提高交易决策的准确性和可靠性。
|
|
|
|
#### 策略原理
|
|
|
|
1. RSI分析:
|
|
- 使用标准的14周期RSI。
|
|
- 设定了买入(37)和卖出(49)阈值。
|
|
- RSI上升且低于买入阈值视为看涨信号之一。
|
|
- RSI下降且高于卖出阈值视为看跌信号之一。
|
|
|
|
2. 平滑RSI:
|
|
- 对RSI进行移动平均处理,可选SMA、EMA、WMA、SMMA或VMMA。
|
|
- RSI与其平滑线的交叉被用作额外的信号确认。
|
|
|
|
3. 随机指标分析:
|
|
- 使用标准的随机指标设置(14,3,3)。
|
|
- 设定了超买(80)和超卖(20)阈值。
|
|
- K线与D线的金叉和死叉作为交易信号的重要组成部分。
|
|
|
|
4. 综合信号生成:
|
|
- 买入信号:RSI上升且低于买入阈值,随机指标K值低于超卖线且金叉,RSI上穿平滑RSI且在RSI+MA买入线以下。
|
|
- 卖出信号:RSI下降且高于卖出阈值,随机指标K值高于超买线且死叉,RSI下穿平滑RSI且在RSI+MA卖出线以上。
|
|
|
|
#### 策略优势
|
|
|
|
1. 多指标融合:通过结合RSI、随机指标和移动平均线,策略能够从多个角度分析市场动量,减少假信号。
|
|
|
|
2. 动态适应性:使用RSI和随机指标的交叉信号,能够更好地适应不同市场环境。
|
|
|
|
3. 趋势确认:RSI与其平滑线的交叉提供了额外的趋势确认,有助于过滤掉一些不可靠的信号。
|
|
|
|
4. 灵活性:策略允许用户自定义多个参数,如RSI长度、买卖阈值等,可以根据不同市场和个人偏好进行调整。
|
|
|
|
5. 视觉反馈:策略提供了丰富的图表绘制功能,有助于交易者直观地理解市场状况和信号生成过程。
|
|
|
|
#### 策略风险
|
|
|
|
1. 过度交易:多重条件可能导致信号频繁生成,增加交易成本。
|
|
|
|
2. 滞后性:使用多个移动平均和平滑处理可能导致信号滞后,在快速变化的市场中错过机会。
|
|
|
|
3. 参数敏感性:策略依赖多个可调参数,不当的参数设置可能导致策略表现不佳。
|
|
|
|
4. 市场环境依赖:在趋势不明显或横盘市场中,策略可能产生大量假信号。
|
|
|
|
5. 过度依赖技术指标:忽视基本面和市场情绪等其他重要因素可能导致判断失误。
|
|
|
|
#### 策略优化方向
|
|
|
|
1. 动态参数调整:引入自适应机制,根据市场波动性自动调整RSI和随机指标的参数。
|
|
|
|
2. 增加趋势过滤器:结合长期移动平均线或ADX指标,以确保在强趋势中才进行交易。
|
|
|
|
3. 引入成交量分析:将成交量指标纳入决策过程,提高信号的可靠性。
|
|
|
|
4. 优化出场策略:开发更精细的止盈止损机制,如使用跟踪止损或基于ATR的动态止损。
|
|
|
|
5. 时间框架协调:在多个时间框架上验证信号,以减少假信号和提高准确性。
|
|
|
|
6. 机器学习整合:使用机器学习算法优化参数选择和信号生成过程。
|
|
|
|
#### 总结
|
|
|
|
RSI与随机指标融合交叉策略是一个全面的技术分析系统,通过结合多个动量指标和移动平均线,旨在捕捉市场的重要转折点。该策略的优势在于其多维度分析方法和灵活的参数设置,使其能够适应不同的市场环境。然而,策略也面临过度交易和参数敏感性等风险。未来的优化方向应focus on提高策略的自适应能力,引入更多的市场信息,以及优化风险管理机制。通过持续改进和测试,这个策略有潜力成为一个强大的交易决策辅助工具。
|
|
|
|
||
|
|
|
|
#### Overview
|
|
|
|
This strategy is a comprehensive technical analysis system that primarily combines the characteristics of the Relative Strength Index (RSI) and the Stochastic Oscillator, while also incorporating the concept of Moving Averages (MA). The core idea of the strategy is to capture market turning points by analyzing crossovers and threshold conditions of multiple momentum indicators, thereby generating buy and sell signals. This multi-dimensional analysis approach aims to improve the accuracy and reliability of trading decisions.
|
|
|
|
#### Strategy Principles
|
|
|
|
1. RSI Analysis:
|
|
- Uses a standard 14-period RSI.
|
|
- Sets buy (37) and sell (49) thresholds.
|
|
- RSI rising and below the buy threshold is considered one of the bullish signals.
|
|
- RSI falling and above the sell threshold is considered one of the bearish signals.
|
|
|
|
2. Smoothed RSI:
|
|
- Applies moving average to RSI, with options for SMA, EMA, WMA, SMMA, or VMMA.
|
|
- Crossovers between RSI and its smoothed line are used for additional signal confirmation.
|
|
|
|
3. Stochastic Oscillator Analysis:
|
|
- Uses standard Stochastic settings (14,3,3).
|
|
- Sets overbought (80) and oversold (20) thresholds.
|
|
- Golden cross and death cross of %K and %D lines are important components of trading signals.
|
|
|
|
4. Comprehensive Signal Generation:
|
|
- Buy Signal: RSI rising and below buy threshold, Stochastic %K below oversold line with golden cross, RSI crosses above smoothed RSI and below RSI+MA buy line.
|
|
- Sell Signal: RSI falling and above sell threshold, Stochastic %K above overbought line with death cross, RSI crosses below smoothed RSI and above RSI+MA sell line.
|
|
|
|
#### Strategy Advantages
|
|
|
|
1. Multi-Indicator Fusion: By combining RSI, Stochastic, and Moving Averages, the strategy can analyze market momentum from multiple angles, reducing false signals.
|
|
|
|
2. Dynamic Adaptability: Using crossover signals from RSI and Stochastic allows better adaptation to different market environments.
|
|
|
|
3. Trend Confirmation: The crossover of RSI with its smoothed line provides additional trend confirmation, helping to filter out some unreliable signals.
|
|
|
|
4. Flexibility: The strategy allows users to customize multiple parameters, such as RSI length and buy/sell thresholds, which can be adjusted according to different markets and personal preferences.
|
|
|
|
5. Visual Feedback: The strategy provides rich charting functions, helping traders intuitively understand market conditions and signal generation processes.
|
|
|
|
#### Strategy Risks
|
|
|
|
1. Overtrading: Multiple conditions may lead to frequent signal generation, increasing trading costs.
|
|
|
|
2. Lag: The use of multiple moving averages and smoothing processes may cause signal lag, missing opportunities in rapidly changing markets.
|
|
|
|
3. Parameter Sensitivity: The strategy relies on multiple adjustable parameters; improper parameter settings may lead to poor strategy performance.
|
|
|
|
4. Market Environment Dependency: In markets with unclear trends or range-bound conditions, the strategy may produce numerous false signals.
|
|
|
|
5. Over-reliance on Technical Indicators: Ignoring other important factors such as fundamentals and market sentiment may lead to misjudgments.
|
|
|
|
#### Strategy Optimization Directions
|
|
|
|
1. Dynamic Parameter Adjustment: Introduce adaptive mechanisms to automatically adjust RSI and Stochastic parameters based on market volatility.
|
|
|
|
2. Add Trend Filters: Incorporate long-term moving averages or ADX indicators to ensure trading only occurs in strong trends.
|
|
|
|
3. Introduce Volume Analysis: Integrate volume indicators into the decision-making process to improve signal reliability.
|
|
|
|
4. Optimize Exit Strategy: Develop more refined profit-taking and stop-loss mechanisms, such as using trailing stops or ATR-based dynamic stops.
|
|
|
|
5. Time Frame Coordination: Verify signals across multiple time frames to reduce false signals and improve accuracy.
|
|
|
|
6. Machine Learning Integration: Use machine learning algorithms to optimize parameter selection and signal generation processes.
|
|
|
|
#### Conclusion
|
|
|
|
The RSI and Stochastic Fusion Cross Strategy is a comprehensive technical analysis system that aims to capture significant market turning points by combining multiple momentum indicators and moving averages. The strategy's strengths lie in its multi-dimensional analysis approach and flexible parameter settings, allowing it to adapt to different market environments. However, the strategy also faces risks such as overtrading and parameter sensitivity. Future optimization should focus on improving the strategy's adaptive capabilities, incorporating more market information, and enhancing risk management mechanisms. Through continuous improvement and testing, this strategy has the potential to become a powerful tool for assisting trading decisions.
|
|
|
|
[/trans]
|
|
|
|
|
|
|
|
> Source (PineScript)
|
|
|
|
``` pinescript
|
|
/*backtest
|
|
start: 2024-05-21 00:00:00
|
|
end: 2024-06-20 00:00:00
|
|
period: 2h
|
|
basePeriod: 15m
|
|
exchanges: [{"eid":"Futures_Binance","currency":"BTC_USDT"}]
|
|
*/
|
|
|
|
//@version=5
|
|
strategy("-VrilyaSS-RSI&SToch-Cross+2xRSI+2xStoch-Lines+RSI-SMA-Cross-V4-", overlay=true)
|
|
|
|
// RSI settings
|
|
rsiLength = input.int(14, title="RSI Length")
|
|
rsiSource = input.source(ohlc4, title="RSI Source")
|
|
rsiBuyLine = input.int(37, title="RSI Buy Line", minval=0, maxval=100)
|
|
rsiSellLine = input.int(49, title="RSI Sell Line", minval=0, maxval=100)
|
|
rsi = ta.rsi(rsiSource, rsiLength)
|
|
|
|
// Smoothed RSI (Gleitender Durchschnitt von RSI)
|
|
smaLength = input.int(14, title="MA Length for RSI")
|
|
smaSource = input.source(ohlc4, title="MA Source for RSI")
|
|
maTypeRSI = input.string(title="MA Type for RSI", defval="SMA", options=["SMA", "EMA", "WMA", "SMMA (RMA)", "VMMA"])
|
|
f_get_ma_rsi(source, length, type) =>
|
|
switch type
|
|
"SMA" => ta.sma(source, length)
|
|
"EMA" => ta.ema(source, length)
|
|
"WMA" => ta.wma(source, length)
|
|
"SMMA (RMA)" => ta.rma(source, length) // Smoothed Moving Average (Simple Moving Average)
|
|
"VMMA" => ta.vwma(source, length) // Volume Weighted Moving Average (VMMA)
|
|
smoothedRsi = f_get_ma_rsi(ta.rsi(smaSource, rsiLength), smaLength, maTypeRSI)
|
|
rsiSmaBuyLine = input.int(40, title="RSI + MA Buy Line", minval=0, maxval=100)
|
|
rsiSmaSellLine = input.int(60, title="RSI + MA Sell Line", minval=0, maxval=100)
|
|
|
|
// Stochastic settings
|
|
kLength = input.int(14, title="Stochastic K Length")
|
|
kSmoothing = input.int(3, title="Stochastic K Smoothing")
|
|
dSmoothing = input.int(3, title="Stochastic D Smoothing")
|
|
stochBuyLine = input.int(20, title="Stochastic Buy Line", minval=0, maxval=100)
|
|
stochSellLine = input.int(80, title="Stochastic Sell Line", minval=0, maxval=100)
|
|
stochK = ta.sma(ta.stoch(close, high, low, kLength), kSmoothing)
|
|
stochD = ta.sma(stochK, dSmoothing)
|
|
|
|
// Stochastic Crosses
|
|
bullishCross = ta.crossover(stochK, stochD)
|
|
bearishCross = ta.crossunder(stochK, stochD)
|
|
|
|
// RSI Direction and Crosses
|
|
rsiUp = ta.change(rsi) > 0
|
|
rsiDown = ta.change(rsi) < 0
|
|
rsiCrossAboveSMA = ta.crossover(rsi, smoothedRsi) and rsi < rsiSmaBuyLine
|
|
rsiCrossBelowSMA = ta.crossunder(rsi, smoothedRsi) and rsi > rsiSmaSellLine
|
|
|
|
// Buy Signal (RSI geht hoch und ist unter der Buy-Line, Stochastic unter Buy-Line mit bullischem Cross, und RSI kreuzt über SMA unterhalb der RSI+SMA Buy Line)
|
|
buySignal = rsiUp and rsi < rsiBuyLine and bullishCross and stochK < stochBuyLine and rsiCrossAboveSMA
|
|
|
|
// Sell Signal (RSI geht runter und ist über der Sell-Line, Stochastic über Sell-Line mit bärischem Cross, und RSI kreuzt unter SMA oberhalb der RSI+SMA Sell Line)
|
|
sellSignal = rsiDown and rsi > rsiSellLine and bearishCross and stochK > stochSellLine and rsiCrossBelowSMA
|
|
|
|
// Plot RSI, Smoothed RSI, and Stochastic for reference with default visibility off
|
|
plot(rsi, title="RSI", color=color.yellow, linewidth=2, display=display.none)
|
|
plot(smoothedRsi, title="Smoothed RSI", color=color.blue, linewidth=2, display=display.none)
|
|
hline(rsiBuyLine, "RSI Buy Line", color=color.green, linewidth=2, linestyle=hline.style_solid, display=display.none)
|
|
hline(rsiSellLine, "RSI Sell Line", color=color.red, linewidth=2, linestyle=hline.style_solid, display=display.none)
|
|
hline(rsiSmaBuyLine, "RSI + MA Buy Line", color=color.purple, linewidth=2, linestyle=hline.style_solid, display=display.none)
|
|
hline(rsiSmaSellLine, "RSI + MA Sell Line", color=color.orange, linewidth=2, linestyle=hline.style_solid, display=display.none)
|
|
plot(stochK, title="Stochastic %K", color=color.aqua, linewidth=2, display=display.none)
|
|
plot(stochD, title="Stochastic %D", color=color.red, linewidth=3, display=display.none)
|
|
hline(stochBuyLine, "Stochastic Buy Line", color=color.green, linewidth=2, linestyle=hline.style_solid, display=display.none)
|
|
hline(stochSellLine, "Stochastic Sell Line", color=color.red, linewidth=2, linestyle=hline.style_solid, display=display.none)
|
|
|
|
// Alert conditions
|
|
alertcondition(buySignal, title="Buy Signal", message="Buy Signal: RSI and Stochastic conditions met.")
|
|
alertcondition(sellSignal, title="Sell Signal", message="Sell Signal: RSI and Stochastic conditions met.")
|
|
|
|
// Plot buy and sell signals for visual reference
|
|
plotshape(series=buySignal, location=location.belowbar, color=color.new(color.green, 0), style=shape.labelup, text="BUY", textcolor=color.black, size=size.tiny)
|
|
plotshape(series=sellSignal, location=location.abovebar, color=color.new(color.red, 0), style=shape.labeldown, text="SELL", textcolor=color.black, size=size.tiny)
|
|
|
|
// Strategy orders
|
|
if (buySignal)
|
|
strategy.entry("Buy", strategy.long)
|
|
if (sellSignal)
|
|
strategy.entry("Sell", strategy.short)
|
|
|
|
```
|
|
|
|
> Detail
|
|
|
|
https://www.fmz.com/strategy/454761
|
|
|
|
> Last Modified
|
|
|
|
2024-06-21 17:55:30
|