
135 lines
8.6 KiB
Markdown
135 lines
8.6 KiB
Markdown
|
|
> Name
|
|
|
|
RSI与线性回归通道交易策略-RSI-and-Linear-Regression-Channel-Trading-Strategy
|
|
|
|
> Author
|
|
|
|
ChaoZhang
|
|
|
|
> Strategy Description
|
|
|
|
|
|
[trans]
|
|
#### 概述
|
|
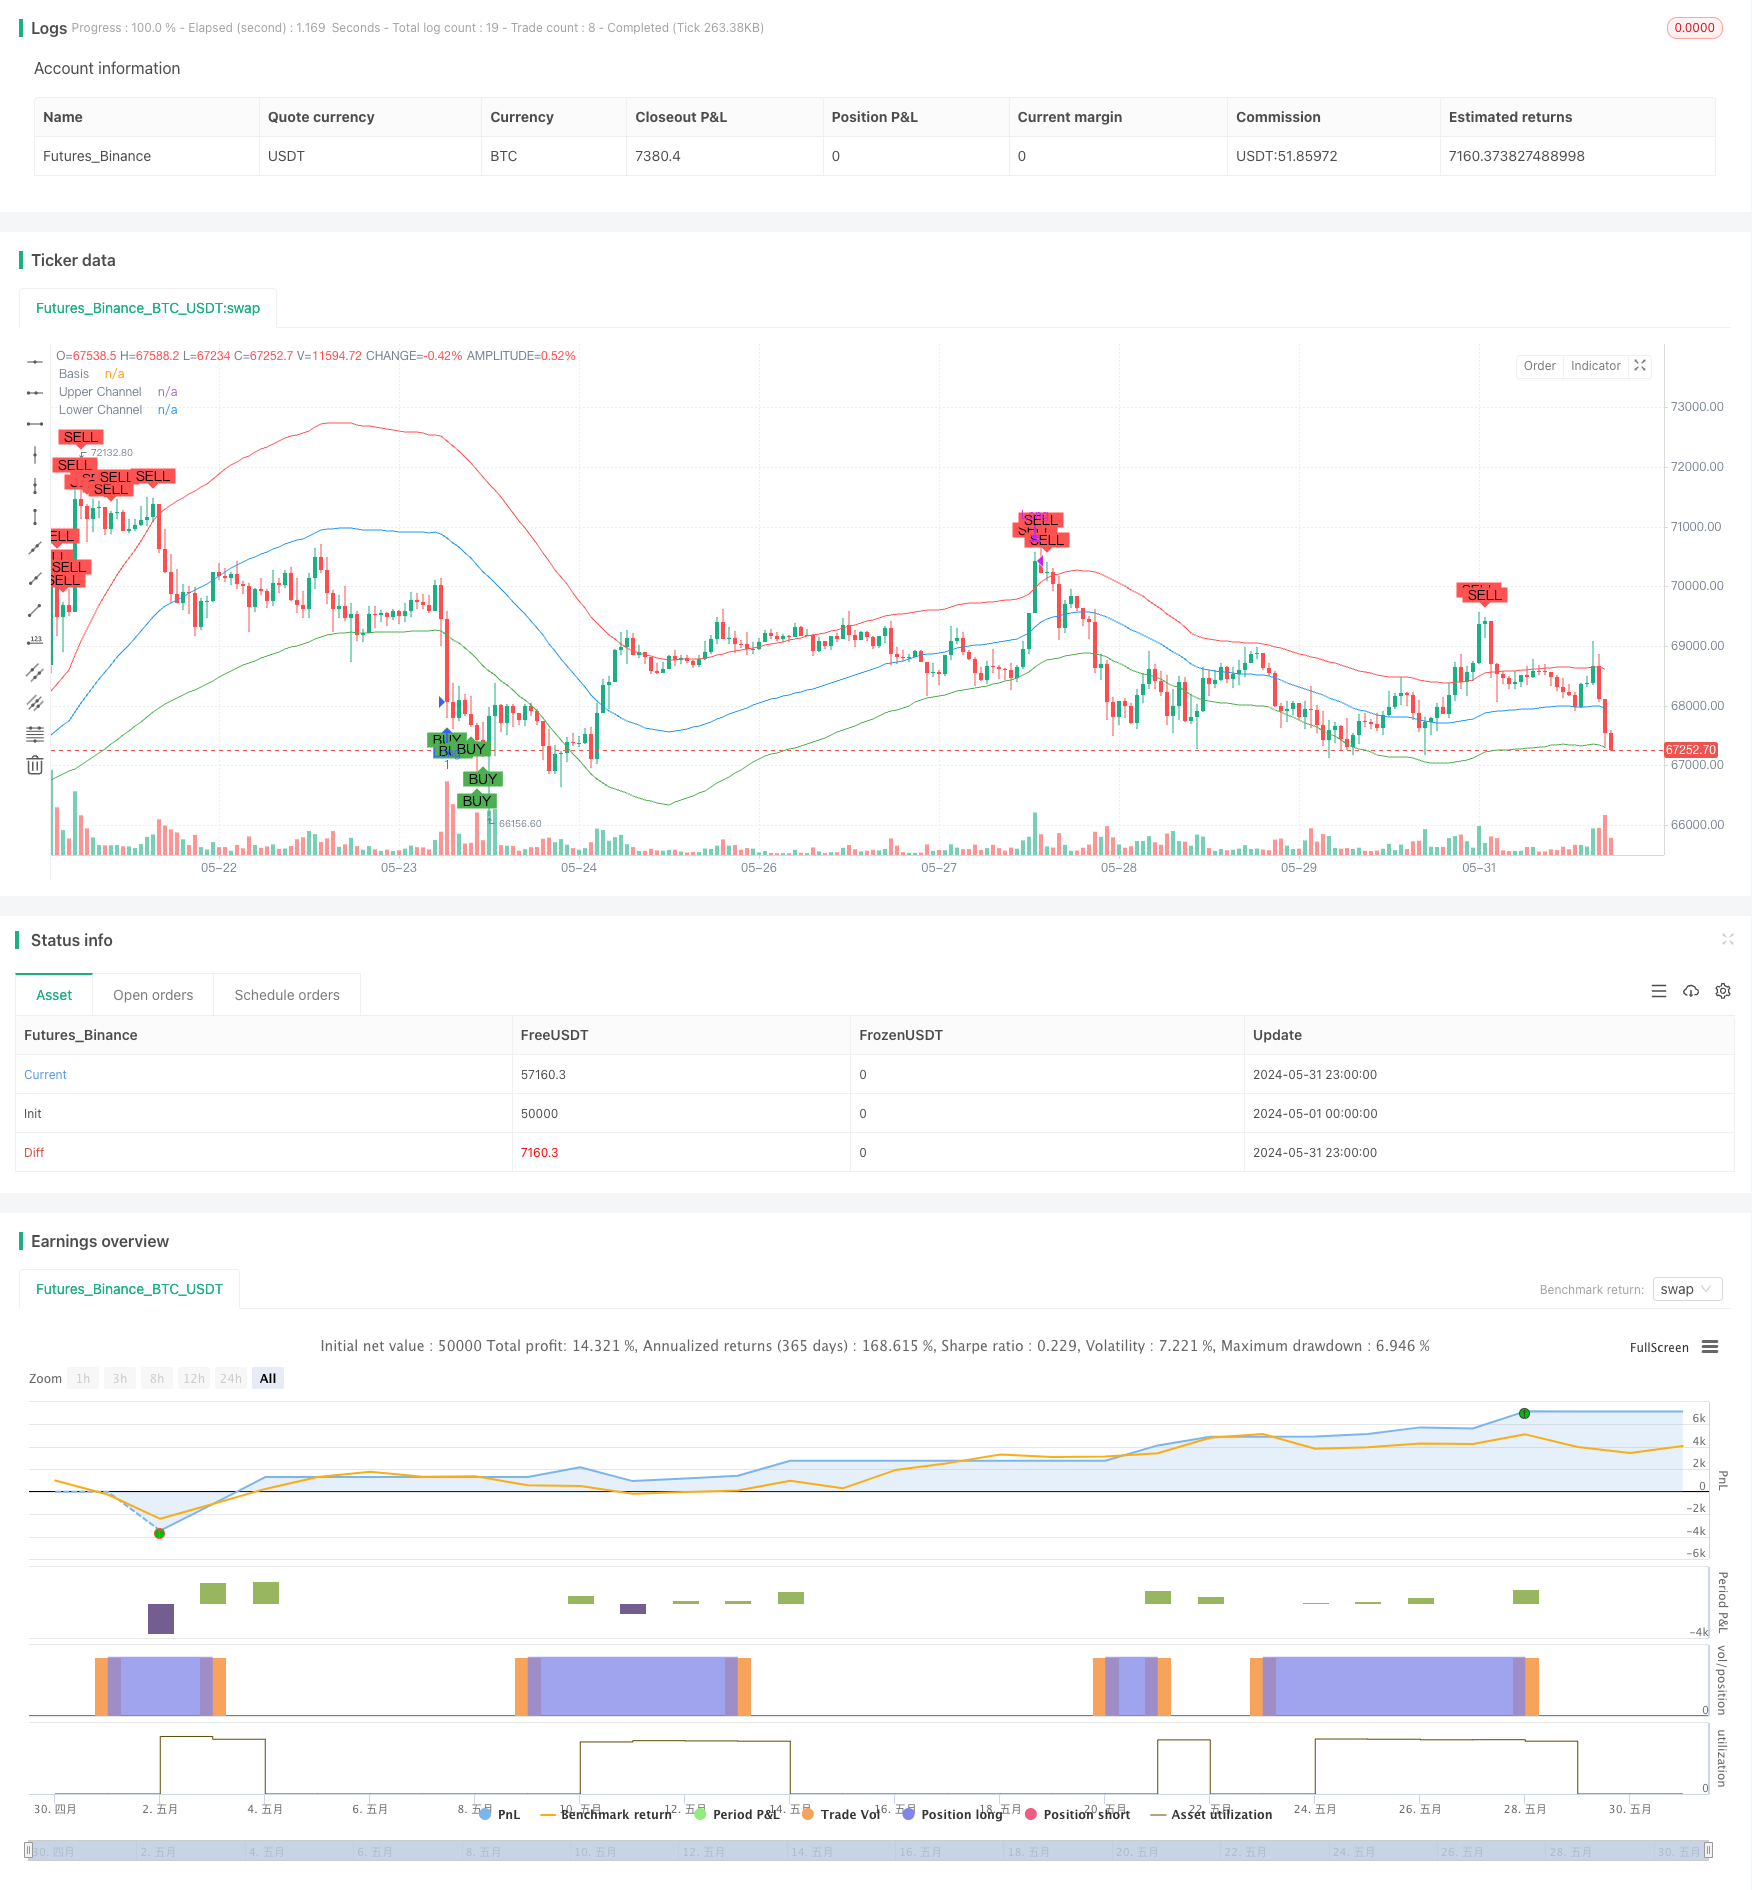
该策略结合了相对强弱指数(RSI)和线性回归通道(LRC)两个技术指标,旨在捕捉市场的超买和超卖机会。当价格触及线性回归通道的下轨,且RSI指标低于30时,策略会发出买入信号;当价格触及线性回归通道的上轨,且RSI指标高于70时,策略会发出卖出信号。这种结合RSI和LRC的方法可以有效地识别潜在的交易机会,同时降低假信号的可能性。
|
|
|
|
#### 策略原理
|
|
该策略的核心是RSI指标和线性回归通道。RSI是一个动量指标,用于衡量最近价格变化的幅度和方向。当RSI低于30时,市场被认为处于超卖状态;当RSI高于70时,市场被认为处于超买状态。线性回归通道是一种趋势跟踪指标,由一条基准线和两条平行线(上通道和下通道)组成。基准线是收盘价的线性回归,而上下通道线是基准线加减一定的标准差。当价格触及下通道线时,市场可能处于超卖状态并可能反弹;当价格触及上通道线时,市场可能处于超买状态并可能回落。通过结合RSI和LRC,该策略试图确认潜在的交易信号,以提高交易的成功率。
|
|
|
|
#### 策略优势
|
|
1. 结合了动量指标(RSI)和趋势跟踪指标(LRC),提供了更全面的市场分析。
|
|
2. 通过等待价格触及线性回归通道的上下轨,并确认RSI的超买超卖状态,策略可以过滤掉一些假信号。
|
|
3. 策略逻辑清晰,易于理解和实现。
|
|
4. 可以应用于不同的时间框架,如日线和4小时线,具有一定的灵活性。
|
|
|
|
#### 策略风险
|
|
1. 在震荡市场或趋势不明朗时,该策略可能会产生较多的假信号。
|
|
2. RSI和LRC的参数选择可能会影响策略的表现,不恰当的参数设置可能导致策略失效。
|
|
3. 该策略没有考虑风险管理,如止损和仓位管理,这可能导致大的回撤。
|
|
4. 策略的表现可能因市场状况的变化而有所不同,在某些市场环境下可能表现不佳。
|
|
|
|
#### 策略优化方向
|
|
1. 引入更多的技术指标或市场情绪指标,以提高信号的可靠性。
|
|
2. 优化RSI和LRC的参数设置,以适应不同的市场状况和交易品种。
|
|
3. 引入风险管理措施,如止损和动态仓位管理,以控制潜在的损失。
|
|
4. 考虑加入趋势过滤器,以避免在震荡市场中交易。
|
|
5. 对策略进行回测和优化,以确定最佳的参数组合和交易规则。
|
|
|
|
#### 总结
|
|
RSI与线性回归通道交易策略通过结合动量指标和趋势跟踪指标,试图捕捉市场的超买超卖机会。该策略的优势在于逻辑清晰,易于实现,并且可以应用于不同的时间框架。然而,策略也存在一些风险,如假信号、参数敏感性和缺乏风险管理等。为了提高策略的表现,可以考虑引入更多的指标、优化参数设置、加入风险管理措施和趋势过滤器等。总的来说,该策略提供了一个基于RSI和LRC的交易框架,但仍需要进一步的优化和完善。
|
|
|
|
||
|
|
|
|
#### Overview
|
|
This strategy combines the Relative Strength Index (RSI) and Linear Regression Channel (LRC) technical indicators to capture overbought and oversold opportunities in the market. When the price touches the lower band of the linear regression channel and the RSI indicator is below 30, the strategy generates a buy signal. When the price touches the upper band of the linear regression channel and the RSI indicator is above 70, the strategy generates a sell signal. This approach of combining RSI and LRC can effectively identify potential trading opportunities while reducing the likelihood of false signals.
|
|
|
|
#### Strategy Principle
|
|
The core of this strategy is the RSI indicator and the linear regression channel. RSI is a momentum indicator used to measure the magnitude and direction of recent price changes. When RSI is below 30, the market is considered oversold, and when RSI is above 70, the market is considered overbought. The linear regression channel is a trend-following indicator consisting of a baseline and two parallel lines (upper and lower channels). The baseline is the linear regression of the closing prices, while the upper and lower channel lines are the baseline plus or minus a certain standard deviation. When the price touches the lower channel line, the market may be oversold and could potentially bounce back. When the price touches the upper channel line, the market may be overbought and could potentially pull back. By combining RSI and LRC, this strategy aims to confirm potential trading signals to increase the success rate of trades.
|
|
|
|
#### Strategy Advantages
|
|
1. Combines a momentum indicator (RSI) and a trend-following indicator (LRC) for a more comprehensive market analysis.
|
|
2. By waiting for the price to touch the upper or lower bands of the linear regression channel and confirming the overbought or oversold state of RSI, the strategy can filter out some false signals.
|
|
3. The strategy logic is clear and easy to understand and implement.
|
|
4. Can be applied to different timeframes, such as daily and 4-hour charts, providing some flexibility.
|
|
|
|
#### Strategy Risks
|
|
1. In choppy markets or when the trend is unclear, this strategy may generate more false signals.
|
|
2. The choice of parameters for RSI and LRC may affect the performance of the strategy, and inappropriate parameter settings may lead to strategy failure.
|
|
3. The strategy does not consider risk management, such as stop-loss and position sizing, which may lead to large drawdowns.
|
|
4. The performance of the strategy may vary depending on market conditions and may not perform well in certain market environments.
|
|
|
|
#### Strategy Optimization Directions
|
|
1. Introduce more technical indicators or market sentiment indicators to improve the reliability of signals.
|
|
2. Optimize the parameter settings for RSI and LRC to adapt to different market conditions and trading instruments.
|
|
3. Introduce risk management measures, such as stop-loss and dynamic position sizing, to control potential losses.
|
|
4. Consider adding a trend filter to avoid trading in choppy markets.
|
|
5. Backtest and optimize the strategy to determine the best parameter combinations and trading rules.
|
|
|
|
#### Summary
|
|
The RSI and Linear Regression Channel Trading Strategy attempts to capture overbought and oversold opportunities in the market by combining momentum and trend-following indicators. The advantages of this strategy include its clear logic, ease of implementation, and applicability to different timeframes. However, the strategy also has some risks, such as false signals, parameter sensitivity, and lack of risk management. To improve the performance of the strategy, one can consider introducing more indicators, optimizing parameter settings, incorporating risk management measures, and adding trend filters. Overall, this strategy provides a framework for trading based on RSI and LRC but still requires further optimization and refinement.
|
|
[/trans]
|
|
|
|
|
|
|
|
> Source (PineScript)
|
|
|
|
``` pinescript
|
|
/*backtest
|
|
start: 2024-05-01 00:00:00
|
|
end: 2024-05-31 23:59:59
|
|
period: 1h
|
|
basePeriod: 15m
|
|
exchanges: [{"eid":"Futures_Binance","currency":"BTC_USDT"}]
|
|
*/
|
|
|
|
//@version=5
|
|
strategy("RSI and Linear Regression Channel Strategy", overlay=true)
|
|
|
|
// Define input parameters
|
|
rsiLength = input(14, title="RSI Length")
|
|
channelLength = input(100, title="Linear Regression Channel Length")
|
|
rsiBuyThreshold = 30
|
|
rsiSellThreshold = 70
|
|
|
|
// Calculate RSI
|
|
rsi = ta.rsi(close, rsiLength)
|
|
|
|
// Calculate Linear Regression Channel
|
|
basis = ta.linreg(close, channelLength, 0)
|
|
dev = ta.stdev(close, channelLength)
|
|
upperChannel = basis + dev
|
|
lowerChannel = basis - dev
|
|
|
|
// Plot Linear Regression Channel
|
|
plot(basis, color=color.blue, title="Basis")
|
|
plot(upperChannel, color=color.red, title="Upper Channel")
|
|
plot(lowerChannel, color=color.green, title="Lower Channel")
|
|
|
|
// Entry condition: Price touches lower channel and RSI crosses below buy threshold
|
|
longCondition = (close <= lowerChannel) and (rsi < rsiBuyThreshold)
|
|
|
|
// Exit condition: Price touches upper channel and RSI crosses above sell threshold
|
|
shortCondition = (close >= upperChannel) and (rsi > rsiSellThreshold)
|
|
|
|
// Strategy execution
|
|
if (longCondition)
|
|
strategy.entry("Long", strategy.long)
|
|
|
|
if (shortCondition)
|
|
strategy.close("Long")
|
|
|
|
// Plot buy/sell signals on the chart
|
|
plotshape(series=longCondition, location=location.belowbar, color=color.green, style=shape.labelup, text="BUY")
|
|
plotshape(series=shortCondition, location=location.abovebar, color=color.red, style=shape.labeldown, text="SELL")
|
|
|
|
```
|
|
|
|
> Detail
|
|
|
|
https://www.fmz.com/strategy/453244
|
|
|
|
> Last Modified
|
|
|
|
2024-06-03 11:19:49
|