
218 lines
9.2 KiB
Markdown
218 lines
9.2 KiB
Markdown
|
|
> Name
|
|
|
|
RSI与布林带双重策略RSI-and-Bollinger-Bands-Dual-Strategy
|
|
|
|
> Author
|
|
|
|
ChaoZhang
|
|
|
|
> Strategy Description
|
|
|
|
|
|
[trans]
|
|
|
|
## 概述
|
|
|
|
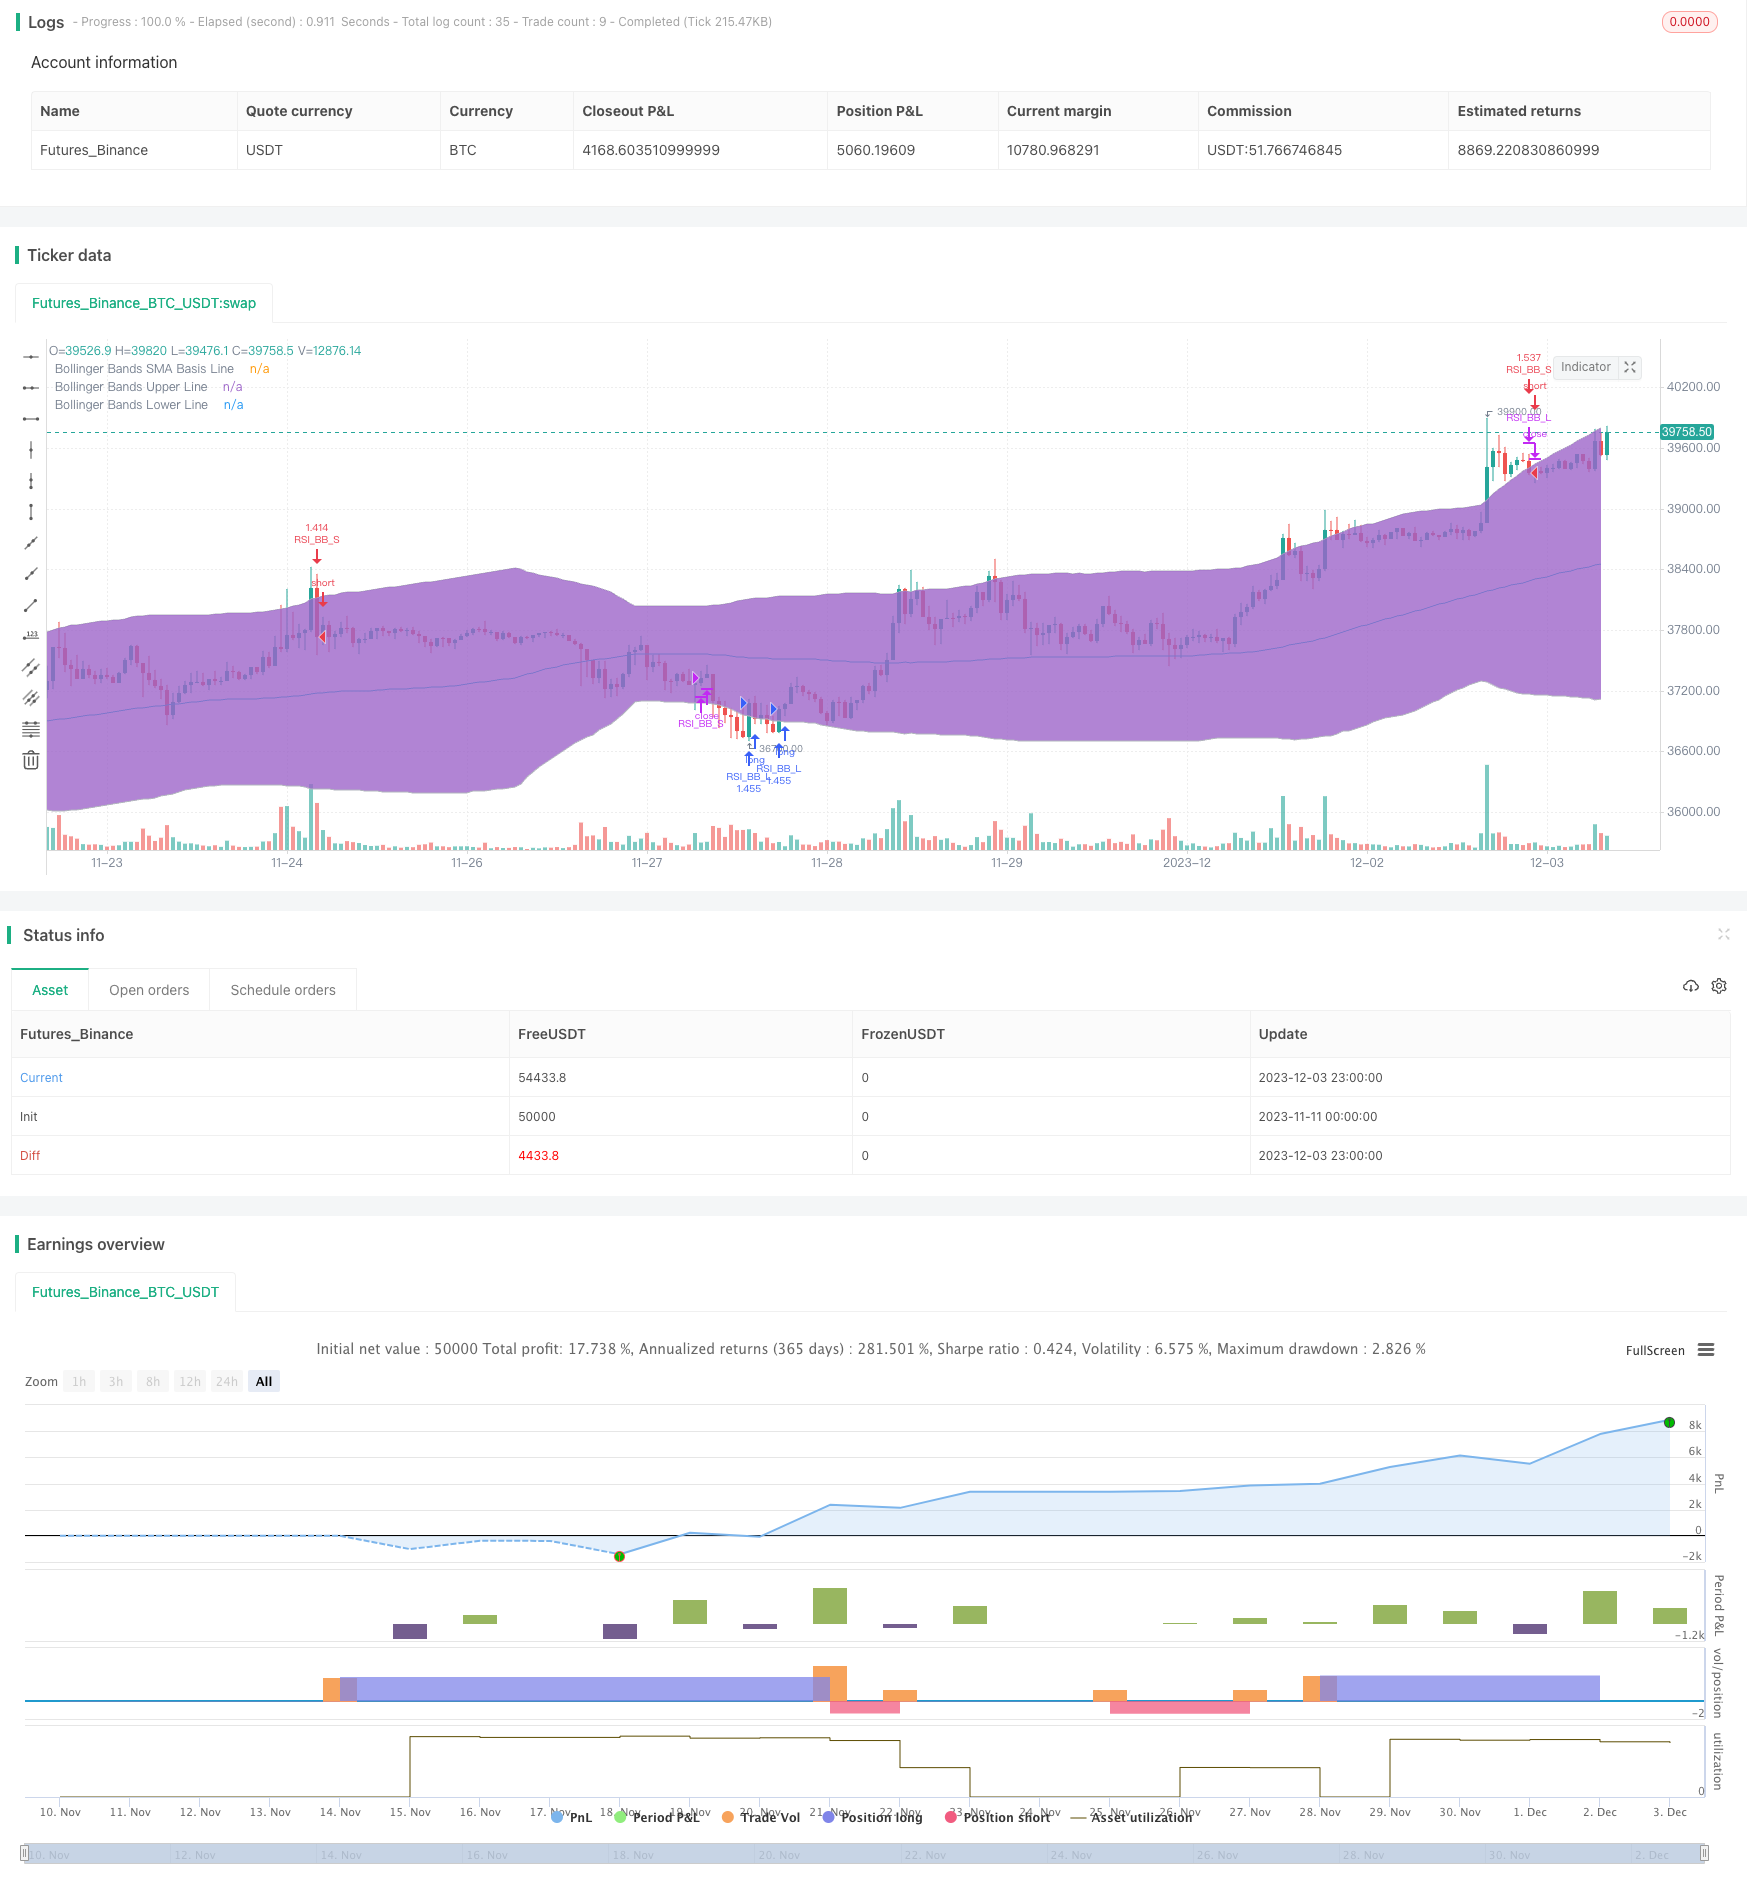
该策略的核心思想是结合相对强弱指标(RSI)和布林带这两个技术指标来实现双重交易信号的过滤,在最大程度上减少虚假信号的干扰,提高信号质量。
|
|
|
|
当RSI指标显示超买或超卖信号,同时价格突破或回调布林带上下轨时,会形成交易机会。它综合了两个不同指标的优势,既考虑了市场波动的统计特征,也关注了市场参与者的多空态势,形成全面的判断依据。
|
|
|
|
## 策略原理
|
|
|
|
RSI部分,我们同时关注两个不同周期的RSI指标,一个较短周期的用来捕捉超买超卖信号,一个较长周期的用来确认趋势反转。当短周期RSI显示超买超卖且长周期RSI显示反转时,认为形成交易机会。
|
|
|
|
布林带部分,我们关注价格是否突破上下轨。突破布林带上轨为卖点,突破下轨为买点。同时我们也关注价格是否回调布林带,这样可以及时捕捉反转机会。
|
|
|
|
当RSI信号和布林带信号同时呈现时,我们就认为交易机会成型,发出交易指令。
|
|
|
|
## 优势分析
|
|
|
|
- 双重指标过滤,可靠性较高,避免多余交易
|
|
- 兼顾趋势和反转,把握不同市场阶段的机会
|
|
- 参数可配置,可以按需要调整参数
|
|
- 内置时间和资金管理
|
|
|
|
## 风险分析
|
|
|
|
- 布林带参数设置不当可能导致虚假信号
|
|
- 无法应对市场剧烈波动的极端情况
|
|
- RSI指标发散时可能出现错误信号
|
|
- 需要优化参数以适应不同品种和周期
|
|
|
|
可以通过参数优化、适当缩小仓位、人工干预等方式规避和控制风险。
|
|
|
|
## 优化方向
|
|
|
|
- 调整RSI参数,优化超买超卖判断
|
|
- 调整布林带宽度,优化布林带突破策略
|
|
- 增加仓位管理机制
|
|
- 增加止损策略
|
|
- 结合更多指标实现多因子模型
|
|
|
|
## 总结
|
|
|
|
RSI与布林带双重策略充分利用两个指标的优势实现高质量信号的产生,在参数优化和风险管理到位的前提下,可以获得稳定的投资回报。结合更多信号和模型也是未来的可能方向。
|
|
|
|
||
|
|
|
|
## Overview
|
|
|
|
The core idea of this strategy is to combine the Relative Strength Index (RSI) and Bollinger Bands, two technical indicators, to filter dual trading signals and minimize interference from false signals as much as possible, improving signal quality.
|
|
|
|
When the RSI indicator shows overbought or oversold signals while the price breaks through or pulls back the upper and lower rails of the Bollinger Bands, trading opportunities will emerge. It combines the advantages of the two different indicators, taking into account both the statistical characteristics of market fluctuations and the long/short stance of market participants to form a comprehensive basis for judgment.
|
|
|
|
## Strategy Principle
|
|
|
|
For the RSI part, we monitor two RSI indicators with different cycle lengths at the same time. One with a shorter cycle is used to capture overbought and oversold signals, while one with a longer cycle is used to confirm trend reversals. When the short-cycle RSI shows overbought/oversold and the long-cycle RSI shows reversal, we believe a trading opportunity has formed.
|
|
|
|
For the Bollinger Bands part, we monitor whether the price breaks through the upper and lower rails. Breaking through the upper rail of the Bollinger Bands is the sell point, and breaking through the lower rail is the buy point. At the same time, we also monitor whether the price pulls back to the Bollinger Bands so that reversal opportunities can be captured in a timely manner.
|
|
|
|
When the RSI and Bollinger Bands signals appear simultaneously, we believe the trading opportunity has taken shape and a trading order is issued.
|
|
|
|
## Advantage Analysis
|
|
|
|
- Dual indicator filtering provides higher reliability and avoids unnecessary trades
|
|
- Captures opportunities in both trend and reversal market stages
|
|
- Configurable parameters for adjustable settings as needed
|
|
- Embedded time and money management
|
|
|
|
## Risk Analysis
|
|
|
|
- Improper Bollinger Bands parameter settings may cause false signals
|
|
- Unable to cope with extreme market volatility
|
|
- RSI divergence may generate incorrect signals
|
|
- Parameter optimization needed to adapt to different products and cycles
|
|
|
|
Risks can be avoided and controlled through parameter optimization, appropriately reducing positions, manual intervention, etc.
|
|
|
|
## Optimization Directions
|
|
|
|
- Adjust RSI parameters to optimize overbought/oversold judgments
|
|
- Adjust Bollinger Bands width to optimize breakout strategies
|
|
- Add position management mechanism
|
|
- Add stop loss strategy
|
|
- Incorporate more indicators to build multi-factor models
|
|
|
|
## Conclusion
|
|
|
|
The RSI and Bollinger Bands dual strategy fully utilizes the strengths of the two indicators to generate high-quality signals. With proper parameter optimization and risk management, it can achieve steady investment returns. Incorporating more signals and models is also a potential future direction.
|
|
|
|
[/trans]
|
|
|
|
> Strategy Arguments
|
|
|
|
|
|
|
|
|Argument|Default|Description|
|
|
|----|----|----|
|
|
|v_input_6|7|L_Length|
|
|
|v_input_7|45|L_OverSold|
|
|
|v_input_8|14|S_Length|
|
|
|v_input_9|65|S_OverBought|
|
|
|v_input_10|100|Bollinger Period Length|
|
|
|v_input_11|true|Enable Bar Color?|
|
|
|v_input_12|true|Enable Background Color?|
|
|
|v_input_1|false|(?Date & Time)Enable Date Filter|
|
|
|v_input_2|timestamp(1 Jan 2000 00:00 +0000)|Start Date Filter|
|
|
|v_input_3|timestamp(1 Jan 2100 00:00 +0000)|End Date Filter|
|
|
|v_input_4|false|Enable Time Session Filter|
|
|
|v_input_5|1000-2200:1234567|Trading Session|
|
|
|
|
|
|
> Source (PineScript)
|
|
|
|
``` pinescript
|
|
/*backtest
|
|
start: 2023-11-11 00:00:00
|
|
end: 2023-12-04 00:00:00
|
|
period: 1h
|
|
basePeriod: 15m
|
|
exchanges: [{"eid":"Futures_Binance","currency":"BTC_USDT"}]
|
|
*/
|
|
|
|
//@version=4
|
|
strategy("Ezieh Str.v2", shorttitle="Ezieh Str.v2", overlay=true, pyramiding=10, currency=currency.USD, slippage=3, commission_type=strategy.commission.cash_per_order, commission_value=0.04, initial_capital=1000)
|
|
|
|
|
|
|
|
UseDateFilter = input(title="Enable Date Filter" ,type=input.bool ,defval=false ,group="Date & Time" ,tooltip="Turns on/off date filter")
|
|
StartDate = input(title="Start Date Filter" ,type=input.time ,defval=timestamp("1 Jan 2000 00:00 +0000") ,group="Date & Time" ,tooltip="Date & time to start excluding trades")
|
|
EndDate = input(title="End Date Filter" ,type=input.time ,defval=timestamp("1 Jan 2100 00:00 +0000") ,group="Date & Time" ,tooltip="Date & time to stop excluding trades")
|
|
UseTimeFilter = input(title="Enable Time Session Filter" ,type=input.bool ,defval=false ,group="Date & Time" ,tooltip="Turns on/off time session filter")
|
|
TradingSession = input(title="Trading Session" ,type=input.session ,defval="1000-2200:1234567" ,group="Date & Time" ,tooltip="No trades will be taken outside of this range")
|
|
|
|
In(t) => na(time(timeframe.period, t)) == false
|
|
TimeFilter = (UseTimeFilter and not In(TradingSession)) or not UseTimeFilter
|
|
DateFilter = time >= StartDate and time <= EndDate
|
|
|
|
DateTime = (UseDateFilter ? not DateFilter : true) and (UseTimeFilter ? In(TradingSession) : true)
|
|
|
|
///////////// RSI
|
|
L_RSI_Length = input(7 , title="L_Length")
|
|
L_RSI_OverSold = input(45 , title="L_OverSold")
|
|
S_RSI_Length = input(14 , title="S_Length")
|
|
S_RSI_OverBought = input(65 , title="S_OverBought")
|
|
|
|
price = close
|
|
Lvrsi = rsi(price, L_RSI_Length)
|
|
Svrsi = rsi(price, S_RSI_Length)
|
|
|
|
///////////// Bollinger Bands
|
|
BBlength = input(title="Bollinger Period Length", type=input.integer, defval=100, minval=2)
|
|
BBmult = 2.1 // input(2.0, minval=0.001, maxval=50,title="Bollinger Bands Standard Deviation")
|
|
BBbasis = sma(price, BBlength)
|
|
BBdev = BBmult * stdev(price, BBlength)
|
|
BBupper = BBbasis + BBdev
|
|
BBlower = BBbasis - BBdev
|
|
source = close
|
|
plot(BBbasis, color=color.aqua,title="Bollinger Bands SMA Basis Line")
|
|
p1 = plot(BBupper, color=color.silver,title="Bollinger Bands Upper Line")
|
|
p2 = plot(BBlower, color=color.silver,title="Bollinger Bands Lower Line")
|
|
fill(p1, p2)
|
|
|
|
|
|
///////////// Colors
|
|
switch1=input(true, title="Enable Bar Color?")
|
|
switch2=input(true, title="Enable Background Color?")
|
|
|
|
|
|
|
|
///////////// Condition
|
|
LongCondition = crossover(Lvrsi, L_RSI_OverSold) and crossover(close ,BBlower)
|
|
ShortCondition = crossunder(Svrsi, S_RSI_OverBought) and crossunder(close,BBupper)
|
|
Longexcon = crossunder(low, BBupper)
|
|
Shortexcon = crossover(low, BBlower)
|
|
|
|
qt = round(strategy.equity/price, 3)
|
|
|
|
///////////// RSI + Bollinger Bands Strategy
|
|
if (not na(Lvrsi))
|
|
|
|
if LongCondition and DateTime
|
|
strategy.entry("RSI_BB_L", strategy.long, qty=qt, comment="Long")
|
|
else
|
|
strategy.cancel(id="RSI_BB_L")
|
|
|
|
if Longexcon
|
|
strategy.close("RSI_BB_L", qty_percent = 100, comment = "L_exit")
|
|
|
|
if ShortCondition and DateTime
|
|
strategy.entry("RSI_BB_S", strategy.short, qty=qt, comment="Short")
|
|
else
|
|
strategy.cancel(id="RSI_BB_S")
|
|
|
|
if Shortexcon
|
|
strategy.close("RSI_BB_S", qty_percent = 100, comment = "S_exit")
|
|
|
|
//plot(strategy.equity, title="equity", color=red, linewidth=2, style=areabr)
|
|
```
|
|
|
|
> Detail
|
|
|
|
https://www.fmz.com/strategy/435096
|
|
|
|
> Last Modified
|
|
|
|
2023-12-12 11:53:49
|