
9.0 KiB
Name
MACD均线牛熊转换策略MACD-Moving-Average-Bull-Bear-Conversion-Strategy
Author
ChaoZhang
Strategy Description
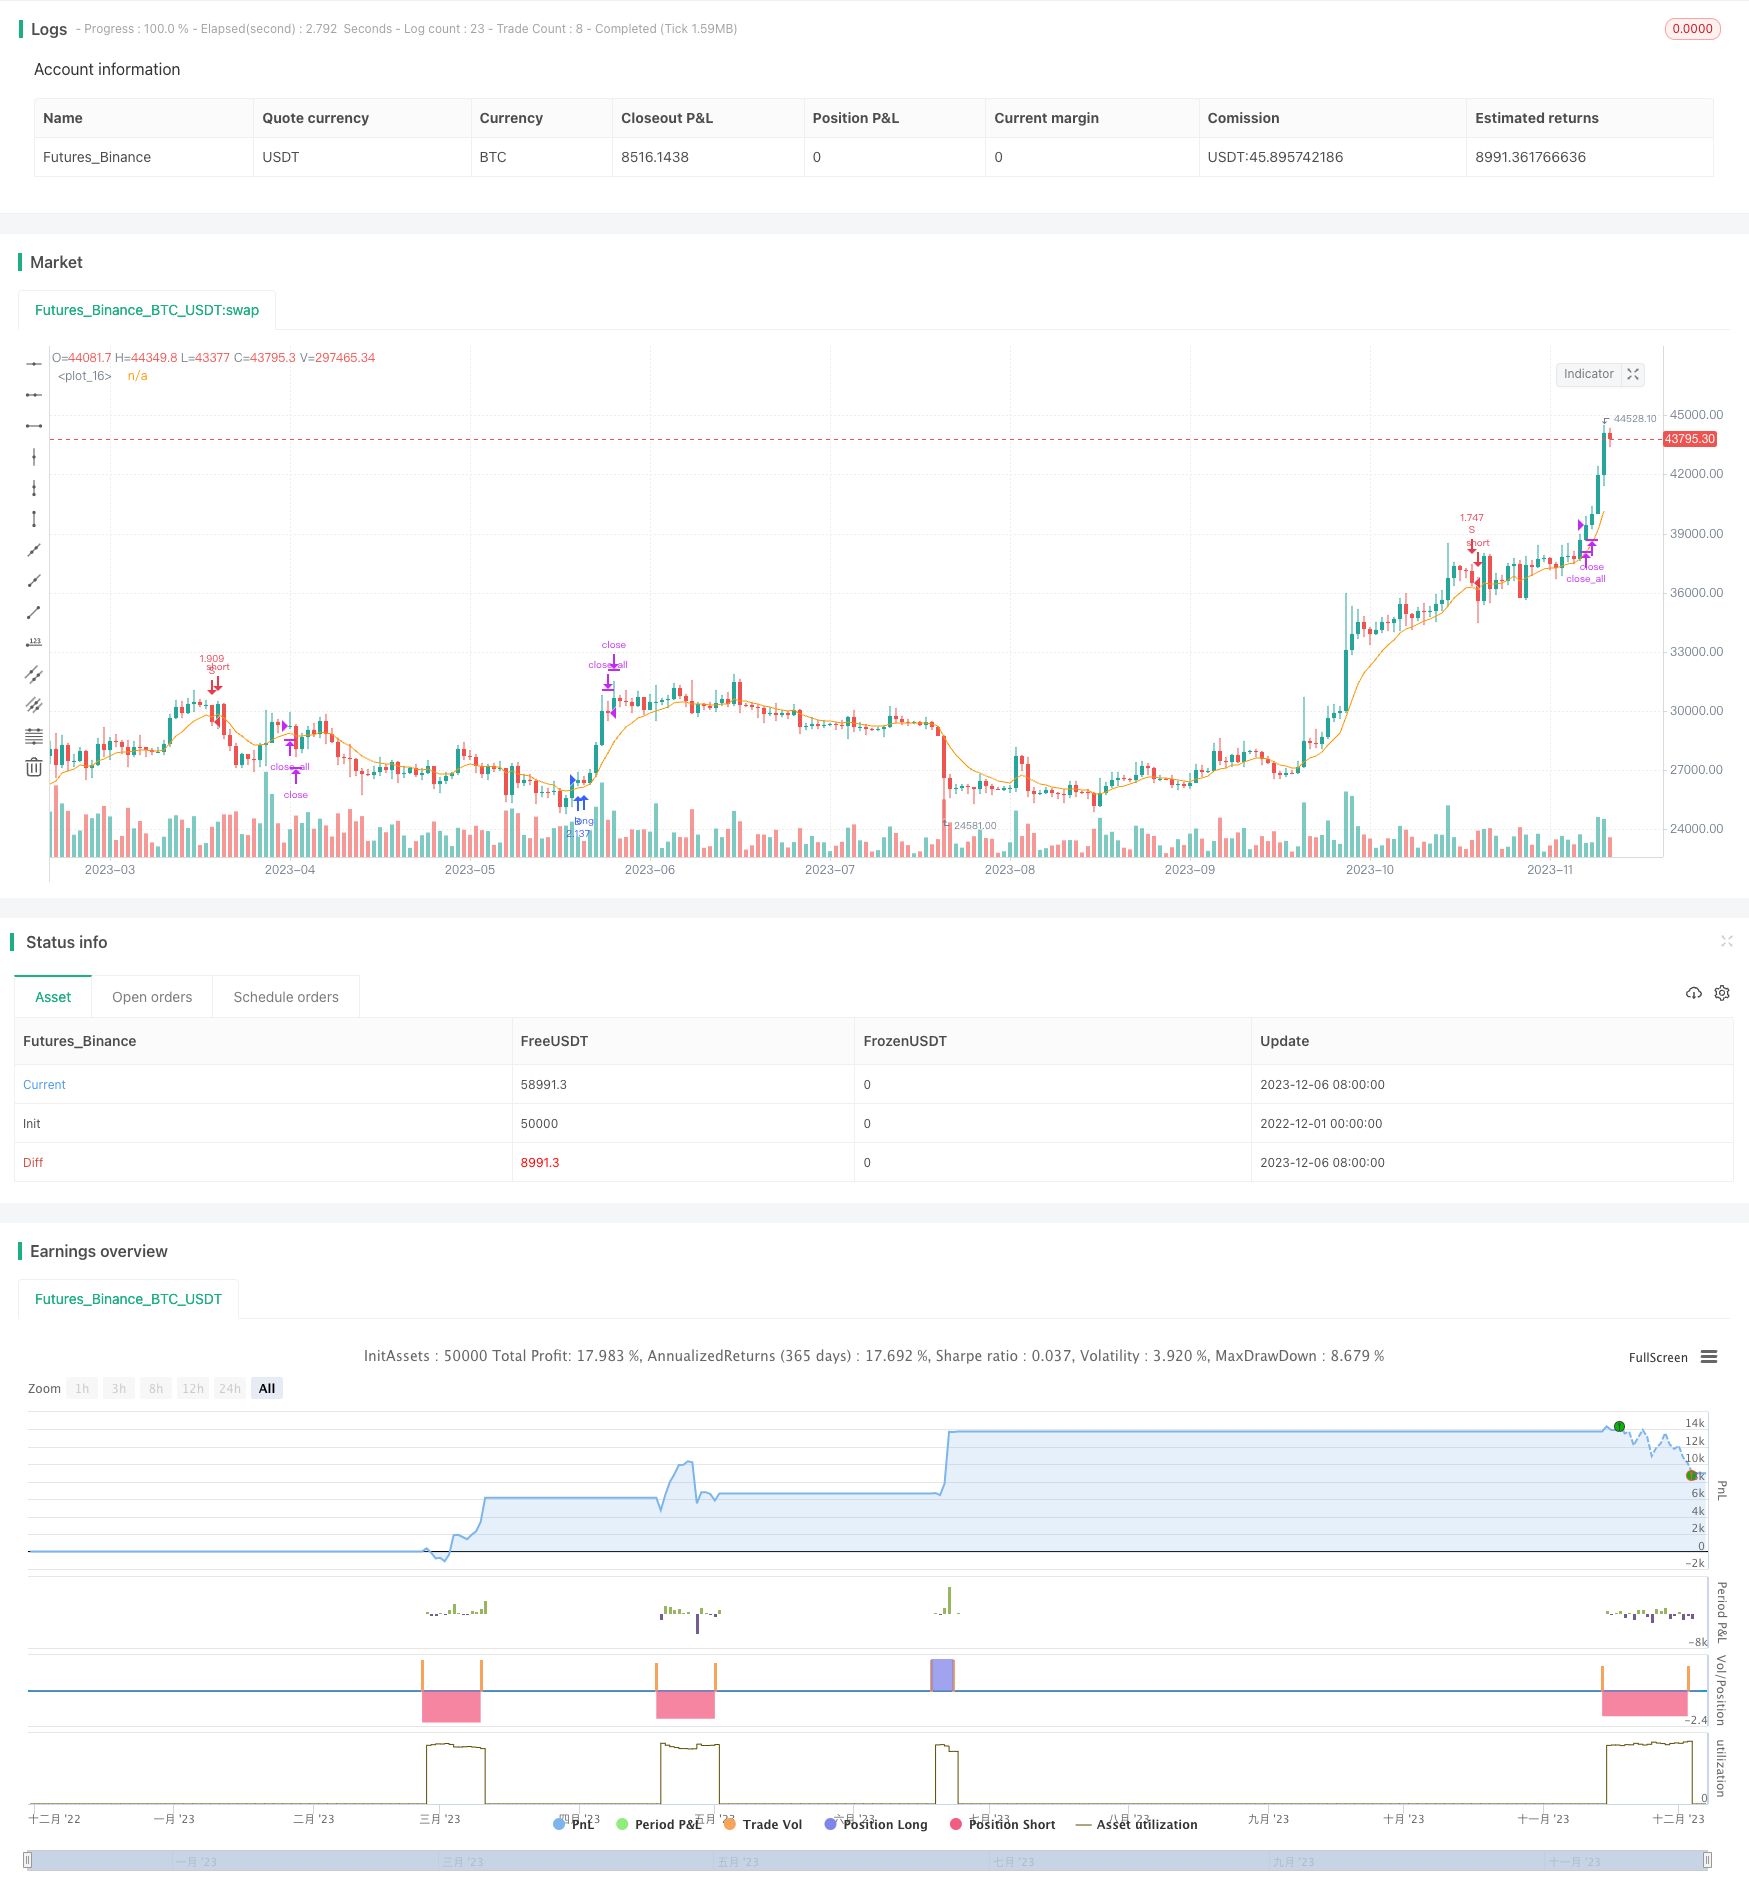 [trans]
概述
MACD均线牛熊转换策略通过计算MACD指标的DIFF和DEA均线,判断市场趋势是否发生转折,进而产生交易信号。当DIFF上穿DEA时,做多;当DIFF下穿DEA时,做空。该策略同时结合价格EMA均线过滤,避免出现假突破。
策略原理
该策略主要基于MACD指标的DIFF和DEA均线。MACD代表指数移动平均线差值,由DIFF、DEA和MACD线组成。其中,DIFF线代表短期EMA均线和长期EMA均线的差值,DEA线是DIFF的EMA均线,用来验证DIFF线信号,MACD线是DIFF减DEA的差值,代表背离。
当DIFF向上突破DEA时,代表短期均线开始走强,市场步入多头,当DIFF向下跌破DEA时,代表短期均线开始走弱,市场步入空头。因此,该策略在DIFF上穿DEA时做多,下穿时做空。
同时,策略还结合价格的EMA均线来过滤假突破。只有当DIFF向上突破DEA,且价格低于上一次做多价格时才做多;只有当DIFF向下突破DEA,且价格高于上一次做空价格时才做空。
优势分析
MACD均线牛熊转换策略结合MACD指标和价格EMA均线,避免了仅通过MACD指标产生的假信号,提高了交易效果。该策略判断市场趋势转换迅速,适合短线操作。
优势主要体现在:
- 使用MACD指标判断趋势转换点,捕捉市场转折时机
- 结合价格EMA均线进行过滤,减少假突破机会
- 交易信号产生快速,适合短线操作
- 实现了趋势跟踪,可以获取趋势中期收益
- 采用趋势转换操作思路,符合大部分交易者的思维模式
风险分析
MACD均线牛熊转换策略也存在一些风险,主要体现在:
- MACD指标容易产生误信号,需要价格EMA滤波器进行验证,但也会错过一部分移动
- 需密切关注DIFF和DEA均线,如果调整参数不当也会增大误信号
- 突破信号仅判断1根K线,可能出现被套现象
- 策略以DIFF和DEA交叉为主要交易信号,如果行情不明朗,交叉信号产生频繁,会增加交易频率
这些风险主要可以从以下几个方面进行优化:
- 调整MACD参数,减少误信号
- 增加过滤器强度,降低被套概率
- 增加持仓过滤,限制交易频率
优化方向
MACD均线牛熊转换策略还具有优化空间,可以从以下几个维度进行优化:
- 优化MACD参数,DIFF、DEA周期可调;
- 增加持仓时间过滤,降低交易频率;
- 增加止损止盈策略,控制单笔损益;
- 结合其他指标过滤,如BOLL上下轨、KD等;
- 增加趋势判断,避免逆势交易;
- 可基于该策略框架开发离场策略或止盈策略模板。
总结
MACD均线牛熊转换策略通过DIFF、DEA交叉判断市场步入多头和空头的时机,并配合价格EMA均线过滤假信号,实现了快速判断市场趋势转换的效果。该策略以简单清晰的交易逻辑,判断转换点迅速,适合短线与中线操作。下一步可从调整参数、增强过滤器、控制交易频率等方面进行优化,使策略更加稳定。
||
Overview
The MACD Moving Average Bull Bear Conversion Strategy calculates the DIFF and DEA lines of the MACD indicator to determine whether the market trend has reversed, thereby generating trading signals. It goes long when DIFF crosses above DEA and goes short when DIFF crosses below DEA. The strategy also incorporates price EMA filters to avoid false breakouts.
Strategy Logic
The strategy is mainly based on the DIFF and DEA lines of the MACD indicator. MACD stands for Moving Average Convergence Divergence, consisting of the DIFF, DEA and MACD lines. Among them, DIFF represents the difference between short-term EMA and long-term EMA, DEA is the EMA of DIFF used to verify DIFF signals, and MACD represents the difference between DIFF and DEA, used to identify divergences.
When DIFF breaks above DEA, it means the short-term moving average starts strengthening and the market turns bullish. When DIFF breaks below DEA, it suggests the short-term moving average turns weak and the market becomes bearish. Therefore, this strategy goes long when DIFF crosses above DEA and goes short when crossing below.
In addition, the strategy incorporates price EMA filters to avoid false breakouts. It only goes long when DIFF breaks above DEA and price is below the previous long price, and only goes short when DIFF breaks below DEA and price is above previous short price.
Advantage Analysis
The MACD Moving Average Bull Bear Conversion Strategy combines the MACD indicator and price EMA filters to avoid false signals generated solely by the MACD, thus improving trading performance. This strategy quickly identifies market trend changes and is suitable for short-term trading.
The main advantages include:
- Using MACD to identify trend reversal points and capture turning points
- Incorporating price EMA filters to reduce false breakout opportunities
- Fast signal generation suitable for short-term trading
- Implementing trend following to capture mid-term trend profits
- Aligns with most traders' thinking pattern of trading at conversion points
Risk Analysis
The MACD Moving Average Bull Bear Conversion Strategy also has some risks:
- MACD is prone to generating false signals, requiring price EMA filters but will also miss some moves
- Need to closely monitor DIFF and DEA lines, improper parameter tuning increases false signals
- Breakout signals only consider 1 bar, with the risk of being whipsawed
- Strategy mainly relies on DIFF/DEA crossover for signals, can increase trade frequency if signals are too frequent
The main ways to optimize risks are:
- Adjust MACD parameters to reduce false signals
- Enhance filter strength to lower whipsaw occurrence
- Add filters on position holding to limit trade frequency
Optimization Directions
The MACD Moving Average Bull Bear Conversion Strategy can be further optimized in the following dimensions:
- Optimize MACD parameters of DIFF/DEA periods
- Add timing filters to lower trading frequency
- Incorporate stop loss/profit take strategies to control profit targets
- Add other indicator filters like BOLL bands and KD
- Incorporate trend bias to avoid counter-trend trading
- Develop exit strategies or profit taking templates based on this strategy framework
Conclusion
The MACD Moving Average Bull Bear Conversion Strategy identifies bullish/bearish market entry by DIFF and DEA crossover signals, and uses price EMA filters to remove false signals, effectively determining market trend reversal points. With simple and clear logic, it quickly identifies conversion points suitable for short-term and mid-term trading. Next steps to optimize include adjusting parameters, enhancing filters, and controlling trade frequency to make the strategy more robust.
[/trans]
Source (PineScript)
/*backtest
start: 2022-12-01 00:00:00
end: 2023-12-07 00:00:00
period: 1d
basePeriod: 1h
exchanges: [{"eid":"Futures_Binance","currency":"BTC_USDT"}]
*/

//@version=3
strategy("macd_strategy",
          shorttitle="macd",
          overlay=true,
          pyramiding=1,
          max_bars_back=5000,
          calc_on_order_fills = false,
          calc_on_every_tick=true,
          default_qty_type=strategy.percent_of_equity,
          default_qty_value=100,
          commission_type =strategy.commission.percent,
          commission_value=0.00075)
[diff, dea, _] = macd(close, 12, 26, 7)
dea_close = ema(diff, 3)
price = ema(close, 9)
plot(price)
cross_over_price = na
cross_over_signal = na
cross_over_price := cross_over_price[1]
cross_over_signal := cross_over_signal[1]

cross_under_price = na
cross_under_signal = na
cross_under_price := cross_under_price[1]
cross_under_signal := cross_under_signal[1]
if (crossover(diff,dea))
    cross_over_price := price[1]
    cross_over_signal := diff
if (crossunder(diff,dea))
    cross_under_price := price[1]
    cross_under_signal := diff
if dea > 0
    cross_over_price = na
    cross_over_signal = na
else
    cross_under_price = na
    cross_under_signal = na
if diff > 0
    if cross_under_price > cross_under_price[1]*1 and cross_under_signal < cross_under_signal[1]*0.95
        strategy.entry("S", strategy.short,  comment="S")
else
    if cross_over_price < cross_over_price[1]*1 and cross_over_signal > cross_over_signal[1]*0.95
        strategy.entry("B", strategy.long,  comment="B")
// strategy.exit("exit_s", "S", stop = strategy.position_avg_price*1.05, when=strategy.position_size < 0)
// strategy.exit("exit_b", "B", stop = strategy.position_avg_price*0.95, when=strategy.position_size > 0)
strategy.close_all(when=(strategy.position_size < 0 and (dea < 0 or diff > cross_under_signal*1 or crossover(diff, dea)) or (strategy.position_size > 0 and (dea > 0 or diff < cross_over_signal*1 or crossunder(diff, dea)))))
Detail
https://www.fmz.com/strategy/434702
Last Modified
2023-12-08 15:29:41