
8.8 KiB
Name
MACD动态趋势量化交易策略进阶版-Advanced-MACD-Dynamic-Trend-Quantitative-Trading-Strategy
Author
ChaoZhang
Strategy Description
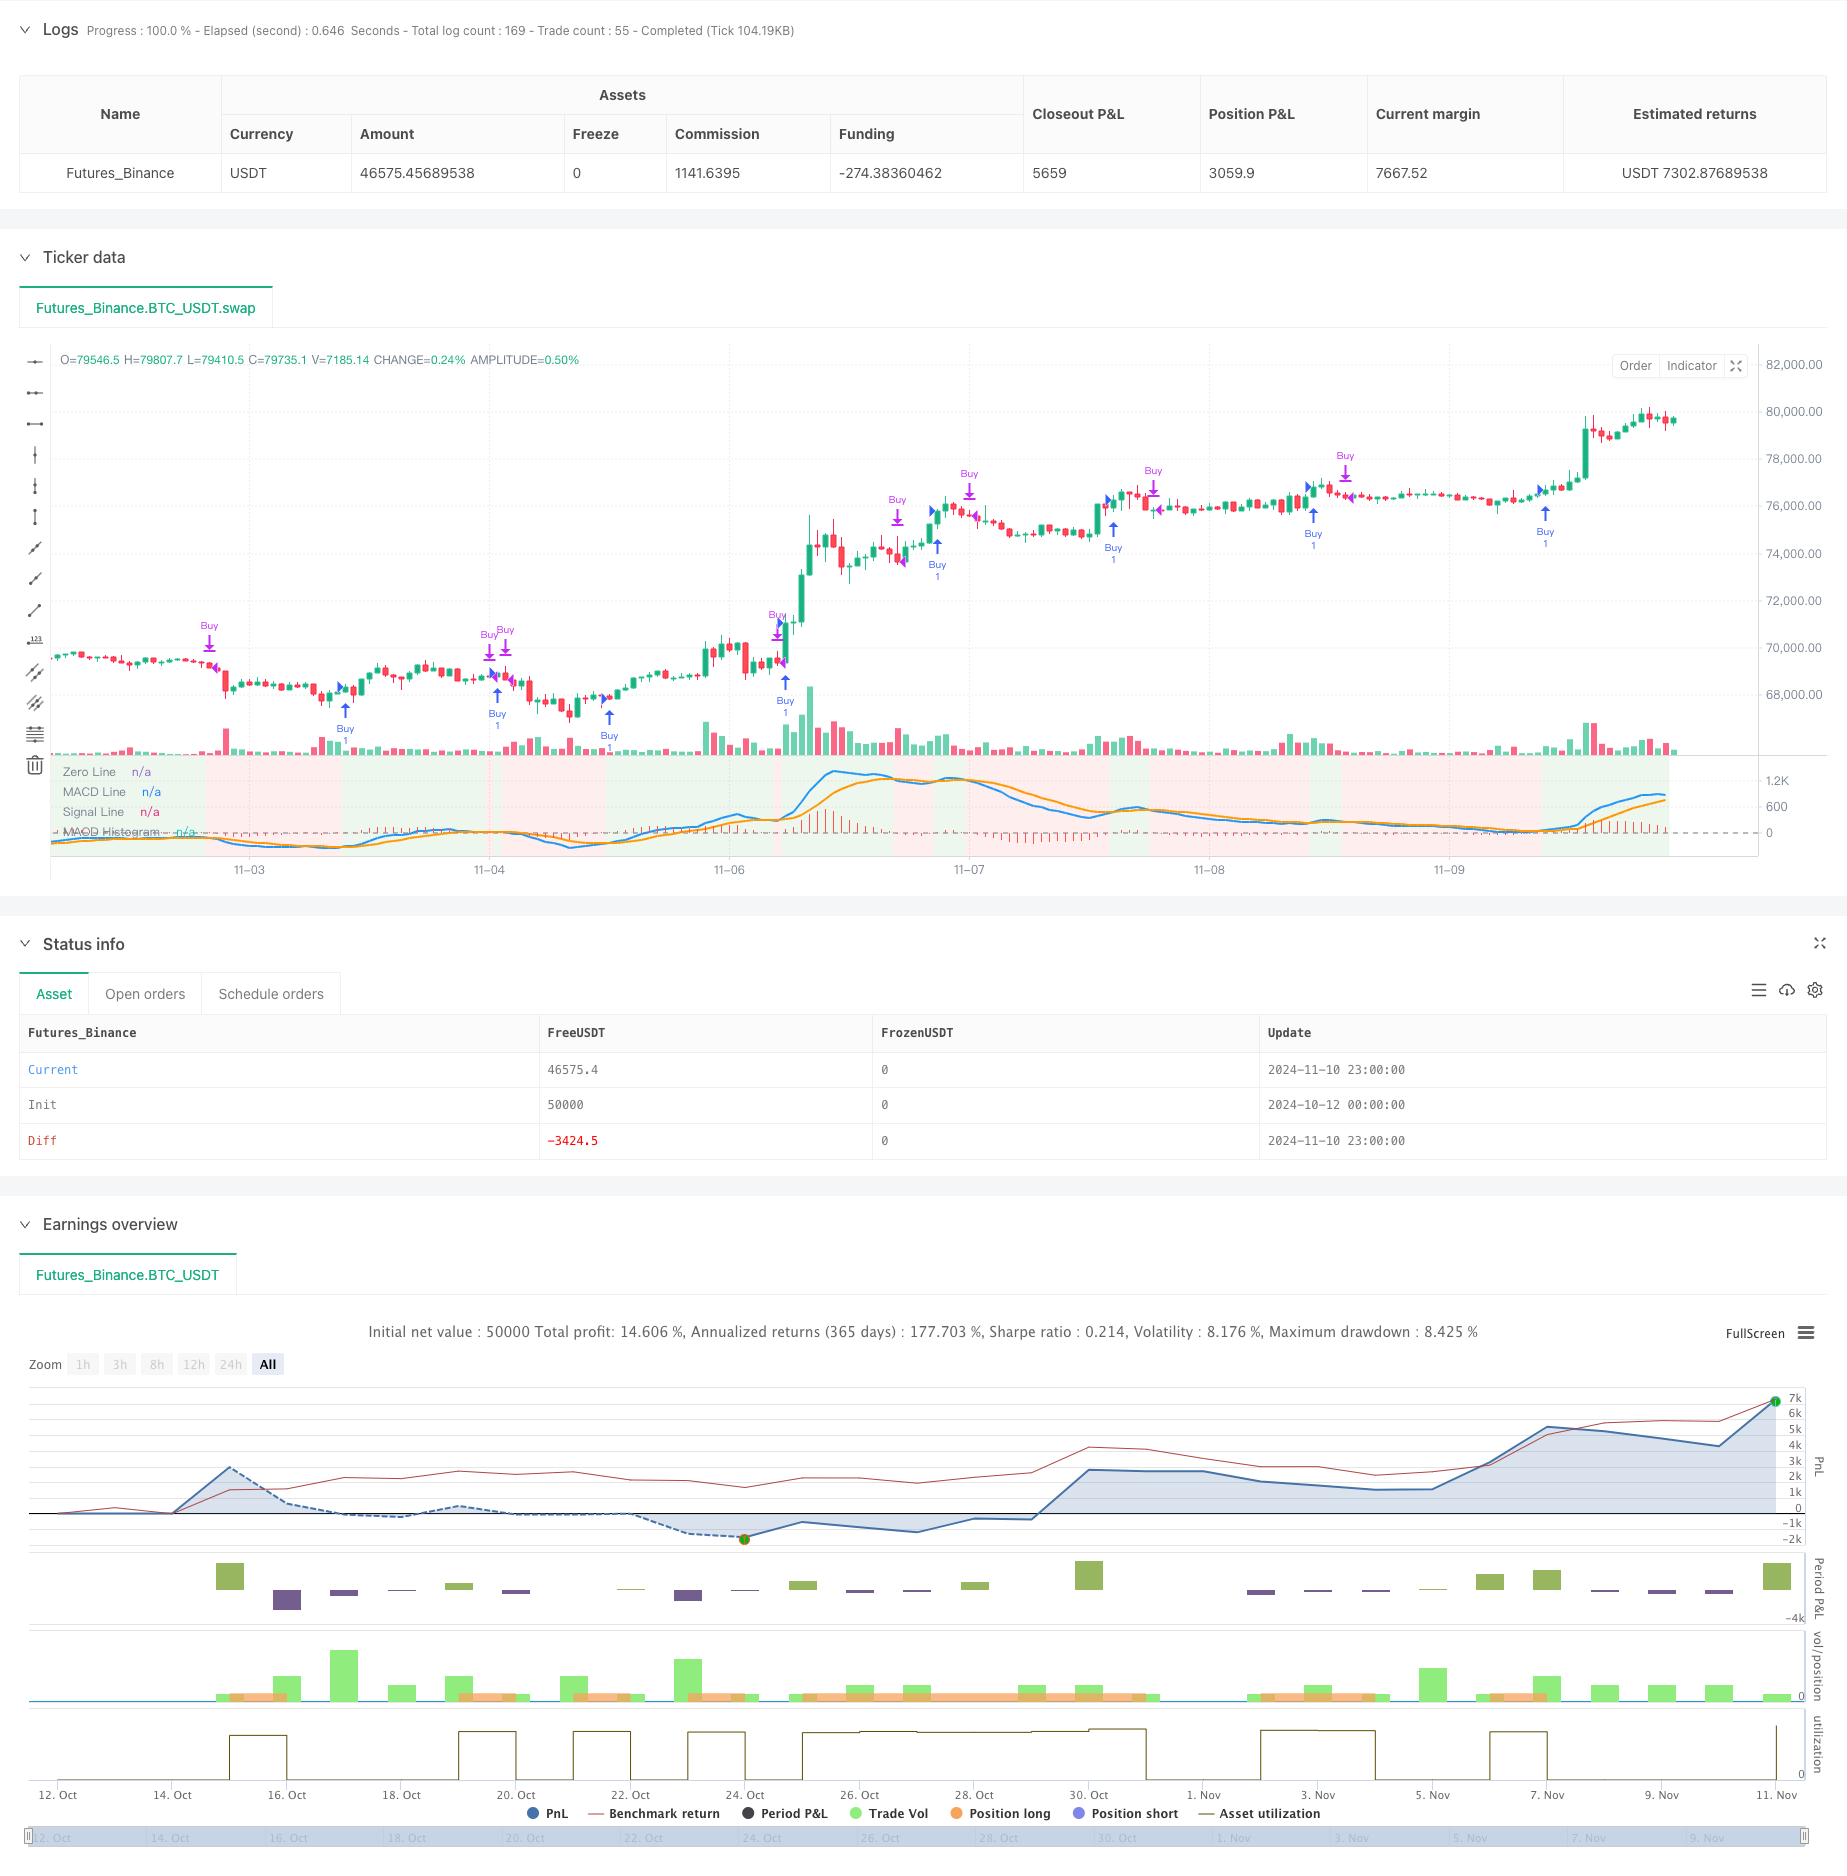
[trans]
概述
这个策略是一个基于MACD(移动平均线收敛发散指标)的高级量化交易系统,通过动态背景显示和多种预设参数组合来增强交易决策的准确性。该策略的核心在于通过MACD指标的交叉信号来捕捉市场趋势的转换点,并通过可视化的方式直观地展示市场的多空状态。
策略原理
策略采用了十种不同的MACD参数预设,包括标准设置(12,26,9)、短期(5,35,5)、长期(19,39,9)等,以适应不同的市场环境和交易风格。当MACD线与信号线发生黄金交叉时,系统生成买入信号;当发生死亡交叉时,系统生成卖出信号。策略通过动态背景颜色变化(绿色表示多头,红色表示空头)来增强视觉辨识度,帮助交易者更好地把握市场走势。
策略优势
- 参数灵活性强:提供十种预设参数组合,适应不同市场环境
- 视觉反馈清晰:通过背景颜色动态变化直观显示市场趋势
- 信号明确:基于MACD交叉产生明确的买卖信号
- 适应性强:可用于不同时间周期的交易
- 代码结构清晰:使用switch结构实现参数切换,便于维护和扩展
策略风险
- 滞后性风险:MACD作为滞后指标可能在剧烈波动市场中产生延迟信号
- 假突破风险:在横盘市场中可能产生虚假交叉信号
- 参数依赖性:不同参数组合在不同市场环境下表现差异较大
- 市场条件限制:在剧烈波动或流动性不足的市场环境下可能表现不佳
策略优化方向
- 引入波动率过滤器,过滤掉市场波动过大时期的交易信号
- 添加趋势确认指标,如RSI或ATR,提高信号可靠性
- 实现自适应参数优化,根据市场状况动态调整MACD参数
- 增加止损止盈功能,提高风险管理能力
- 添加交易量分析,提高信号的可靠性
总结
这是一个结构完善、逻辑清晰的MACD策略进阶版本。通过多参数预设和动态视觉反馈,大大提升了策略的实用性和可操作性。虽然存在一些固有的风险,但通过提供的优化方向进行改进后,该策略有望成为一个稳健的交易系统。建议交易者在实盘使用前进行充分的回测,并根据具体市场环境选择合适的参数设置。
||
Overview
This strategy is an advanced quantitative trading system based on the Moving Average Convergence Divergence (MACD) indicator, enhancing trading decisions through dynamic background display and multiple preset parameter combinations. The core of the strategy lies in capturing market trend transition points through MACD crossover signals and visually displaying market conditions.
Strategy Principle
The strategy employs ten different MACD parameter presets, including Standard (12,26,9), Short-term (5,35,5), Long-term (19,39,9), etc., to adapt to different market environments and trading styles. The system generates buy signals when the MACD line crosses above the signal line (golden cross) and sell signals when it crosses below (death cross). The strategy enhances visual recognition through dynamic background color changes (green for bullish, red for bearish) to help traders better grasp market trends.
Strategy Advantages
- Parameter Flexibility: Offers ten preset parameter combinations for different market environments
- Clear Visual Feedback: Dynamic background color changes provide intuitive market trend display
- Clear Signals: Generates explicit buy/sell signals based on MACD crossovers
- High Adaptability: Applicable to different timeframe trading
- Clear Code Structure: Uses switch structure for parameter switching, easy to maintain and extend
Strategy Risks
- Lag Risk: MACD as a lagging indicator may generate delayed signals in volatile markets
- False Breakout Risk: May generate false crossover signals in ranging markets
- Parameter Dependency: Different parameter combinations perform differently in various market conditions
- Market Condition Limitations: May underperform in highly volatile or illiquid market environments
Strategy Optimization Directions
- Implement volatility filters to filter out trading signals during highly volatile periods
- Add trend confirmation indicators like RSI or ATR to improve signal reliability
- Implement adaptive parameter optimization based on market conditions
- Add stop-loss and take-profit functionality to enhance risk management
- Include volume analysis to improve signal reliability
Summary
This is a well-structured, logically sound advanced version of the MACD strategy. Through multiple parameter presets and dynamic visual feedback, it significantly enhances the strategy's practicality and operability. While inherent risks exist, the strategy has the potential to become a robust trading system with the suggested optimizations. Traders are advised to conduct thorough backtesting before live implementation and choose appropriate parameter settings based on specific market conditions.[/trans]
Source (PineScript)
/*backtest
start: 2024-10-12 00:00:00
end: 2024-11-11 00:00:00
period: 1h
basePeriod: 1h
exchanges: [{"eid":"Futures_Binance","currency":"BTC_USDT"}]
*/

//@version=5
strategy("Hanzo - Top 10 MACD Strategy", overlay=false)  // MACD in a separate pane

// Define dropdown options for MACD settings
macdOption = input.string(title="Select MACD Setting",
     defval="Standard (12, 26, 9)",
     options=["Standard (12, 26, 9)",
              "Short-Term (5, 35, 5)",
              "Long-Term (19, 39, 9)",
              "Scalping (3, 10, 16)",
              "Cryptocurrency (20, 50, 9)",
              "Forex (8, 17, 9)",
              "Conservative (24, 52, 18)",
              "Trend-Following (7, 28, 7)",
              "Swing Trading (5, 15, 5)",
              "Contrarian (15, 35, 5)"])

// MACD setting based on user selection
var int fastLength = 12
var int slowLength = 26
var int signalLength = 9

switch macdOption
    "Standard (12, 26, 9)" =>
        fastLength := 12
        slowLength := 26
        signalLength := 9
    "Short-Term (5, 35, 5)" =>
        fastLength := 5
        slowLength := 35
        signalLength := 5
    "Long-Term (19, 39, 9)" =>
        fastLength := 19
        slowLength := 39
        signalLength := 9
    "Scalping (3, 10, 16)" =>
        fastLength := 3
        slowLength := 10
        signalLength := 16
    "Cryptocurrency (20, 50, 9)" =>
        fastLength := 20
        slowLength := 50
        signalLength := 9
    "Forex (8, 17, 9)" =>
        fastLength := 8
        slowLength := 17
        signalLength := 9
    "Conservative (24, 52, 18)" =>
        fastLength := 24
        slowLength := 52
        signalLength := 18
    "Trend-Following (7, 28, 7)" =>
        fastLength := 7
        slowLength := 28
        signalLength := 7
    "Swing Trading (5, 15, 5)" =>
        fastLength := 5
        slowLength := 15
        signalLength := 5
    "Contrarian (15, 35, 5)" =>
        fastLength := 15
        slowLength := 35
        signalLength := 5

// MACD Calculation
[macdLine, signalLine, _] = ta.macd(close, fastLength, slowLength, signalLength)
macdHist = macdLine - signalLine

// Buy and Sell conditions based on MACD crossovers
enterLong = ta.crossover(macdLine, signalLine)
exitLong = ta.crossunder(macdLine, signalLine)

// Execute buy and sell orders with price labels in the comments
if (enterLong)
    strategy.entry("Buy", strategy.long, comment="Buy at " + str.tostring(close, "#.##"))

if (exitLong)
    strategy.close("Buy", comment="Sell at " + str.tostring(close, "#.##"))

// Plot the signal price using plotchar for buy/sell prices
//plotchar(enterLong ? close : na, location=location.belowbar, color=color.green, size=size.small, title="Buy Price", offset=0)
//plotchar(exitLong ? close : na, location=location.abovebar, color=color.red, size=size.small, title="Sell Price", offset=0)

// Background highlighting based on bullish or bearish MACD
isBullish = macdLine > signalLine
isBearish = macdLine < signalLine

// Change background to green for bullish periods and red for bearish periods
bgcolor(isBullish ? color.new(color.green, 90) : na, title="Bullish Background")
bgcolor(isBearish ? color.new(color.red, 90) : na, title="Bearish Background")

// Plot the MACD and Signal line in a separate pane
plot(macdLine, title="MACD Line", color=color.blue, linewidth=2)
plot(signalLine, title="Signal Line", color=color.orange, linewidth=2)
hline(0, "Zero Line", color=color.gray)
plot(macdHist, title="MACD Histogram", style=plot.style_histogram, color=color.red)
Detail
https://www.fmz.com/strategy/471715
Last Modified
2024-11-12 16:27:01