
145 lines
7.0 KiB
Markdown
145 lines
7.0 KiB
Markdown
|
|
> Name
|
|
|
|
MACD交叉策略与动量趋势智能交易系统-MACD-Crossover-and-Momentum-Trend-Intelligent-Trading-System
|
|
|
|
> Author
|
|
|
|
ChaoZhang
|
|
|
|
> Strategy Description
|
|
|
|
|
|
[trans]
|
|
#### 概述
|
|
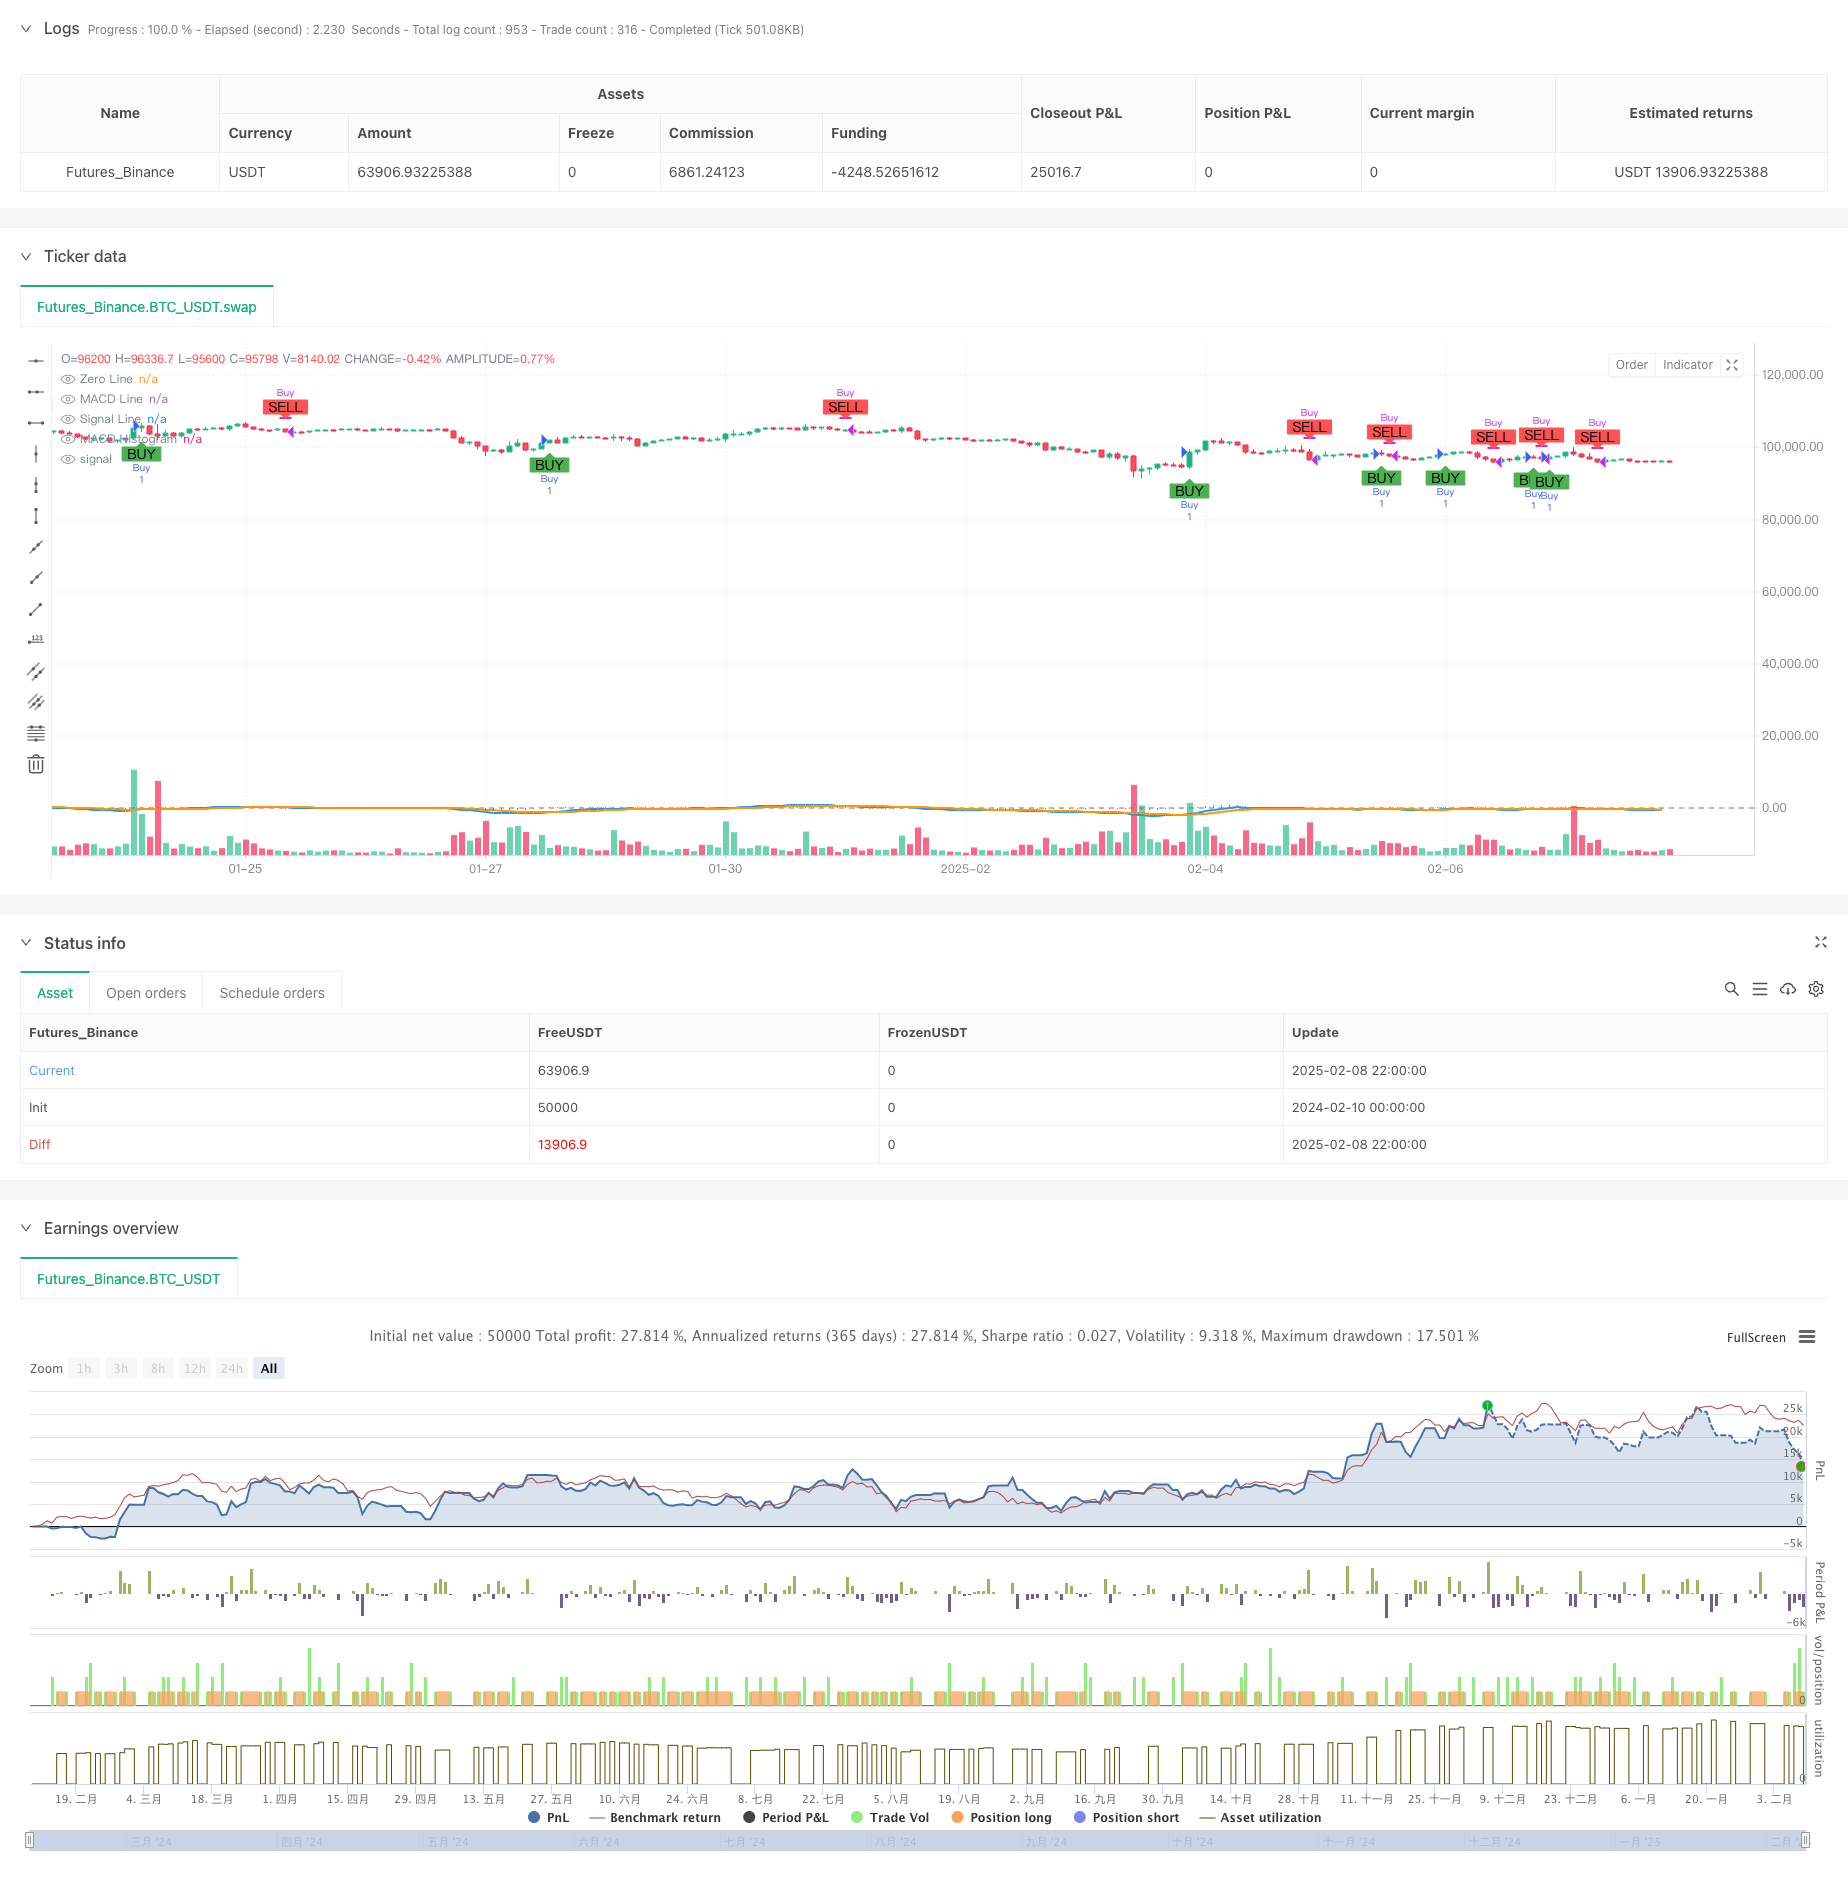
该策略是一个基于MACD(移动平均线收敛发散指标)交叉信号的智能交易系统。它通过分析MACD线与信号线的交叉情况来生成买卖信号,并在图表上进行可视化展示。该系统集成了实时提醒功能,能够及时通知交易者潜在的交易机会。
|
|
|
|
#### 策略原理
|
|
策略的核心是利用MACD指标来捕捉市场动量变化。具体实现包括以下几个关键步骤:
|
|
1. 通过快速EMA(12周期)和慢速EMA(26周期)计算MACD线
|
|
2. 使用9周期EMA作为信号线
|
|
3. 当MACD线向上穿越信号线时,触发买入信号
|
|
4. 当MACD线向下穿越信号线时,触发卖出信号
|
|
系统会在图表上直观显示MACD直方图、交叉信号标记,并在关键时刻发出交易提醒。
|
|
|
|
#### 策略优势
|
|
1. 视觉直观:在价格图表上直接展示买卖信号,便于交易者快速判断
|
|
2. 信号明确:基于明确的交叉规则生成交易信号,减少主观判断
|
|
3. 实时提醒:集成提醒系统,确保不错过重要交易机会
|
|
4. 参数可调:允许调整快慢线周期,适应不同市场环境
|
|
5. 系统化交易:自动执行入场和出场操作,降低情绪干扰
|
|
|
|
#### 策略风险
|
|
1. 滞后性风险:MACD为滞后指标,在剧烈波动市场可能产生滞后信号
|
|
2. 震荡市风险:在横盘震荡市场容易产生虚假信号
|
|
3. 资金管理风险:未设置止损机制,在极端行情下可能造成较大损失
|
|
4. 参数依赖:不同市场环境可能需要不同参数设置
|
|
|
|
#### 策略优化方向
|
|
1. 增加止损机制:建议添加固定止损或移动止损功能
|
|
2. 引入趋势过滤:结合其他趋势指标,过滤横盘市场的信号
|
|
3. 优化参数自适应:开发自动优化参数的功能,适应市场变化
|
|
4. 增加仓位管理:根据信号强度动态调整仓位大小
|
|
5. 添加回撤控制:设置最大回撤限制,提高风险控制能力
|
|
|
|
#### 总结
|
|
这是一个结构完整、逻辑清晰的MACD交叉策略系统。通过可视化展示和自动化执行,为交易者提供了一个客观的交易工具。虽然存在一定的滞后性风险,但通过建议的优化方向,可以进一步提升策略的稳定性和可靠性。该策略特别适合趋势明显的市场环境,对于想要实现系统化交易的投资者来说是一个很好的选择。||
|
|
|
|
#### Overview
|
|
This strategy is an intelligent trading system based on MACD (Moving Average Convergence Divergence) crossover signals. It generates buy and sell signals by analyzing the crossovers between the MACD line and signal line, with visual representation on the chart. The system integrates real-time alerts to notify traders of potential trading opportunities.
|
|
|
|
#### Strategy Principles
|
|
The strategy's core utilizes the MACD indicator to capture market momentum changes. The implementation includes these key steps:
|
|
1. Calculate MACD line using fast EMA (12 periods) and slow EMA (26 periods)
|
|
2. Use 9-period EMA as signal line
|
|
3. Generate buy signal when MACD line crosses above signal line
|
|
4. Generate sell signal when MACD line crosses below signal line
|
|
The system visually displays MACD histogram, crossover signals on the chart, and sends trading alerts at crucial moments.
|
|
|
|
#### Strategy Advantages
|
|
1. Visual Clarity: Displays buy/sell signals directly on price chart for quick decision making
|
|
2. Clear Signals: Generates trading signals based on definitive crossover rules, reducing subjective judgment
|
|
3. Real-time Alerts: Integrated alert system ensures no important trading opportunities are missed
|
|
4. Adjustable Parameters: Allows adjustment of fast and slow line periods to adapt to different market conditions
|
|
5. Systematic Trading: Automatic execution of entry and exit operations, reducing emotional interference
|
|
|
|
#### Strategy Risks
|
|
1. Lag Risk: MACD is a lagging indicator, may generate delayed signals in volatile markets
|
|
2. Consolidation Risk: Prone to false signals in ranging markets
|
|
3. Money Management Risk: Lack of stop-loss mechanism may lead to significant losses in extreme conditions
|
|
4. Parameter Dependency: Different market environments may require different parameter settings
|
|
|
|
#### Strategy Optimization Directions
|
|
1. Add Stop-loss Mechanism: Implement fixed or trailing stop-loss functionality
|
|
2. Introduce Trend Filters: Combine with other trend indicators to filter signals in ranging markets
|
|
3. Optimize Parameter Adaptation: Develop automatic parameter optimization to adapt to market changes
|
|
4. Enhance Position Management: Dynamically adjust position size based on signal strength
|
|
5. Add Drawdown Control: Set maximum drawdown limits to improve risk control
|
|
|
|
#### Summary
|
|
This is a well-structured MACD crossover strategy system with clear logic. Through visual display and automated execution, it provides traders with an objective trading tool. While there are certain lag risks, the suggested optimization directions can further enhance the strategy's stability and reliability. The strategy is particularly suitable for trending markets and is an excellent choice for investors looking to implement systematic trading.[/trans]
|
|
|
|
|
|
|
|
> Source (PineScript)
|
|
|
|
``` pinescript
|
|
/*backtest
|
|
start: 2024-02-10 00:00:00
|
|
end: 2025-02-09 00:00:00
|
|
period: 2h
|
|
basePeriod: 2h
|
|
exchanges: [{"eid":"Futures_Binance","currency":"BTC_USDT"}]
|
|
*/
|
|
|
|
//@version=6
|
|
strategy("ETH/USD MACD Crossover", overlay=true)
|
|
|
|
// MACD settings
|
|
fastLength = input(12, title="Fast EMA Length")
|
|
slowLength = input(26, title="Slow EMA Length")
|
|
signalLength = input(9, title="Signal Line Length")
|
|
|
|
// MACD calculation
|
|
[macdLine, signalLine, _] = ta.macd(close, fastLength, slowLength, signalLength)
|
|
|
|
// Plot MACD and Signal Line
|
|
plot(macdLine, color=color.blue, title="MACD Line", linewidth=2)
|
|
plot(signalLine, color=color.orange, title="Signal Line", linewidth=2)
|
|
hline(0, "Zero Line", color=color.gray)
|
|
|
|
// MACD Histogram
|
|
macdHistogram = macdLine - signalLine
|
|
plot(macdHistogram, color=macdHistogram >= 0 ? color.green : color.red, style=plot.style_histogram, title="MACD Histogram")
|
|
|
|
// Buy and Sell Conditions
|
|
buyCondition = ta.crossover(macdLine, signalLine) // MACD crosses above Signal Line
|
|
sellCondition = ta.crossunder(macdLine, signalLine) // MACD crosses below Signal Line
|
|
|
|
// Plot buy/sell signals on the chart
|
|
plotshape(series=buyCondition, title="Buy Signal", location=location.belowbar, color=color.green, style=shape.labelup, text="BUY")
|
|
plotshape(series=sellCondition, title="Sell Signal", location=location.abovebar, color=color.red, style=shape.labeldown, text="SELL")
|
|
|
|
// Alerts for buy/sell conditions
|
|
if (buyCondition)
|
|
alert("MACD Crossover: BUY signal for ETH/USD", alert.freq_once_per_bar)
|
|
|
|
if (sellCondition)
|
|
alert("MACD Crossover: SELL signal for ETH/USD", alert.freq_once_per_bar)
|
|
|
|
// Strategy entry/exit
|
|
if (buyCondition)
|
|
strategy.entry("Buy", strategy.long)
|
|
if (sellCondition)
|
|
strategy.close("Buy")
|
|
|
|
```
|
|
|
|
> Detail
|
|
|
|
https://www.fmz.com/strategy/481354
|
|
|
|
> Last Modified
|
|
|
|
2025-02-10 14:44:43
|