
219 lines
9.8 KiB
Markdown
219 lines
9.8 KiB
Markdown
|
|
> Name
|
|
|
|
MACD交叉动量策略与动态止盈止损优化-MACD-Crossover-Momentum-Strategy-with-Dynamic-Take-Profit-and-Stop-Loss-Optimization
|
|
|
|
> Author
|
|
|
|
ChaoZhang
|
|
|
|
> Strategy Description
|
|
|
|
|
|
|
|
[trans]
|
|
#### 概述
|
|
|
|
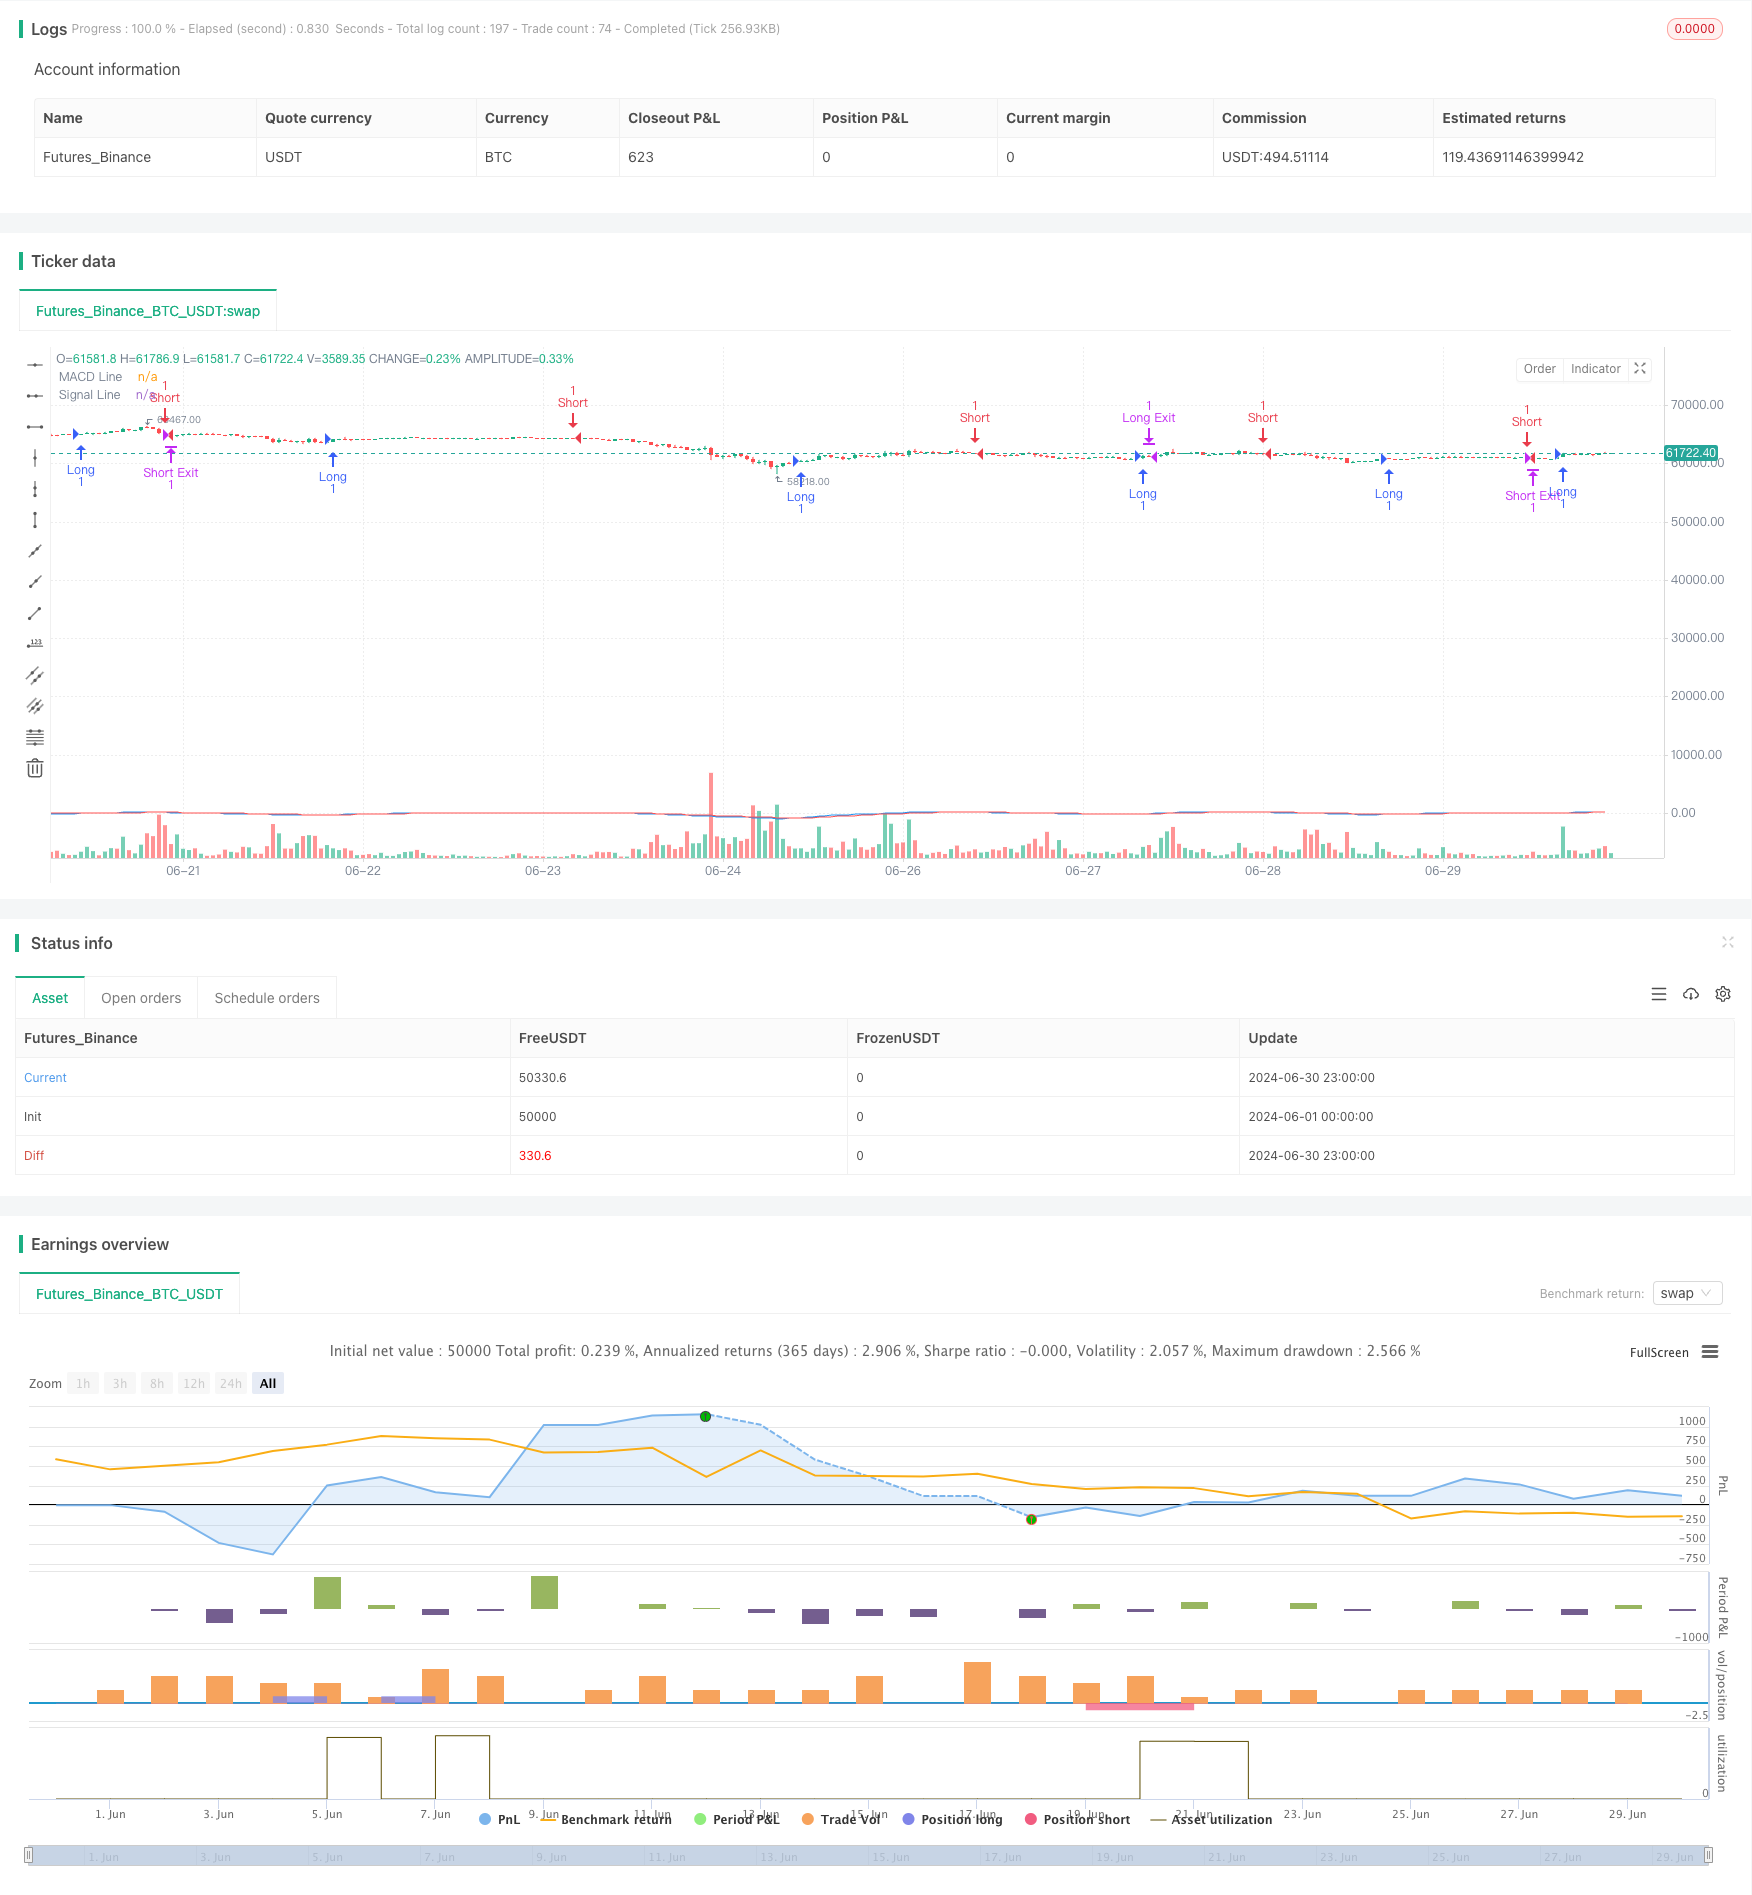
MACD交叉动量策略与动态止盈止损优化是一种结合了移动平均线收敛散度(MACD)指标和灵活的风险管理机制的量化交易策略。该策略利用MACD指标的交叉信号来识别潜在的趋势变化,并通过设置动态的止盈和止损点来优化交易的风险收益比。这种方法旨在捕捉市场动量,同时为每笔交易提供明确的退出策略。
|
|
|
|
#### 策略原理
|
|
|
|
该策略的核心原理基于MACD指标的信号线交叉:
|
|
|
|
1. MACD计算:
|
|
- 使用12周期快速指数移动平均线(EMA)和26周期慢速EMA
|
|
- MACD线 = 快速EMA - 慢速EMA
|
|
- 信号线 = MACD线的9周期EMA
|
|
|
|
2. 入场信号:
|
|
- 多头入场: MACD线上穿信号线
|
|
- 空头入场: MACD线下穿信号线
|
|
|
|
3. 出场策略:
|
|
- 设置固定点数的止盈和止损
|
|
- 多头交易: 止盈 = 入场价 + 100点; 止损 = 入场价 - 50点
|
|
- 空头交易: 止盈 = 入场价 - 100点; 止损 = 入场价 + 50点
|
|
|
|
策略使用ta.macd()函数计算MACD指标,ta.crossover()和ta.crossunder()函数检测交叉信号。交易执行通过strategy.entry()和strategy.exit()函数完成。
|
|
|
|
#### 策略优势
|
|
|
|
1. 趋势跟踪: MACD指标有助于识别和跟踪市场趋势,提高捕捉大趋势的概率。
|
|
|
|
2. 动量捕捉: 通过MACD交叉信号,策略能够及时进入新兴的市场动量。
|
|
|
|
3. 风险管理: 预设的止盈止损点为每笔交易提供清晰的风险控制。
|
|
|
|
4. 灵活性: 策略参数可以根据不同市场和时间框架进行调整。
|
|
|
|
5. 自动化: 策略可以在交易平台上自动执行,减少人为情绪干扰。
|
|
|
|
6. 客观性: 基于技术指标的信号eliminates主观判断,提高交易一致性。
|
|
|
|
#### 策略风险
|
|
|
|
1. 假突破: 在横盘市场中,MACD可能产生频繁的假突破信号,导致过度交易。
|
|
|
|
2. 滞后性: MACD作为滞后指标,可能在快速反转行情中反应不及时。
|
|
|
|
3. 固定止损: 使用固定点数作为止损可能不适合所有市场条件,特别是在波动性变化时。
|
|
|
|
4. 参数敏感性: 策略性能高度依赖于所选择的EMA和信号线参数。
|
|
|
|
5. 市场适应性: 策略可能在某些市场环境下表现良好,但在其他情况下效果不佳。
|
|
|
|
6. 过度优化: 在回测过程中可能出现过度拟合历史数据的风险。
|
|
|
|
#### 策略优化方向
|
|
|
|
1. 动态止损: 使用ATR(平均真实波幅)指标调整止损点,以适应当前市场波动性。
|
|
|
|
2. 多时间框架分析: 结合更长期的趋势判断,提高入场信号的可靠性。
|
|
|
|
3. 过滤器: 添加额外的技术指标或价格行为模式作为过滤器,减少假信号。
|
|
|
|
4. 仓位管理: 实现动态仓位sizing,根据市场波动性和账户风险调整交易规模。
|
|
|
|
5. 市场状态识别: 开发算法识别趋势/震荡市场,在不同市场状态下调整策略参数。
|
|
|
|
6. 机器学习优化: 使用机器学习算法动态优化MACD参数,提高策略适应性。
|
|
|
|
#### 总结
|
|
|
|
MACD交叉动量策略与动态止盈止损优化是一种结合技术分析和风险管理的量化交易方法。通过利用MACD指标的趋势跟踪和动量捕捉能力,同时实施明确的止盈止损规则,该策略旨在在控制风险的同时捕捉市场机会。然而,像所有交易策略一样,它并非完美无缺。交易者需要注意假突破、滞后性和市场适应性等潜在风险。通过引入动态止损、多时间框架分析和市场状态识别等优化措施,策略的稳健性和适应性有望得到进一步提升。总的来说,这是一个值得深入研究和持续优化的策略框架,为量化交易者提供了一个良好的起点。
|
|
|
|
||
|
|
|
|
#### Overview
|
|
|
|
The MACD Crossover Momentum Strategy with Dynamic Take Profit and Stop Loss Optimization is a quantitative trading approach that combines the Moving Average Convergence Divergence (MACD) indicator with a flexible risk management mechanism. This strategy utilizes MACD crossover signals to identify potential trend changes while implementing dynamic take profit and stop loss points to optimize the risk-reward ratio of trades. The approach aims to capture market momentum while providing clear exit strategies for each trade.
|
|
|
|
#### Strategy Principles
|
|
|
|
The core principle of this strategy is based on MACD signal line crossovers:
|
|
|
|
1. MACD Calculation:
|
|
- Uses a 12-period fast Exponential Moving Average (EMA) and a 26-period slow EMA
|
|
- MACD Line = Fast EMA - Slow EMA
|
|
- Signal Line = 9-period EMA of the MACD Line
|
|
|
|
2. Entry Signals:
|
|
- Long Entry: MACD Line crosses above the Signal Line
|
|
- Short Entry: MACD Line crosses below the Signal Line
|
|
|
|
3. Exit Strategy:
|
|
- Sets fixed point take profit and stop loss levels
|
|
- For Long Trades: Take Profit = Entry Price + 100 points; Stop Loss = Entry Price - 50 points
|
|
- For Short Trades: Take Profit = Entry Price - 100 points; Stop Loss = Entry Price + 50 points
|
|
|
|
The strategy uses the ta.macd() function to calculate the MACD indicator, and ta.crossover() and ta.crossunder() functions to detect crossover signals. Trade execution is handled through strategy.entry() and strategy.exit() functions.
|
|
|
|
#### Strategy Advantages
|
|
|
|
1. Trend Following: The MACD indicator helps identify and follow market trends, increasing the probability of capturing major moves.
|
|
|
|
2. Momentum Capture: Through MACD crossover signals, the strategy can promptly enter emerging market momentum.
|
|
|
|
3. Risk Management: Preset take profit and stop loss points provide clear risk control for each trade.
|
|
|
|
4. Flexibility: Strategy parameters can be adjusted for different markets and timeframes.
|
|
|
|
5. Automation: The strategy can be executed automatically on trading platforms, reducing emotional interference.
|
|
|
|
6. Objectivity: Signal generation based on technical indicators eliminates subjective judgment, improving trading consistency.
|
|
|
|
#### Strategy Risks
|
|
|
|
1. False Breakouts: In ranging markets, MACD may produce frequent false breakout signals, leading to overtrading.
|
|
|
|
2. Lag: As a lagging indicator, MACD may react too slowly in fast-reversing markets.
|
|
|
|
3. Fixed Stop Loss: Using fixed point values for stop losses may not be suitable for all market conditions, especially when volatility changes.
|
|
|
|
4. Parameter Sensitivity: Strategy performance is highly dependent on the chosen EMA and signal line parameters.
|
|
|
|
5. Market Adaptability: The strategy may perform well in certain market environments but poorly in others.
|
|
|
|
6. Over-optimization: There's a risk of overfitting to historical data during backtesting.
|
|
|
|
#### Strategy Optimization Directions
|
|
|
|
1. Dynamic Stop Loss: Implement ATR (Average True Range) to adjust stop loss points, adapting to current market volatility.
|
|
|
|
2. Multi-Timeframe Analysis: Incorporate longer-term trend analysis to improve the reliability of entry signals.
|
|
|
|
3. Filters: Add additional technical indicators or price action patterns as filters to reduce false signals.
|
|
|
|
4. Position Sizing: Implement dynamic position sizing, adjusting trade size based on market volatility and account risk.
|
|
|
|
5. Market State Recognition: Develop algorithms to identify trending/ranging markets and adjust strategy parameters accordingly.
|
|
|
|
6. Machine Learning Optimization: Use machine learning algorithms to dynamically optimize MACD parameters, improving strategy adaptability.
|
|
|
|
#### Conclusion
|
|
|
|
The MACD Crossover Momentum Strategy with Dynamic Take Profit and Stop Loss Optimization is a quantitative trading approach that combines technical analysis with risk management. By leveraging the trend-following and momentum-capturing capabilities of the MACD indicator while implementing clear take profit and stop loss rules, the strategy aims to capture market opportunities while controlling risk. However, like all trading strategies, it is not without flaws. Traders need to be aware of potential risks such as false breakouts, lag, and market adaptability. By introducing optimizations like dynamic stop losses, multi-timeframe analysis, and market state recognition, the strategy's robustness and adaptability can be further enhanced. Overall, this strategy framework provides a solid starting point for quantitative traders, worthy of in-depth research and continuous optimization.
|
|
|
|
[/trans]
|
|
|
|
|
|
|
|
> Source (PineScript)
|
|
|
|
``` pinescript
|
|
/*backtest
|
|
start: 2024-06-01 00:00:00
|
|
end: 2024-06-30 23:59:59
|
|
period: 1h
|
|
basePeriod: 15m
|
|
exchanges: [{"eid":"Futures_Binance","currency":"BTC_USDT"}]
|
|
*/
|
|
|
|
//@version=5
|
|
strategy("MACD Strategy", overlay=true)
|
|
|
|
// Input parameters
|
|
fast_length = input.int(12, title="Fast EMA Length")
|
|
slow_length = input.int(26, title="Slow EMA Length")
|
|
signal_length = input.int(9, title="Signal Line Length")
|
|
|
|
target_points = input.int(100, title="Target Points")
|
|
stop_loss_points = input.int(50, title="Stop Loss Points")
|
|
|
|
// Calculate MACD
|
|
[macd_line, signal_line, _] = ta.macd(close, fast_length, slow_length, signal_length)
|
|
|
|
// Strategy logic
|
|
long_condition = ta.crossover(macd_line, signal_line)
|
|
short_condition = ta.crossunder(macd_line, signal_line)
|
|
|
|
// Plot MACD
|
|
plot(macd_line, color=color.blue, title="MACD Line")
|
|
plot(signal_line, color=color.red, title="Signal Line")
|
|
|
|
// Strategy entry and exit
|
|
if long_condition
|
|
strategy.entry("Long", strategy.long)
|
|
if short_condition
|
|
strategy.entry("Short", strategy.short)
|
|
|
|
// Calculate target and stop loss levels
|
|
long_target = strategy.position_avg_price + target_points
|
|
long_stop_loss = strategy.position_avg_price - stop_loss_points
|
|
short_target = strategy.position_avg_price - target_points
|
|
short_stop_loss = strategy.position_avg_price + stop_loss_points
|
|
|
|
// Strategy exit
|
|
strategy.exit("Long Exit", "Long", limit=long_target, stop=long_stop_loss)
|
|
strategy.exit("Short Exit", "Short", limit=short_target, stop=short_stop_loss)
|
|
|
|
```
|
|
|
|
> Detail
|
|
|
|
https://www.fmz.com/strategy/458027
|
|
|
|
> Last Modified
|
|
|
|
2024-07-29 13:35:02
|