
208 lines
16 KiB
Markdown
208 lines
16 KiB
Markdown
|
|
> Name
|
|
|
|
MACD与RSI结合的长线交易策略-MACD-and-RSI-Combined-Long-term-Trading-Strategy
|
|
|
|
> Author
|
|
|
|
ChaoZhang
|
|
|
|
> Strategy Description
|
|
|
|
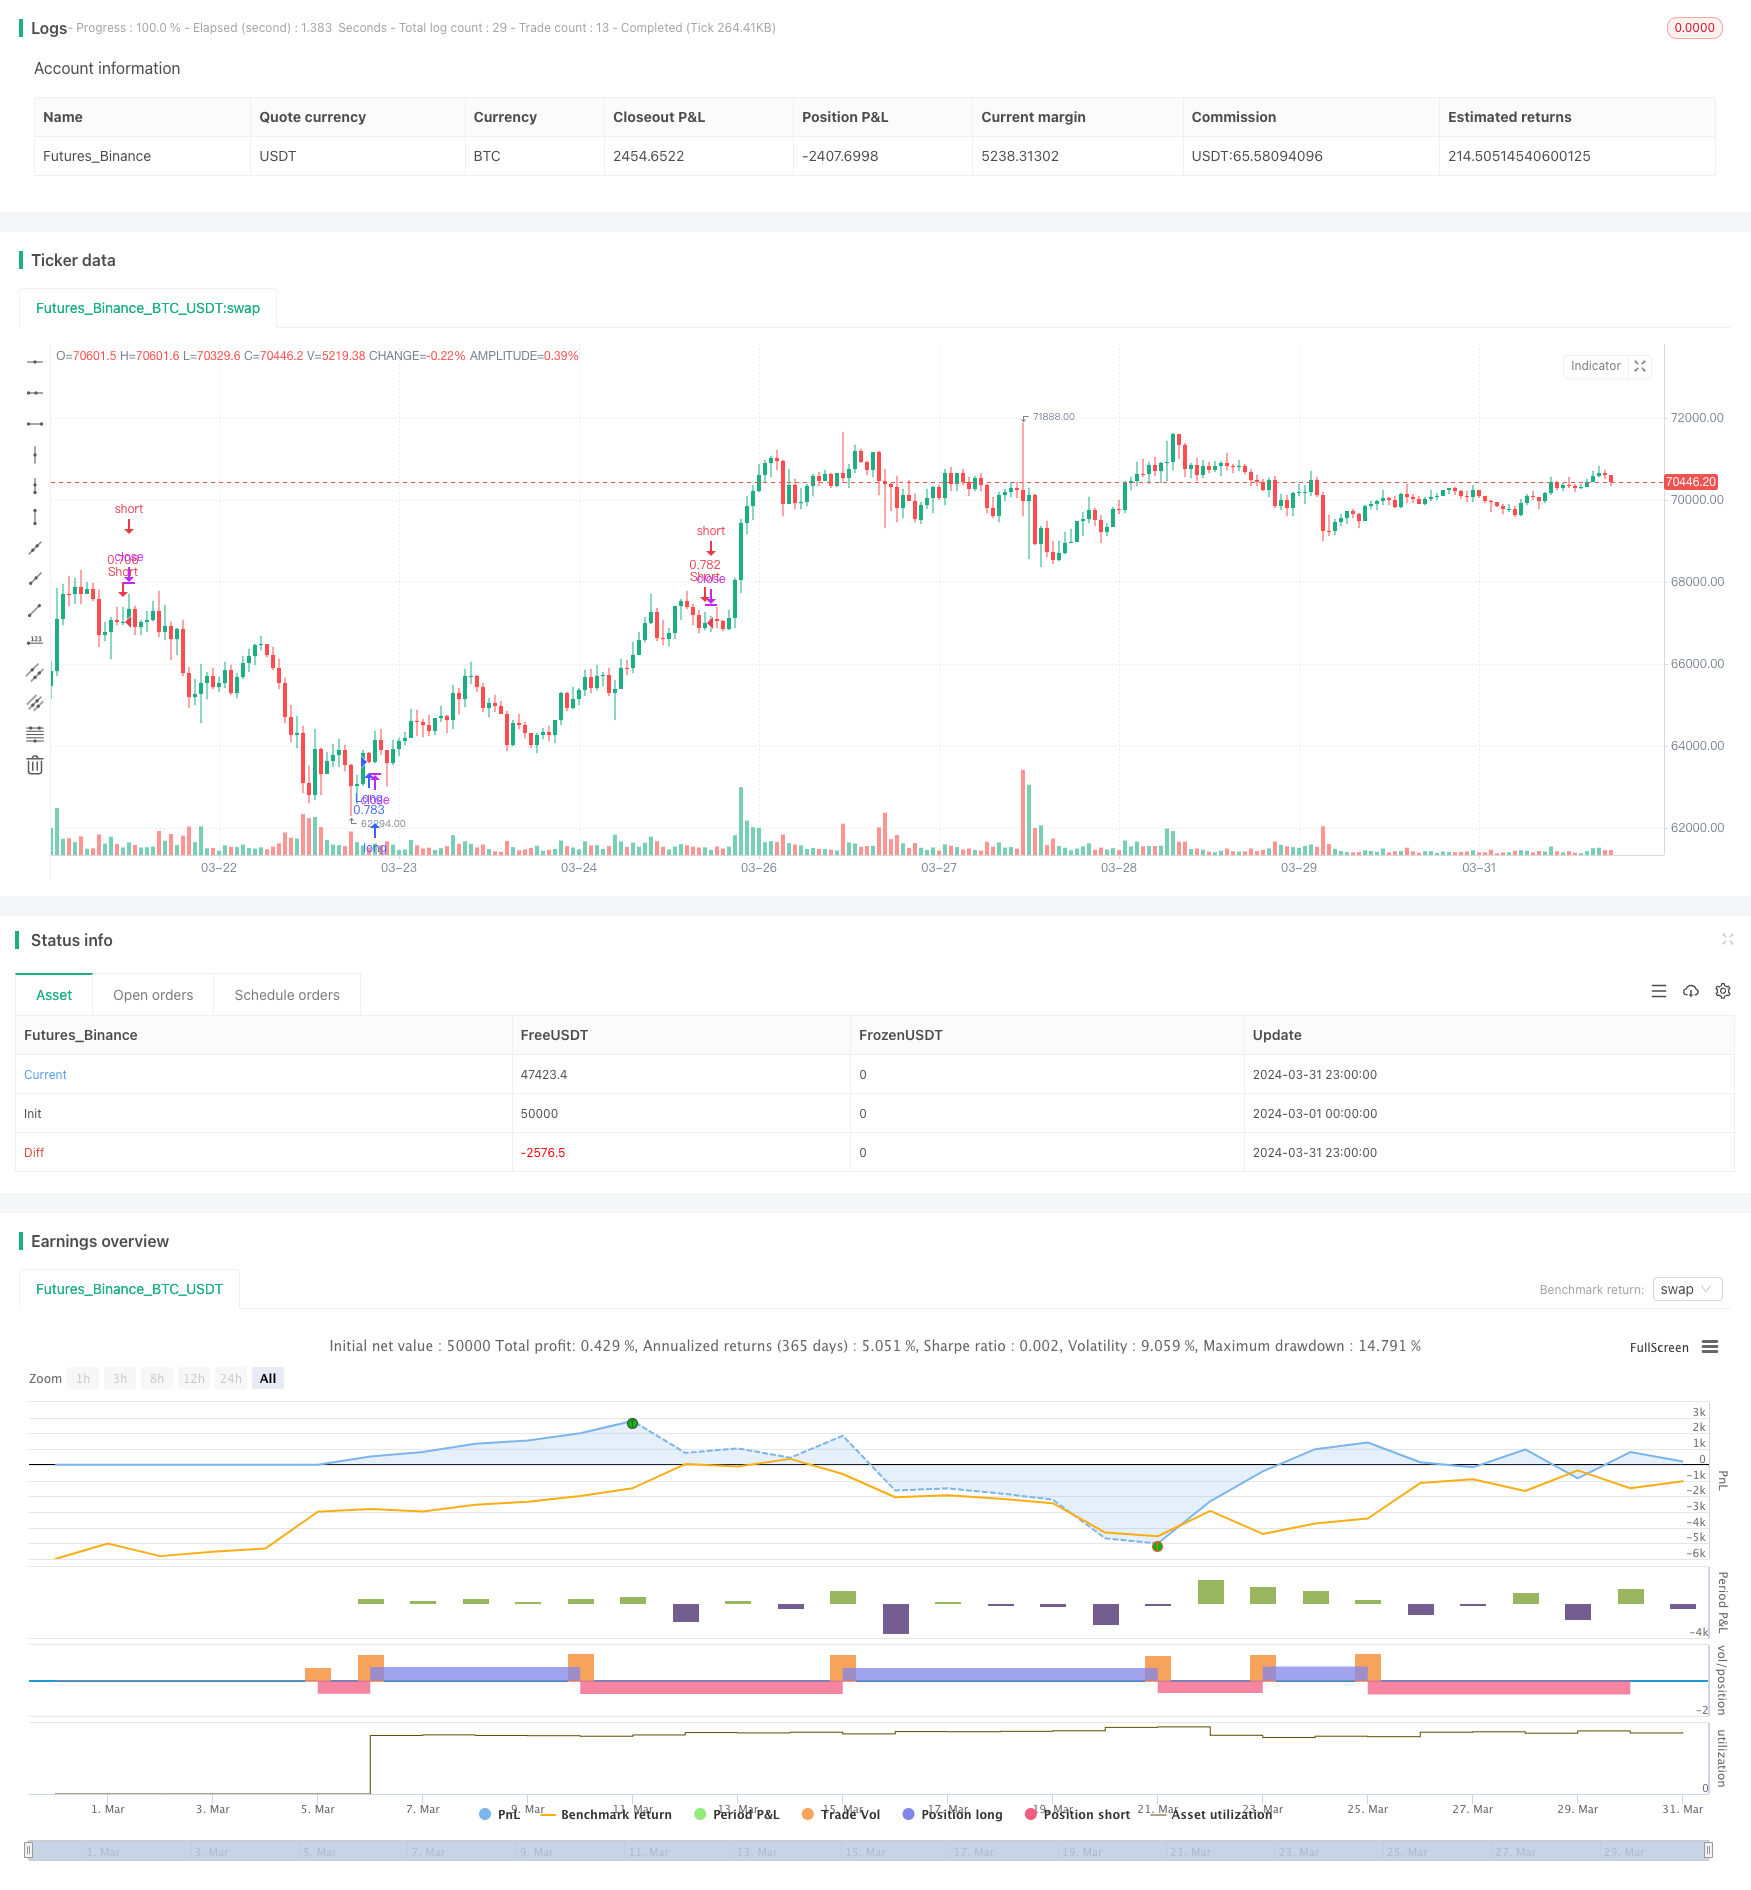
|
|
|
|
[trans]
|
|
#### 概述
|
|
该策略由脚本专家Snehashish精心设计,创新地结合了移动平均线聚散指标(MACD)和相对强弱指数(RSI)的优势,以识别市场中最佳的进场和出场点。该方法精心设计,在MACD线穿过信号线之上时精确进入多头交易,前提是RSI在5根K线前表明市场处于超卖状态。这种时机确保了该策略在抛售后市场初步复苏的信号出现时,利用MACD的交叉来进场。
|
|
|
|
对于平仓,该策略采用两个关键条件来发出退出信号。首先,当MACD直方图高于零,且MACD线穿过信号线之下时,交易结束,表明上升势头可能逆转。其次,如果发现RSI在5根K线之前处于超买状态,也会产生退出信号,表明市场可能已经达到顶部,可能出现下跌。
|
|
|
|
Snehashish的方法巧妙地结合了这些技术指标,通过在特定条件下等待MACD和RSI指标的确认,过滤掉噪音,瞄准成功概率更高的交易。这种战略组合旨在优化进场和出场点,通过利用指标的优势来降低与市场波动相关的风险,从而提高交易的盈利能力。
|
|
|
|
#### 策略原理
|
|
该策略的核心原理是结合MACD和RSI两个技术指标,以更高的精度捕捉市场的转折点。当RSI显示市场在最近几根K线处于超卖状态,而MACD线随后向上穿过信号线时,策略就会进入多头交易。这种组合确保了策略在价格走势初现反转迹象时就开仓。
|
|
|
|
对于平仓,策略则关注MACD和RSI显示的潜在趋势反转信号。如果MACD直方图高于零,且MACD线向下穿过信号线,策略就会平仓。此外,如果RSI此前显示市场达到超买水平,也会触发平仓。这些条件综合起来意味着,当价格可能见顶、上行动能减弱时,策略就会了结多头头寸。
|
|
|
|
总的来说,通过结合MACD和RSI提供的信号,该策略力求在趋势初现反转迹象时开仓,并在趋势可能结束时平仓,从而优化进场和出场点,提高整体交易表现。
|
|
|
|
#### 策略优势
|
|
1. 通过结合MACD和RSI两个指标,该策略能更准确地捕捉市场转折点,进而优化进场和出场时机。
|
|
2. RSI用于确认市场的超卖和超买状态,而MACD线穿过信号线则提供了开仓信号,两个指标的结合可以更可靠地预测价格走势。
|
|
3. 在开仓前等待RSI确认超卖状态,可以避免在下跌趋势中过早进场。
|
|
4. MACD直方图高于零,且MACD线向下穿过信号线时平仓,可以在上行趋势末期及时了结多头头寸,避免潜在的回撤风险。
|
|
5. 灵活的参数设置,如RSI的超卖和超买阈值、MACD的快慢线周期等,可以让用户根据自己的风险偏好和市场特点,对策略进行优化。
|
|
|
|
#### 策略风险
|
|
1. 在震荡市中,频繁的MACD和RSI信号可能导致过度交易,增加交易成本和潜在损失。
|
|
2. 如果市场趋势强劲,RSI可能长期停留在超买区,使策略错失部分上涨行情。
|
|
3. 该策略主要依赖于滞后性指标,在市场突然反转时,可能无法及时调整仓位。
|
|
4. 参数设置对策略表现影响很大,不当的参数可能导致大量虚假信号,降低策略效率。
|
|
|
|
为了缓解这些风险,可以考虑引入其他领先性指标作为过滤条件,优化参数以适应不同市场状况,并设置适当的止损和止盈以控制单笔交易风险。
|
|
|
|
#### 策略优化方向
|
|
1. 引入其他技术指标,如布林带、均线等,以提供额外的趋势确认和支撑/阻力位判断,提高信号可靠性。
|
|
2. 对RSI和MACD的参数进行优化,找到最适合当前市场状况和目标资产的参数组合,减少虚假信号。
|
|
3. 加入市场环境分析,如交易量、波动率等,根据不同市场状态动态调整策略参数,提高适应性。
|
|
4. 设置适当的仓位管理规则,如根据信号强度和风险水平调整头寸大小,以控制总体风险敞口。
|
|
5. 定期回测和评估策略表现,根据市场变化及时调整策略逻辑和参数,确保策略的有效性和稳健性。
|
|
|
|
通过以上优化措施,可以进一步提升该策略的风险调整后收益,使其更好地适应多变的市场环境。
|
|
|
|
#### 总结
|
|
Snehashish设计的这一长线交易策略巧妙地结合了MACD和RSI两个技术指标,以更高的精度捕捉市场转折点,优化进场和出场时机。通过等待RSI确认超卖状态,并以MACD线穿过信号线作为开仓信号,策略可以在趋势初现反转迹象时及时进场。同时,利用MACD直方图和信号线的相对位置,以及RSI的超买信号,策略能够在上行趋势可能结束时及时平仓。
|
|
|
|
尽管该策略展现了良好的潜力,但仍然存在一些风险,如震荡市中的过度交易、强趋势下的信号滞后等。为了缓解这些风险,可以考虑引入其他指标、优化参数设置、加强市场环境分析、改进仓位管理等措施。
|
|
|
|
总的来说,这一结合MACD和RSI的长线交易策略为投资者提供了一个可靠的框架,以捕捉市场转折点,优化进出场时机。通过进一步的优化和改进,该策略有望成为投资者在多变市场中的有力工具,助其实现稳健的长期回报。
|
|
|
|
||
|
|
|
|
#### Overview
|
|
This strategy, skillfully crafted by script expert Snehashish, innovatively combines the strengths of the Moving Average Convergence Divergence (MACD) and the Relative Strength Index (RSI) to identify optimal entry and exit points in the market. The approach is meticulously designed to enter a long trade precisely when the MACD line crosses above the signal line, provided that the RSI indicated an oversold condition in the market just 5 candles prior. This timing ensures that the strategy capitalizes on the initial signs of market recovery after a sell-off, as indicated by the MACD crossover.
|
|
|
|
For closing positions, the strategy employs two critical conditions to signal an exit. First, the trade concludes when the MACD histogram is above zero, and the MACD line crosses below the signal line, indicating a potential reversal in upward momentum. Second, an exit signal is generated if the RSI was found to be in an overbought state 5 candles before, suggesting that the market may have reached a peak and could be headed for a downturn.
|
|
|
|
Snehashish's method elegantly combines these technical indicators, filtering out noise by waiting for confirmation from both MACD and RSI under specific conditions, aiming for trades with a higher probability of success. This strategic combination seeks to optimize entry and exit points, potentially enhancing the profitability of trades by leveraging the strengths of the indicators to mitigate risks associated with market volatility.
|
|
|
|
#### Strategy Principle
|
|
The core principle of this strategy is to combine the MACD and RSI technical indicators to capture market turning points with greater precision. The strategy enters a long trade when the RSI shows that the market has been oversold in the recent candles, followed by the MACD line crossing above the signal line. This combination ensures that the strategy opens a position as soon as the price action shows early signs of a potential reversal.
|
|
|
|
For closing positions, the strategy focuses on potential trend reversal signals indicated by the MACD and RSI. If the MACD histogram is above zero and the MACD line crosses below the signal line, the strategy exits the trade. Additionally, if the RSI had previously shown the market reaching overbought levels, it also triggers a position close. Together, these conditions imply that the strategy closes out long positions when the price may have peaked and upward momentum is waning.
|
|
|
|
Overall, by combining the signals provided by the MACD and RSI, the strategy aims to open positions as soon as a trend shows early signs of reversing and close positions when the trend may be ending, thus optimizing entry and exit points to enhance overall trading performance.
|
|
|
|
#### Strategy Advantages
|
|
1. By combining the MACD and RSI indicators, the strategy can more accurately capture market turning points, optimizing entry and exit timings.
|
|
2. The RSI is used to confirm oversold and overbought market conditions, while the MACD line crossing the signal line provides an entry signal, making the combination of the two indicators a more reliable predictor of price movements.
|
|
3. Waiting for the RSI to confirm an oversold state before entering a position helps avoid premature entries during a downtrend.
|
|
4. Exiting when the MACD histogram is above zero and the MACD line crosses below the signal line allows for timely closure of long positions towards the end of an uptrend, avoiding potential pullback risks.
|
|
5. Flexible parameter settings, such as the overbought and oversold thresholds for RSI and the fast and slow line periods for MACD, allow users to optimize the strategy according to their risk preferences and market characteristics.
|
|
|
|
#### Strategy Risks
|
|
1. In choppy markets, frequent MACD and RSI signals may lead to overtrading, increasing transaction costs and potential losses.
|
|
2. If the market trend is strong, the RSI may remain in the overbought zone for an extended period, causing the strategy to miss out on some of the upside.
|
|
3. The strategy relies primarily on lagging indicators, which may not allow for timely position adjustments during sudden market reversals.
|
|
4. The performance of the strategy is heavily influenced by parameter settings, and inappropriate parameters may result in numerous false signals, reducing the strategy's efficiency.
|
|
|
|
To mitigate these risks, one can consider introducing other leading indicators as filters, optimizing parameters to suit different market conditions, and setting appropriate stop-losses and take-profits to manage risk on individual trades.
|
|
|
|
#### Strategy Optimization Directions
|
|
1. Incorporate additional technical indicators, such as Bollinger Bands, moving averages, etc., to provide extra trend confirmation and support/resistance level identification, enhancing signal reliability.
|
|
2. Optimize the parameters for RSI and MACD to find the most suitable combinations for the current market conditions and target assets, reducing false signals.
|
|
3. Introduce market environment analysis, such as trading volume, volatility, etc., to dynamically adjust strategy parameters based on different market states, improving adaptability.
|
|
4. Implement appropriate position sizing rules, such as adjusting position sizes based on signal strength and risk levels, to manage overall risk exposure.
|
|
5. Regularly backtest and evaluate strategy performance, promptly adjusting strategy logic and parameters based on market changes to ensure the strategy remains effective and robust.
|
|
|
|
By implementing these optimization measures, the risk-adjusted returns of the strategy can be further enhanced, making it better suited to navigate the ever-changing market environment.
|
|
|
|
#### Conclusion
|
|
Snehashish's long-term trading strategy skillfully combines the MACD and RSI technical indicators to capture market turning points with greater precision, optimizing entry and exit timings. By waiting for the RSI to confirm an oversold state and using the MACD line crossing the signal line as an entry signal, the strategy can enter positions as soon as a trend shows early signs of reversing. Similarly, by utilizing the relative positions of the MACD histogram and signal line, along with the RSI's overbought signal, the strategy can exit positions in a timely manner when an uptrend may be ending.
|
|
|
|
Although the strategy shows good potential, it still carries some risks, such as overtrading in choppy markets and signal lag during strong trends. To mitigate these risks, one can consider introducing other indicators, optimizing parameter settings, enhancing market environment analysis, and improving position sizing, among other measures.
|
|
|
|
Overall, this MACD and RSI-based long-term trading strategy provides investors with a reliable framework for capturing market turning points and optimizing entry and exit timings. With further optimization and refinement, the strategy could become a powerful tool for investors to achieve robust long-term returns in the face of changing market conditions.
|
|
[/trans]
|
|
|
|
> Strategy Arguments
|
|
|
|
|
|
|
|
|Argument|Default|Description|
|
|
|----|----|----|
|
|
|v_input_bool_1|true|(?SL/TP For Long Strategy)Enable Long Strategy|
|
|
|v_input_float_1|50|Stoploss %|
|
|
|v_input_float_2|50|Take Profit %|
|
|
|v_input_bool_2|true|(?SL/TP For Short Strategy)Enable Short Strategy|
|
|
|v_input_float_3|50|Stoploss %|
|
|
|v_input_float_4|50|Take Profit %|
|
|
|v_input_int_1|true|(?Date Range)Start Date|
|
|
|v_input_int_2|true|Start Month|
|
|
|v_input_int_3|2023|Start Year|
|
|
|v_input_int_4|true|End Date|
|
|
|v_input_int_5|12|End Month|
|
|
|v_input_int_6|2077|End Year|
|
|
|v_input_int_7|30|(?RSI)Over Sold Level|
|
|
|v_input_int_8|70|Over Bought Level|
|
|
|v_input_int_9|14|RSI Length|
|
|
|v_input_int_10|12|(?MACD)FastMA Length|
|
|
|v_input_int_11|26|SlowMA Length|
|
|
|v_input_int_12|9|Signal Length|
|
|
|
|
|
|
> Source (PineScript)
|
|
|
|
``` pinescript
|
|
/*backtest
|
|
start: 2024-03-01 00:00:00
|
|
end: 2024-03-31 23:59:59
|
|
period: 1h
|
|
basePeriod: 15m
|
|
exchanges: [{"eid":"Futures_Binance","currency":"BTC_USDT"}]
|
|
*/
|
|
|
|
//@version=5
|
|
// snehashish 2024
|
|
strategy(title='spl Long Strategy', initial_capital=100000, default_qty_type=strategy.percent_of_equity, default_qty_value=100, pyramiding=0, currency='USD', overlay=true)
|
|
|
|
//// Stoploss and Take Profit Parameters
|
|
// Enable Long Strategy
|
|
enable_long_strategy = input.bool(true, title='Enable Long Strategy', group='SL/TP For Long Strategy', inline='1')
|
|
long_stoploss_value = input.float(50, title='Stoploss %', minval=0, group='SL/TP For Long Strategy', inline='2')
|
|
long_takeprofit_value = input.float(50, title='Take Profit %', minval=0, group='SL/TP For Long Strategy', inline='2')
|
|
|
|
// Enable Short Strategy
|
|
enable_short_strategy = input.bool(true, title='Enable Short Strategy', group='SL/TP For Short Strategy', inline='3')
|
|
short_stoploss_value = input.float(50, title='Stoploss %', minval=0, group='SL/TP For Short Strategy', inline='4')
|
|
short_takeprofit_value = input.float(50, title='Take Profit %', minval=0, group='SL/TP For Short Strategy', inline='4')
|
|
|
|
// Date Range
|
|
start_date = input.int(1, title='Start Date', minval=1, maxval=31, group='Date Range', inline='1')
|
|
start_month = input.int(1, title='Start Month', minval=1, maxval=12, group='Date Range', inline='2')
|
|
start_year = input.int(2023, title='Start Year', minval=1800, maxval=3000, group='Date Range', inline='3')
|
|
end_date = input.int(1, title='End Date', minval=1, maxval=31, group='Date Range', inline='4')
|
|
end_month = input.int(12, title='End Month', minval=1, maxval=12, group='Date Range', inline='5')
|
|
end_year = input.int(2077, title='End Year', minval=1800, maxval=3000, group='Date Range', inline='6')
|
|
in_date_range = true
|
|
|
|
//// Indicator Inputs
|
|
// RSI
|
|
rsi_over_sold = input.int(30, title='Over Sold Level', group='RSI')
|
|
rsi_over_bought = input.int(70, title='Over Bought Level', group='RSI')
|
|
rsi_length = input.int(14, title='RSI Length', group='RSI')
|
|
rsi = ta.rsi(close, rsi_length)
|
|
|
|
// MACD
|
|
fast_ma = input.int(12, title='FastMA Length', group='MACD')
|
|
slow_ma = input.int(26, title='SlowMA Length', group='MACD')
|
|
signal_length = input.int(9, title='Signal Length', group='MACD')
|
|
[macd_line, signal_line, _] = ta.macd(close, fast_ma, slow_ma, signal_length)
|
|
|
|
//// Strategy Logic
|
|
was_over_sold = ta.barssince(rsi <= rsi_over_sold) <= 10
|
|
was_over_bought = ta.barssince(rsi >= rsi_over_bought) <= 10
|
|
crossover_bull = ta.crossover(macd_line, signal_line)
|
|
crossover_bear = ta.crossunder(macd_line, signal_line)
|
|
buy_signal = was_over_sold and crossover_bull and in_date_range
|
|
sell_signal = was_over_bought and crossover_bear and in_date_range
|
|
|
|
// Long Strategy
|
|
if (enable_long_strategy and buy_signal)
|
|
strategy.entry('Long', strategy.long)
|
|
strategy.exit('Long SL/TP', from_entry='Long', stop=strategy.position_avg_price * (1 - long_stoploss_value / 100), limit=strategy.position_avg_price * (1 + long_takeprofit_value / 100))
|
|
|
|
// Short Strategy
|
|
if (enable_short_strategy and sell_signal)
|
|
strategy.entry('Short', strategy.short)
|
|
strategy.exit('Short SL/TP', from_entry='Short', stop=strategy.position_avg_price * (1 + short_stoploss_value / 100), limit=strategy.position_avg_price * (1 - short_takeprofit_value / 100))
|
|
```
|
|
|
|
> Detail
|
|
|
|
https://www.fmz.com/strategy/449815
|
|
|
|
> Last Modified
|
|
|
|
2024-04-29 14:31:53
|