
424 lines
20 KiB
Markdown
424 lines
20 KiB
Markdown
|
|
> Name
|
|
|
|
Kuberan策略市场掌控的交汇策略Kuberan-Strategy-The-Confluence-Approach-for-Market-Mastery
|
|
|
|
> Author
|
|
|
|
ChaoZhang
|
|
|
|
> Strategy Description
|
|
|
|
|
|
[trans]
|
|
|
|
## 策略概述
|
|
|
|
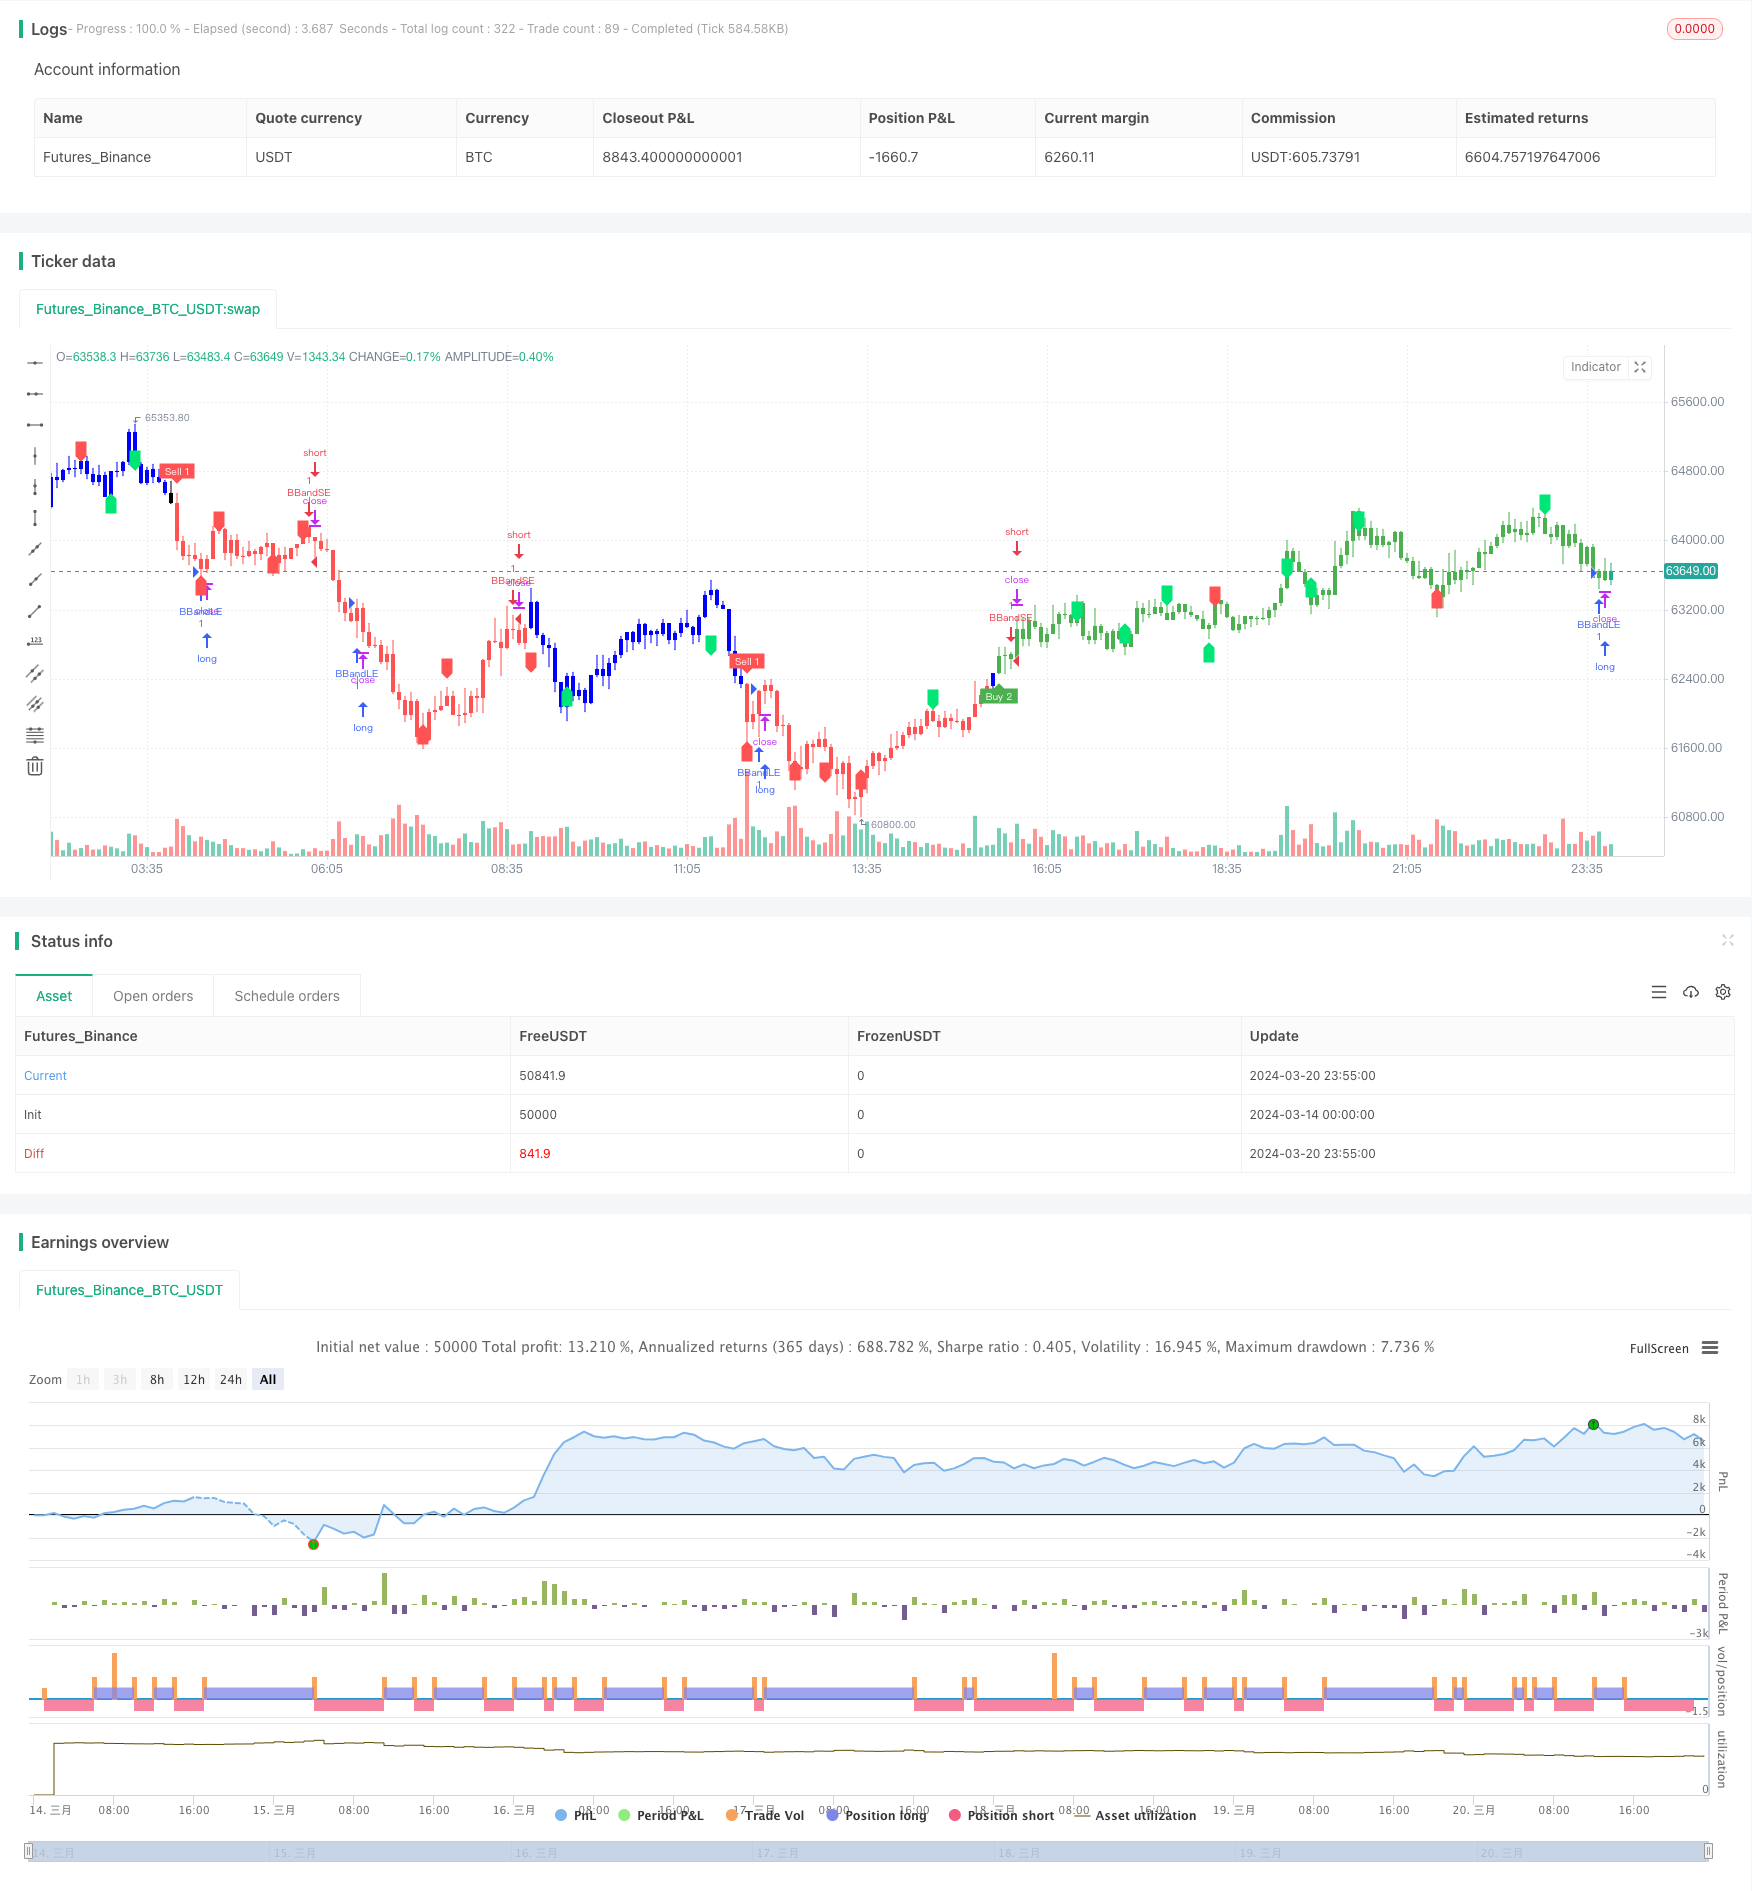
Kuberan策略是由Kathir编写的一款强大的交易策略。它融合了多种分析技术,形成了一个独特而强大的交易方法。该策略以财富之神Kuberan命名,象征着其丰富交易者投资组合的目标。
|
|
|
|
Kuberan不仅仅是一个策略,更是一个全面的交易系统。它结合了趋势分析、动量指标和成交量指标,以识别高概率的交易机会。通过利用这些要素的协同作用,Kuberan提供了明确的进场和出场信号,适用于各种水平的交易者。
|
|
|
|
## 策略原理
|
|
|
|
Kuberan策略的核心是多指标交汇原理。它利用了一种独特的指标组合,这些指标相互配合,以减少噪音和错误信号。具体来说,该策略使用了以下几个关键组件:
|
|
|
|
1. 趋势方向判断:通过比较当前价格与支撑位和阻力位,判断当前趋势方向。
|
|
2. 支撑阻力位:通过zigzag指标和枢轴点来识别关键的支撑位和阻力位。
|
|
3. 背离判断:通过比较价格走势与动量指标,判断是否出现背离,提示潜在的趋势反转。
|
|
4. 波动率自适应:通过ATR指标动态调整止损位,以适应不同的市场波动率。
|
|
5. K线型态判断:通过特定的K线组合来确认趋势和反转信号。
|
|
|
|
通过综合考虑以上因素,Kuberan策略能够在各种市场环境下自适应调整,捕捉高概率的交易机会。
|
|
|
|
## 策略优势
|
|
|
|
1. 多指标交汇:Kuberan策略利用了多个指标的协同作用,大大提高了信号的可靠性,降低了噪音干扰。
|
|
2. 自适应性强:通过动态调整参数,该策略能够适应多变的市场环境,不易失效。
|
|
3. 明确信号:Kuberan提供清晰的进场和出场信号,简化了交易决策过程。
|
|
4. 回测稳健:该策略经过了严格的历史回测,在各种市场行情下都表现稳健。
|
|
5. 适用性广:Kuberan适用于多种市场和品种,不限于特定交易标的。
|
|
|
|
## 策略风险
|
|
|
|
1. 参数敏感:Kuberan策略的表现对参数选择较为敏感,不当的参数可能导致表现下降。
|
|
2. 突发事件:该策略主要基于技术面信号,对基本面突发事件的应对能力有限。
|
|
3. 过拟合风险:如果在参数优化时考虑过多的历史数据,可能导致策略过于迎合过去,而对未来行情适应性下降。
|
|
4. 杠杆风险:如果使用过高杠杆,遭遇较大回撤时有爆仓风险。
|
|
|
|
针对以上风险,可以采取适当的控制措施,如定期调整参数、设置合理止损、适度控制杠杆、关注基本面变化等。
|
|
|
|
## 优化方向
|
|
|
|
1. 机器学习优化:可以引入机器学习算法来动态优化策略参数,提高适应性。
|
|
2. 加入基本面因素:考虑将基本面分析纳入交易决策,以应对技术面信号失效的情况。
|
|
3. 投资组合管理:在资金管理层面,可以将Kuberan策略纳入投资组合,与其他策略形成有效对冲。
|
|
4. 细分市场优化:针对不同市场品种的特点,定制优化策略参数。
|
|
5. 高频化改造:将策略改造为高频交易版本,捕捉更多短线交易机会。
|
|
|
|
## 总结
|
|
|
|
Kuberan是一款功能强大,安全可靠的交易策略。它巧妙地融合了多种技术分析方法,通过指标交汇原理,在捕捉趋势和把握转折点方面表现出色。尽管任何策略都难免面临风险,但Kuberan已经在回测中证明了其稳健性,通过适当的风险控制和优化措施,相信该策略能够帮助交易者在市场博弈中掌控先机,驱动投资组合的长期稳健增长。
|
|
|
|
||
|
|
|
|
## Strategy Overview
|
|
|
|
The Kuberan strategy is a powerful trading strategy developed by Kathir. It combines multiple analytical techniques to form a unique and potent trading approach. Named after the god of wealth, Kuberan, the strategy symbolizes its goal of enriching traders' portfolios.
|
|
|
|
Kuberan is more than just a strategy; it is a comprehensive trading system. It integrates trend analysis, momentum indicators, and volume metrics to identify high-probability trading opportunities. By leveraging the synergy of these elements, Kuberan provides clear entry and exit signals, suitable for traders of all levels.
|
|
|
|
## Strategy Principles
|
|
|
|
At the core of the Kuberan strategy is the principle of multi-indicator confluence. It utilizes a unique combination of indicators that work in harmony to reduce noise and false signals. Specifically, the strategy employs the following key components:
|
|
|
|
1. Trend direction determination: By comparing current prices with support and resistance levels, it determines the prevailing trend direction.
|
|
2. Support and resistance levels: Identifies key support and resistance levels using the zigzag indicator and pivot points.
|
|
3. Divergence detection: Compares price action with momentum indicators to spot potential trend reversals signaled by divergences.
|
|
4. Volatility adaptation: Dynamically adjusts stop-loss levels based on the ATR indicator to adapt to varying market volatility.
|
|
5. Candlestick pattern recognition: Confirms trend and reversal signals using specific candlestick combinations.
|
|
|
|
By comprehensively considering these factors, the Kuberan strategy can adaptively adjust to various market conditions and capture high-probability trading opportunities.
|
|
|
|
## Strategy Advantages
|
|
|
|
1. Multi-indicator confluence: Kuberan leverages the synergy of multiple indicators, greatly enhancing signal reliability and reducing noise interference.
|
|
2. High adaptability: Through dynamic parameter adjustments, the strategy can adapt to changing market environments, avoiding obsolescence.
|
|
3. Clear signals: Kuberan provides clear entry and exit signals, simplifying the trading decision process.
|
|
4. Robust backtesting: The strategy has undergone rigorous historical backtesting, demonstrating consistent performance across various market scenarios.
|
|
5. Wide applicability: Kuberan is applicable to multiple markets and instruments, not limited to specific trading vehicles.
|
|
|
|
## Strategy Risks
|
|
|
|
1. Parameter sensitivity: The performance of the Kuberan strategy is sensitive to parameter selection; inappropriate parameters may lead to suboptimal results.
|
|
2. Black swan events: The strategy primarily relies on technical signals and has limited ability to handle fundamental black swan events.
|
|
3. Overfitting risk: If too much historical data is considered during parameter optimization, the strategy may become overly fitted to the past, reducing its adaptability to future market conditions.
|
|
4. Leverage risk: Using excessive leverage poses the risk of margin calls during significant drawdowns.
|
|
|
|
To mitigate these risks, appropriate control measures can be implemented, such as periodic parameter adjustments, setting reasonable stop-losses, moderating leverage, and monitoring fundamental changes.
|
|
|
|
## Optimization Directions
|
|
|
|
1. Machine learning optimization: Introduce machine learning algorithms to dynamically optimize strategy parameters and enhance adaptability.
|
|
2. Incorporation of fundamental factors: Consider integrating fundamental analysis into trading decisions to handle situations where technical signals fail.
|
|
3. Portfolio management: At the capital management level, include the Kuberan strategy in a diversified portfolio to achieve effective hedging with other strategies.
|
|
4. Market-specific optimization: Customize strategy parameters based on the characteristics of different markets and instruments.
|
|
5. High-frequency transformation: Adapt the strategy into a high-frequency trading version to capture more short-term trading opportunities.
|
|
|
|
## Conclusion
|
|
|
|
Kuberan is a powerful and reliable trading strategy that ingeniously combines multiple technical analysis methods. Through the principle of indicator confluence, it excels in capturing trends and identifying turning points. While no strategy is immune to risks, Kuberan has proven its robustness in backtesting. With appropriate risk control measures and optimization efforts, this strategy can help traders gain an edge in market battles, driving long-term, steady growth of their investment portfolios.
|
|
|
|
[/trans]
|
|
|
|
> Strategy Arguments
|
|
|
|
|
|
|
|
|Argument|Default|Description|
|
|
|----|----|----|
|
|
|v_input_int_1|5|Left Bars|
|
|
|v_input_int_2|5|Right Bars|
|
|
|v_input_bool_1|false|Support/Resistance|
|
|
|v_input_color_1|lime|supcol|
|
|
|v_input_color_2|red|rescol|
|
|
|v_input_int_3|3|srlinewidth|
|
|
|v_input_bool_2|true|Change Bar Color|
|
|
|v_input_color_3|blue|bcolup|
|
|
|v_input_color_4|black|bcoldn|
|
|
|v_input_1|5|Key Value. 'This changes the sensitivity' for sell1|
|
|
|v_input_2|400|ATR Period for sell1|
|
|
|v_input_3|6|Key Value. 'This changes the sensitivity' for buy2|
|
|
|v_input_4|true|ATR Period for buy2|
|
|
|v_input_5|false|Signals from Heikin Ashi Candles|
|
|
|v_input_int_4|20|length|
|
|
|v_input_float_1|2|mult|
|
|
|v_input_int_5|14|Swing Detection Lookback|
|
|
|v_input_float_2|true|Slope|
|
|
|v_input_string_1|0|Slope Calculation Method: Atr|Stdev|Linreg|
|
|
|v_input_6|true|backpaint|
|
|
|v_input_7|true|Show Extended Lines|
|
|
|v_input_color_5|teal|(?Style)Up Trendline Color|
|
|
|v_input_color_6|red|Down Trendline Color|
|
|
|
|
|
|
> Source (PineScript)
|
|
|
|
``` pinescript
|
|
/*backtest
|
|
start: 2024-03-14 00:00:00
|
|
end: 2024-03-21 00:00:00
|
|
period: 5m
|
|
basePeriod: 1m
|
|
exchanges: [{"eid":"Futures_Binance","currency":"BTC_USDT"}]
|
|
*/
|
|
|
|
// This source code is subject to the terms of the Mozilla Public License 2.0 at https://mozilla.org/MPL/2.0/
|
|
// © LonesomeThecolor.blue
|
|
// This source code is subject to the terms of the Mozilla Public License 2.0 at https://mozilla.org/MPL/2.0/
|
|
// © LonesomeThecolor.blue
|
|
|
|
//@version=5
|
|
strategy('Kuberan*', overlay=true, max_lines_count=500)
|
|
lb = input.int(5, title='Left Bars', minval=1)
|
|
rb = input.int(5, title='Right Bars', minval=1)
|
|
showsupres = input.bool(false, title='Support/Resistance', inline='srcol')
|
|
supcol = input.color(color.lime, title='', inline='srcol')
|
|
rescol = input.color(color.red, title='', inline='srcol')
|
|
// srlinestyle = input(line.style_dotted, title='Line Style/Width', inline='style')
|
|
srlinewidth = input.int(3, title='', minval=1, maxval=5, inline='style')
|
|
changebarcol = input.bool(true, title='Change Bar Color', inline='bcol')
|
|
bcolup = input.color(color.blue, title='', inline='bcol')
|
|
bcoldn = input.color(color.black, title='', inline='bcol')
|
|
|
|
ph = ta.pivothigh(lb, rb)
|
|
pl = ta.pivotlow(lb, rb)
|
|
|
|
iff_1 = pl ? -1 : na // Trend direction
|
|
hl = ph ? 1 : iff_1
|
|
iff_2 = pl ? pl : na // similar to zigzag but may have multTLiple highs/lows
|
|
zz = ph ? ph : iff_2
|
|
valuewhen_1 = ta.valuewhen(hl, hl, 1)
|
|
valuewhen_2 = ta.valuewhen(zz, zz, 1)
|
|
zz := pl and hl == -1 and valuewhen_1 == -1 and pl > valuewhen_2 ? na : zz
|
|
valuewhen_3 = ta.valuewhen(hl, hl, 1)
|
|
valuewhen_4 = ta.valuewhen(zz, zz, 1)
|
|
zz := ph and hl == 1 and valuewhen_3 == 1 and ph < valuewhen_4 ? na : zz
|
|
|
|
valuewhen_5 = ta.valuewhen(hl, hl, 1)
|
|
valuewhen_6 = ta.valuewhen(zz, zz, 1)
|
|
hl := hl == -1 and valuewhen_5 == 1 and zz > valuewhen_6 ? na : hl
|
|
valuewhen_7 = ta.valuewhen(hl, hl, 1)
|
|
valuewhen_8 = ta.valuewhen(zz, zz, 1)
|
|
hl := hl == 1 and valuewhen_7 == -1 and zz < valuewhen_8 ? na : hl
|
|
zz := na(hl) ? na : zz
|
|
|
|
findprevious() => // finds previous three points (b, c, d, e)
|
|
ehl = hl == 1 ? -1 : 1
|
|
loc1 = 0.0
|
|
loc2 = 0.0
|
|
loc3 = 0.0
|
|
loc4 = 0.0
|
|
xx = 0
|
|
for x = 1 to 1000 by 1
|
|
if hl[x] == ehl and not na(zz[x])
|
|
loc1 := zz[x]
|
|
xx := x + 1
|
|
break
|
|
ehl := hl
|
|
for x = xx to 1000 by 1
|
|
if hl[x] == ehl and not na(zz[x])
|
|
loc2 := zz[x]
|
|
xx := x + 1
|
|
break
|
|
ehl := hl == 1 ? -1 : 1
|
|
for x = xx to 1000 by 1
|
|
if hl[x] == ehl and not na(zz[x])
|
|
loc3 := zz[x]
|
|
xx := x + 1
|
|
break
|
|
ehl := hl
|
|
for x = xx to 1000 by 1
|
|
if hl[x] == ehl and not na(zz[x])
|
|
loc4 := zz[x]
|
|
break
|
|
[loc1, loc2, loc3, loc4]
|
|
|
|
float a = na
|
|
float b = na
|
|
float c = na
|
|
float d = na
|
|
float e = na
|
|
if not na(hl)
|
|
[loc1, loc2, loc3, loc4] = findprevious()
|
|
a := zz
|
|
b := loc1
|
|
c := loc2
|
|
d := loc3
|
|
e := loc4
|
|
e
|
|
|
|
_hh = zz and a > b and a > c and c > b and c > d
|
|
_ll = zz and a < b and a < c and c < b and c < d
|
|
_hl = zz and (a >= c and b > c and b > d and d > c and d > e or a < b and a > c and b < d)
|
|
_lh = zz and (a <= c and b < c and b < d and d < c and d < e or a > b and a < c and b > d)
|
|
|
|
plotshape(_hl, title='Higher Low', style=shape.labelup, color=color.new(color.lime, 0), textcolor=color.new(color.black, 0), location=location.belowbar, offset=-rb)
|
|
plotshape(_hh, title='Higher High', style=shape.labeldown, color=color.new(color.lime, 0), textcolor=color.new(color.black, 0), location=location.abovebar, offset=-rb)
|
|
plotshape(_ll, title='Lower Low', style=shape.labelup, color=color.new(color.red, 0), textcolor=color.new(color.white, 0), location=location.belowbar, offset=-rb)
|
|
plotshape(_lh, title='Lower High', style=shape.labeldown, color=color.new(color.red, 0), textcolor=color.new(color.white, 0), location=location.abovebar, offset=-rb)
|
|
|
|
float res = na
|
|
float sup = na
|
|
res := _lh ? zz : res[1]
|
|
sup := _hl ? zz : sup[1]
|
|
|
|
int trend = na
|
|
iff_3 = close < sup ? -1 : nz(trend[1])
|
|
trend := close > res ? 1 : iff_3
|
|
|
|
res := trend == 1 and _hh or trend == -1 and _lh ? zz : res
|
|
sup := trend == 1 and _hl or trend == -1 and _ll ? zz : sup
|
|
rechange = res != res[1]
|
|
suchange = sup != sup[1]
|
|
|
|
var line resline = na
|
|
var line supline = na
|
|
if showsupres
|
|
if rechange
|
|
line.set_x2(resline, bar_index)
|
|
line.set_extend(resline, extend=extend.none)
|
|
resline := line.new(x1=bar_index - rb, y1=res, x2=bar_index, y2=res, color=rescol, extend=extend.right, style=line.style_dotted, width=srlinewidth)
|
|
resline
|
|
|
|
if suchange
|
|
line.set_x2(supline, bar_index)
|
|
line.set_extend(supline, extend=extend.none)
|
|
supline := line.new(x1=bar_index - rb, y1=sup, x2=bar_index, y2=sup, color=supcol, extend=extend.right, style=line.style_dotted, width=srlinewidth)
|
|
supline
|
|
|
|
iff_4 = trend == 1 ? bcolup : bcoldn
|
|
barcolor(color=changebarcol ? iff_4 : na)
|
|
|
|
|
|
|
|
|
|
// Inputs
|
|
A1 = input(5, title='Key Value. \'This changes the sensitivity\' for sell1')
|
|
C1 = input(400, title='ATR Period for sell1')
|
|
A2 = input(6, title='Key Value. \'This changes the sensitivity\' for buy2')
|
|
C2 = input(1, title='ATR Period for buy2')
|
|
h = input(false, title='Signals from Heikin Ashi Candles')
|
|
|
|
xATR1 = ta.atr(C1)
|
|
xATR2 = ta.atr(C2)
|
|
nLoss1 = A1 * xATR1
|
|
nLoss2 = A2 * xATR2
|
|
|
|
src = h ? request.security(ticker.heikinashi(syminfo.tickerid), timeframe.period, close, lookahead=barmerge.lookahead_off) : close
|
|
|
|
xATRTrailingStop1 = 0.0
|
|
iff_5 = src > nz(xATRTrailingStop1[1], 0) ? src - nLoss1 : src + nLoss1
|
|
iff_6 = src < nz(xATRTrailingStop1[1], 0) and src[1] < nz(xATRTrailingStop1[1], 0) ? math.min(nz(xATRTrailingStop1[1]), src + nLoss1) : iff_5
|
|
xATRTrailingStop1 := src > nz(xATRTrailingStop1[1], 0) and src[1] > nz(xATRTrailingStop1[1], 0) ? math.max(nz(xATRTrailingStop1[1]), src - nLoss1) : iff_6
|
|
|
|
xATRTrailingStop2 = 0.0
|
|
iff_7 = src > nz(xATRTrailingStop2[1], 0) ? src - nLoss2 : src + nLoss2
|
|
iff_8 = src < nz(xATRTrailingStop2[1], 0) and src[1] < nz(xATRTrailingStop2[1], 0) ? math.min(nz(xATRTrailingStop2[1]), src + nLoss2) : iff_7
|
|
xATRTrailingStop2 := src > nz(xATRTrailingStop2[1], 0) and src[1] > nz(xATRTrailingStop2[1], 0) ? math.max(nz(xATRTrailingStop2[1]), src - nLoss2) : iff_8
|
|
|
|
pos1 = 0
|
|
iff_9 = src[1] > nz(xATRTrailingStop1[1], 0) and src < nz(xATRTrailingStop1[1], 0) ? -1 : nz(pos1[1], 0)
|
|
pos1 := src[1] < nz(xATRTrailingStop1[1], 0) and src > nz(xATRTrailingStop1[1], 0) ? 1 : iff_9
|
|
|
|
pos2 = 0
|
|
iff_10 = src[1] > nz(xATRTrailingStop2[1], 0) and src < nz(xATRTrailingStop2[1], 0) ? -1 : nz(pos2[1], 0)
|
|
pos2 := src[1] < nz(xATRTrailingStop2[1], 0) and src > nz(xATRTrailingStop2[1], 0) ? 1 : iff_10
|
|
|
|
xcolor1 = pos1 == -1 ? color.red : pos1 == 1 ? color.green : color.blue
|
|
xcolor2 = pos2 == -1 ? color.red : pos2 == 1 ? color.green : color.blue
|
|
|
|
ema1 = ta.ema(src, 1)
|
|
ema2 = ta.ema(src, 1)
|
|
above1 = ta.crossover(ema1, xATRTrailingStop1)
|
|
below1 = ta.crossover(xATRTrailingStop1, ema1)
|
|
above2 = ta.crossover(ema2, xATRTrailingStop2)
|
|
below2 = ta.crossover(xATRTrailingStop2, ema2)
|
|
|
|
buy1 = src > xATRTrailingStop1 and above1
|
|
sell1 = src < xATRTrailingStop1 and below1
|
|
buy2 = src > xATRTrailingStop2 and above2
|
|
sell2 = src < xATRTrailingStop2 and below2
|
|
|
|
barbuy1 = src > xATRTrailingStop1
|
|
barsell1 = src < xATRTrailingStop1
|
|
barbuy2 = src > xATRTrailingStop2
|
|
barsell2 = src < xATRTrailingStop2
|
|
|
|
// plotshape(buy1, title="Buy 1", text='Buy 1', style=shape.labelup, location=location.belowbar, color=color.green, textcolor=color.white, transp=0, size=size.tiny)
|
|
plotshape(sell1, title='Sell 1', text='Sell 1', style=shape.labeldown, location=location.abovebar, color=color.new(color.red, 0), textcolor=color.new(color.white, 0), size=size.tiny)
|
|
plotshape(buy2, title='Buy 2', text='Buy 2', style=shape.labelup, location=location.belowbar, color=color.new(color.green, 0), textcolor=color.new(color.white, 0), size=size.tiny)
|
|
// plotshape(sell2, title="Sell 2", text='Sell 2', style=shape.labeldown, location=location.abovebar, color=color.red, textcolor=color.white, transp=0, size=size.tiny)
|
|
|
|
// barcolor(barbuy1 ? color.green : na)
|
|
barcolor(barsell1 ? color.red : na)
|
|
barcolor(barbuy2 ? color.green : na)
|
|
// barcolor(barsell2 ? color.red : na)
|
|
|
|
// alertcondition(buy1, "UT Long 1", "UT Long 1")
|
|
alertcondition(sell1, 'UT Short 1', 'UT Short 1')
|
|
alertcondition(buy2, 'UT Long 2', 'UT Long 2')
|
|
|
|
// strategy.entry('long', strategy.long, when=buy2)
|
|
source = close
|
|
length = input.int(20, minval=1)
|
|
mult = input.float(2.0, minval=0.001, maxval=50)
|
|
basis = ta.sma(source, length)
|
|
dev = mult * ta.stdev(source, length)
|
|
upper = basis + dev
|
|
lower = basis - dev
|
|
buyEntry = ta.crossover(source, lower)
|
|
sellEntry = ta.crossunder(source, upper)
|
|
if (ta.crossover(source, lower) )
|
|
strategy.entry("BBandLE", strategy.long, stop=lower, oca_name="BollingerBands", comment="BBandLE")
|
|
else
|
|
strategy.cancel(id="BBandLE")
|
|
if (ta.crossunder(source, upper))
|
|
strategy.entry("BBandSE", strategy.short, stop=upper, oca_name="BollingerBands",comment="BBandSE")
|
|
else
|
|
strategy.cancel(id="BBandSE")
|
|
//plot(strategy.equity, title="equity", color=color.red, linewidth=2, style=plot.style_areabr)
|
|
|
|
lengthTL = input.int(14, 'Swing Detection Lookback')
|
|
multTL = input.float(1., 'Slope', minval = 0, step = .1)
|
|
calcMethod = input.string('Atr', 'Slope Calculation Method', options = ['Atr','Stdev','Linreg'])
|
|
backpaint = input(true, tooltip = 'Backpainting offset displayed elements in the past. Disable backpainting to see real time information returned by the indicator.')
|
|
|
|
//Style
|
|
upCss = input.color(color.teal, 'Up Trendline Color', group = 'Style')
|
|
dnCss = input.color(color.red, 'Down Trendline Color', group = 'Style')
|
|
showExt = input(true, 'Show Extended Lines')
|
|
|
|
//-----------------------------------------------------------------------------}
|
|
//Calculations
|
|
//-----------------------------------------------------------------------------{
|
|
var upperTL = 0.
|
|
var lowerTL = 0.
|
|
var slope_phTL = 0.
|
|
var slope_plTL = 0.
|
|
|
|
var offset = backpaint ? lengthTL : 0
|
|
|
|
n = bar_index
|
|
srcTL = close
|
|
|
|
phTL = ta.pivothigh(lengthTL, lengthTL)
|
|
plTL = ta.pivotlow(lengthTL, lengthTL)
|
|
|
|
//Slope Calculation Method
|
|
slope = switch calcMethod
|
|
'Atr' => ta.atr(lengthTL) / lengthTL * multTL
|
|
'Stdev' => ta.stdev(srcTL,lengthTL) / lengthTL * multTL
|
|
'Linreg' => math.abs(ta.sma(srcTL * n, lengthTL) - ta.sma(srcTL, lengthTL) * ta.sma(n, lengthTL)) / ta.variance(n, lengthTL) / 2 * multTL
|
|
|
|
//Get slopes and calculate trendlines
|
|
slope_phTL := phTL ? slope : slope_phTL
|
|
slope_plTL := plTL ? slope : slope_plTL
|
|
|
|
upperTL := phTL ? phTL : upperTL - slope_phTL
|
|
lowerTL := pl ? pl : lowerTL + slope_plTL
|
|
|
|
var upos = 0
|
|
var dnos = 0
|
|
upos := phTL ? 0 : close > upperTL - slope_phTL * lengthTL ? 1 : upos
|
|
dnos := pl ? 0 : close < lowerTL + slope_plTL * lengthTL ? 1 : dnos
|
|
|
|
```
|
|
|
|
> Detail
|
|
|
|
https://www.fmz.com/strategy/445806
|
|
|
|
> Last Modified
|
|
|
|
2024-03-22 14:08:11
|