
7.7 KiB
Name
Fisher变换指标回测策略Fisher-Transform-Backtest-Strategy
Author
ChaoZhang
Strategy Description
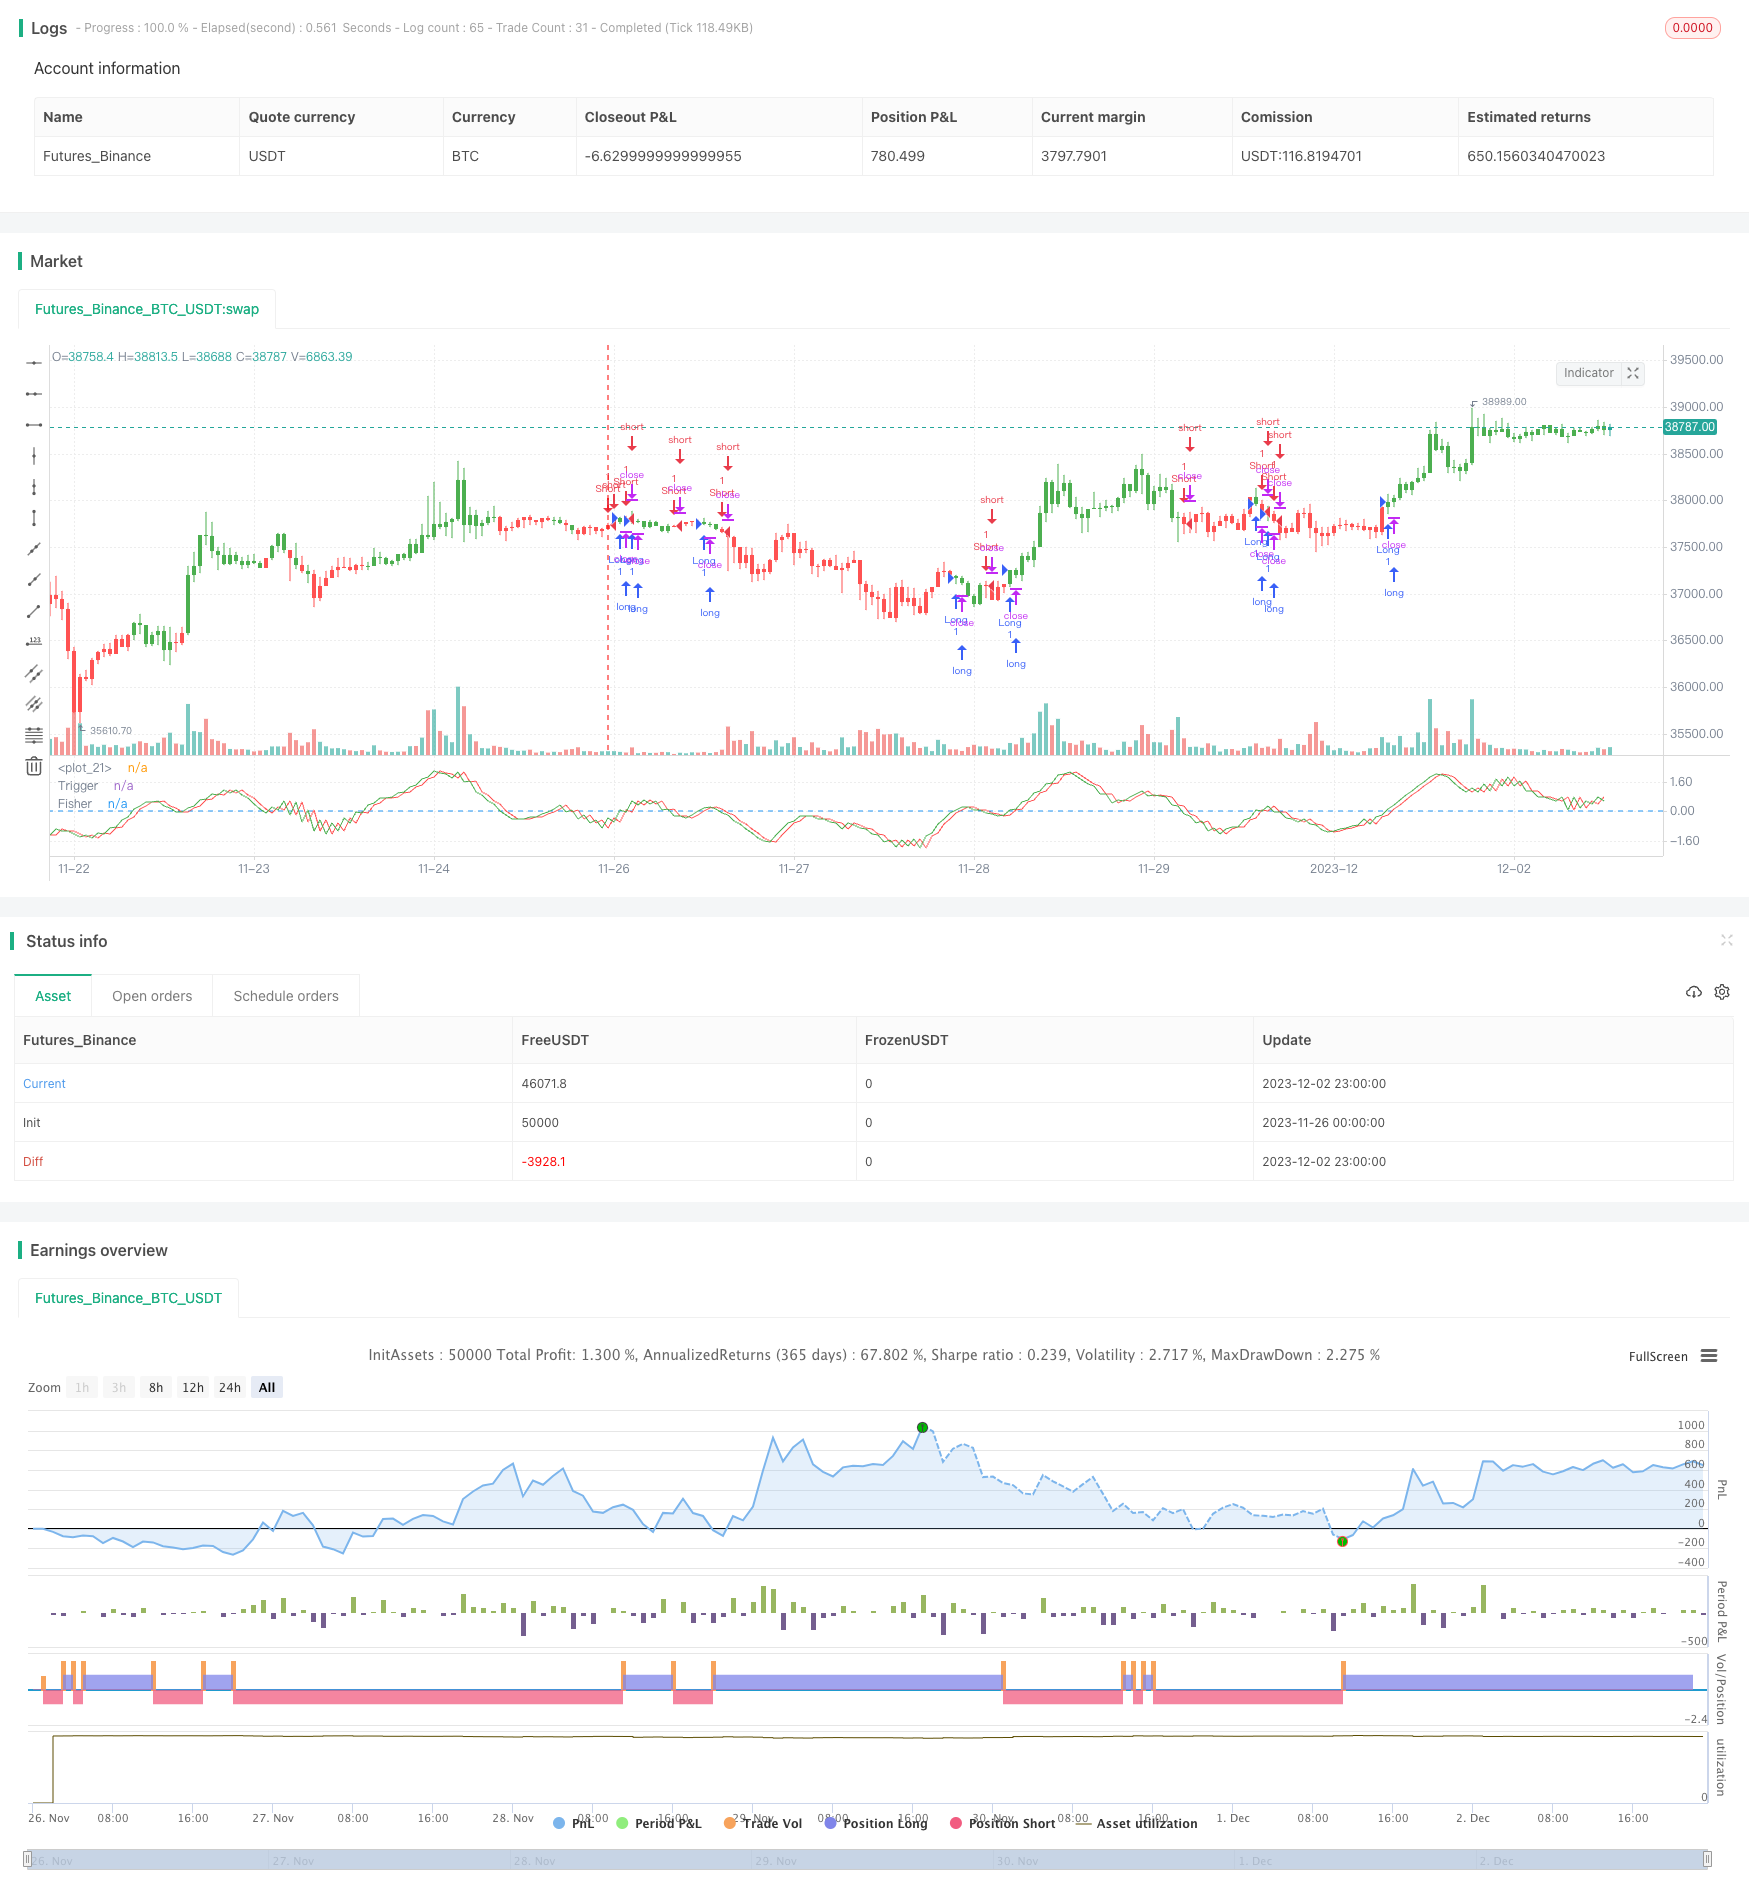 [trans]
概述
Fisher变换指标回测策略通过计算价格的Fisher变换, indentify价格反转点,并据此产生交易信号。该策略采用Fisher变换公式处理价格,去除价格的非高斯分布特征,从而产生近似高斯分布的标准化指标。策略根据Fisher变换曲线的转折点判断价格反转,产生买入和卖出信号。
策略原理
该策略的核心是运用Fisher变换公式处理价格,去除价格自然分布的非高斯特征。Fisher变换公式如下:
y = 0.5 * ln((1+x)/(1-x))
这里的x是经过处理的价格,先通过highest和lowest函数找到最近Length周期内的最高价和最低价,然后进行标准化,公式如下:
x = (price - 最小价)/(最大价 - 最小价) - 0.5
这样处理后的价格近似符合高斯分布。然后将其代入Fisher变换公式,得到Fisher变换曲线。Fisher变换曲线的转折点就是价格反转的信号。
当Fisher变换曲线从正转为负时,产生卖出信号;当从负转为正时,产生买入信号。
优势分析
-
Fisher变换指标去除价格的非高斯分布特征,使得价格更加规范,减少假信号
-
捕捉价格反转点,避免追高杀跌
-
参数调整灵活,可调整反转灵敏度
-
可自定义方向,适应多种市场环境
-
策略逻辑简单易懂,容易理解实现
风险分析
-
参数设置不当可能错过价格反转点或产生假信号
-
实盘容易受滑点影响,可能无法完美执行信号
-
价格剧烈波动时,Fisher曲线难于判断反转点
-
需确认反转后再入场,实盘操作难度大
解决方法:
-
调整Length参数的大小,优化参数
-
适当放宽入场条件,确保可以执行信号
-
结合其他指标过滤假信号
-
严格遵守策略规则,做好风险控制
优化方向
-
优化Length参数大小,找到最佳参数组合
-
增加过滤条件,避免假信号,如结合均线、波动率指标等
-
增加止损机制,控制单笔损失
-
加入重新入场机制,追踪持续趋势
总结
Fisher变换指标回测策略通过去除价格的非高斯特征,找出价格反转点,是一个易于实现的价值策略。该策略优势在于参数调整灵活,容易捕捉反转;劣势在于实盘操作难度大,需严格遵循入场规则。未来可通过多种手段优化该策略,使之更适合实盘应用。
||
Overview
The Fisher Transform backtest strategy calculates the Fisher transform of prices to identify price reversal points and generate trading signals accordingly. The strategy processes prices using the Fisher transform formula to remove non-Gaussian features of price distributions, resulting in a standardized indicator with an approximate Gaussian distribution. The strategy determines price reversals based on inflection points of the Fisher transform curve and produces long and short signals.
Strategy Principle
The core of this strategy is to process prices using the Fisher transform formula to eliminate non-Gaussian features of natural price distributions. The Fisher transform formula is:
y = 0.5 * ln((1+x)/(1-x))
Here x is the processed price, obtained by first finding the highest and lowest prices over the most recent Length periods using the highest and lowest functions, and then normalizing as follows:
x = (price - minimum)/(maximum - minimum) - 0.5
Prices processed this way approximate a Gaussian distribution. x is then substituted into the Fisher transform formula to obtain the Fisher transform curve. Inflection points in the Fisher transform curve signal price reversals.
When the Fisher transform curve turns from positive to negative, a sell signal is generated. When it turns from negative to positive, a buy signal is generated.
Advantage Analysis
-
The Fisher transform removes non-Gaussian features from prices, resulting in more well-behaved, standardized prices and fewer false signals
-
Captures price reversal points, avoiding chasing tops and bottoms
-
Flexible parameter adjustment for tuning reversal sensitivity
-
Customizable directionality, adapts to various market environments
-
Simple logic easy to understand and implement
Risk Analysis
-
Improper parameter settings may miss turns or generate false signals
-
Slippage in live trading may prevent perfect signal execution
-
Hard to identify turns when prices are volatile
-
Difficult to implement in live trading with need to confirm reversals
Solutions:
-
Optimize parameters by adjusting Length
-
Relax entry criteria appropriately to ensure fills
-
Filter false signals combining other indicators
-
Strictly follow rules and manage risks
Optimization Directions
-
Optimize Length parameter to find best combination
-
Add filters to avoid false signals e.g. moving averages, volatility indicators etc.
-
Incorporate stop loss to control loss per trade
-
Add re-entry mechanism to track continuing trends
Conclusion
The Fisher Transform backtest strategy identifies price reversal points by removing non-Gaussian price features. It is an easily implemented mean reversion strategy. Its advantages lie in flexible parameters for catching turns while its main weakness is the difficulty of live implementation with the need for strict entry rules. Various methods can be used to optimize this strategy for practical applicability.
[/trans]
Strategy Arguments
| Argument | Default | Description |
|---|---|---|
| v_input_1 | 10 | Length |
| v_input_2 | false | Trade reverse |
Source (PineScript)
/*backtest
start: 2023-11-26 00:00:00
end: 2023-12-03 00:00:00
period: 1h
basePeriod: 15m
exchanges: [{"eid":"Futures_Binance","currency":"BTC_USDT"}]
*/

//@version = 2
////////////////////////////////////////////////////////////
//  Copyright by HPotter v2.0 22/12/2016
// 	Market prices do not have a Gaussian probability density function
// 	as many traders think. Their probability curve is not bell-shaped.
// 	But trader can create a nearly Gaussian PDF for prices by normalizing
// 	them or creating a normalized indicator such as the relative strength
// 	index and applying the Fisher transform. Such a transformed output
// 	creates the peak swings as relatively rare events.
// 	Fisher transform formula is: y = 0.5 * ln ((1+x)/(1-x))
// 	The sharp turning points of these peak swings clearly and unambiguously
// 	identify price reversals in a timely manner.
//
//  For signal used zero.
// You can change long to short in the Input Settings
// Please, use it only for learning or paper trading. Do not for real trading.
////////////////////////////////////////////////////////////
strategy(title="Fisher Transform Indicator by Ehlers Backtest", shorttitle="Fisher Transform Indicator by Ehlers")
Length = input(10, minval=1)
reverse = input(false, title="Trade reverse")
hline(0, color=blue)
xHL2 = hl2
xMaxH = highest(xHL2, Length)
xMinL = lowest(xHL2,Length)
nValue1 = 0.33 * 2 * ((xHL2 - xMinL) / (xMaxH - xMinL) - 0.5) + 0.67 * nz(nValue1[1])
nValue2 =   iff(nValue1 > .99,  .999,
	         iff(nValue1 < -.99, -.999, nValue1))
nFish = 0.5 * log((1 + nValue2) / (1 - nValue2)) + 0.5 * nz(nFish[1])
pos = iff(nFish > 0, 1,
	   iff(nFish < 0, -1, nz(pos[1], 0)))
possig = iff(reverse and pos == 1, -1,
          iff(reverse and pos == -1, 1, pos))
if (possig == 1)
    strategy.entry("Long", strategy.long)
if (possig == -1)
    strategy.entry("Short", strategy.short)
barcolor(possig == -1 ? red: possig == 1 ? green : blue )
plot(nFish, color=green, title="Fisher")
plot(nz(nFish[1]), color=red, title="Trigger")
Detail
https://www.fmz.com/strategy/434166
Last Modified
2023-12-04 13:43:05