
144 lines
9.2 KiB
Markdown
144 lines
9.2 KiB
Markdown
|
|
> Name
|
|
|
|
Fisher变换动态阈值趋势跟踪策略-Fisher-Transform-Dynamic-Threshold-Trend-Following-Strategy
|
|
|
|
> Author
|
|
|
|
ChaoZhang
|
|
|
|
> Strategy Description
|
|
|
|
|
|
[trans]
|
|
#### 概述
|
|
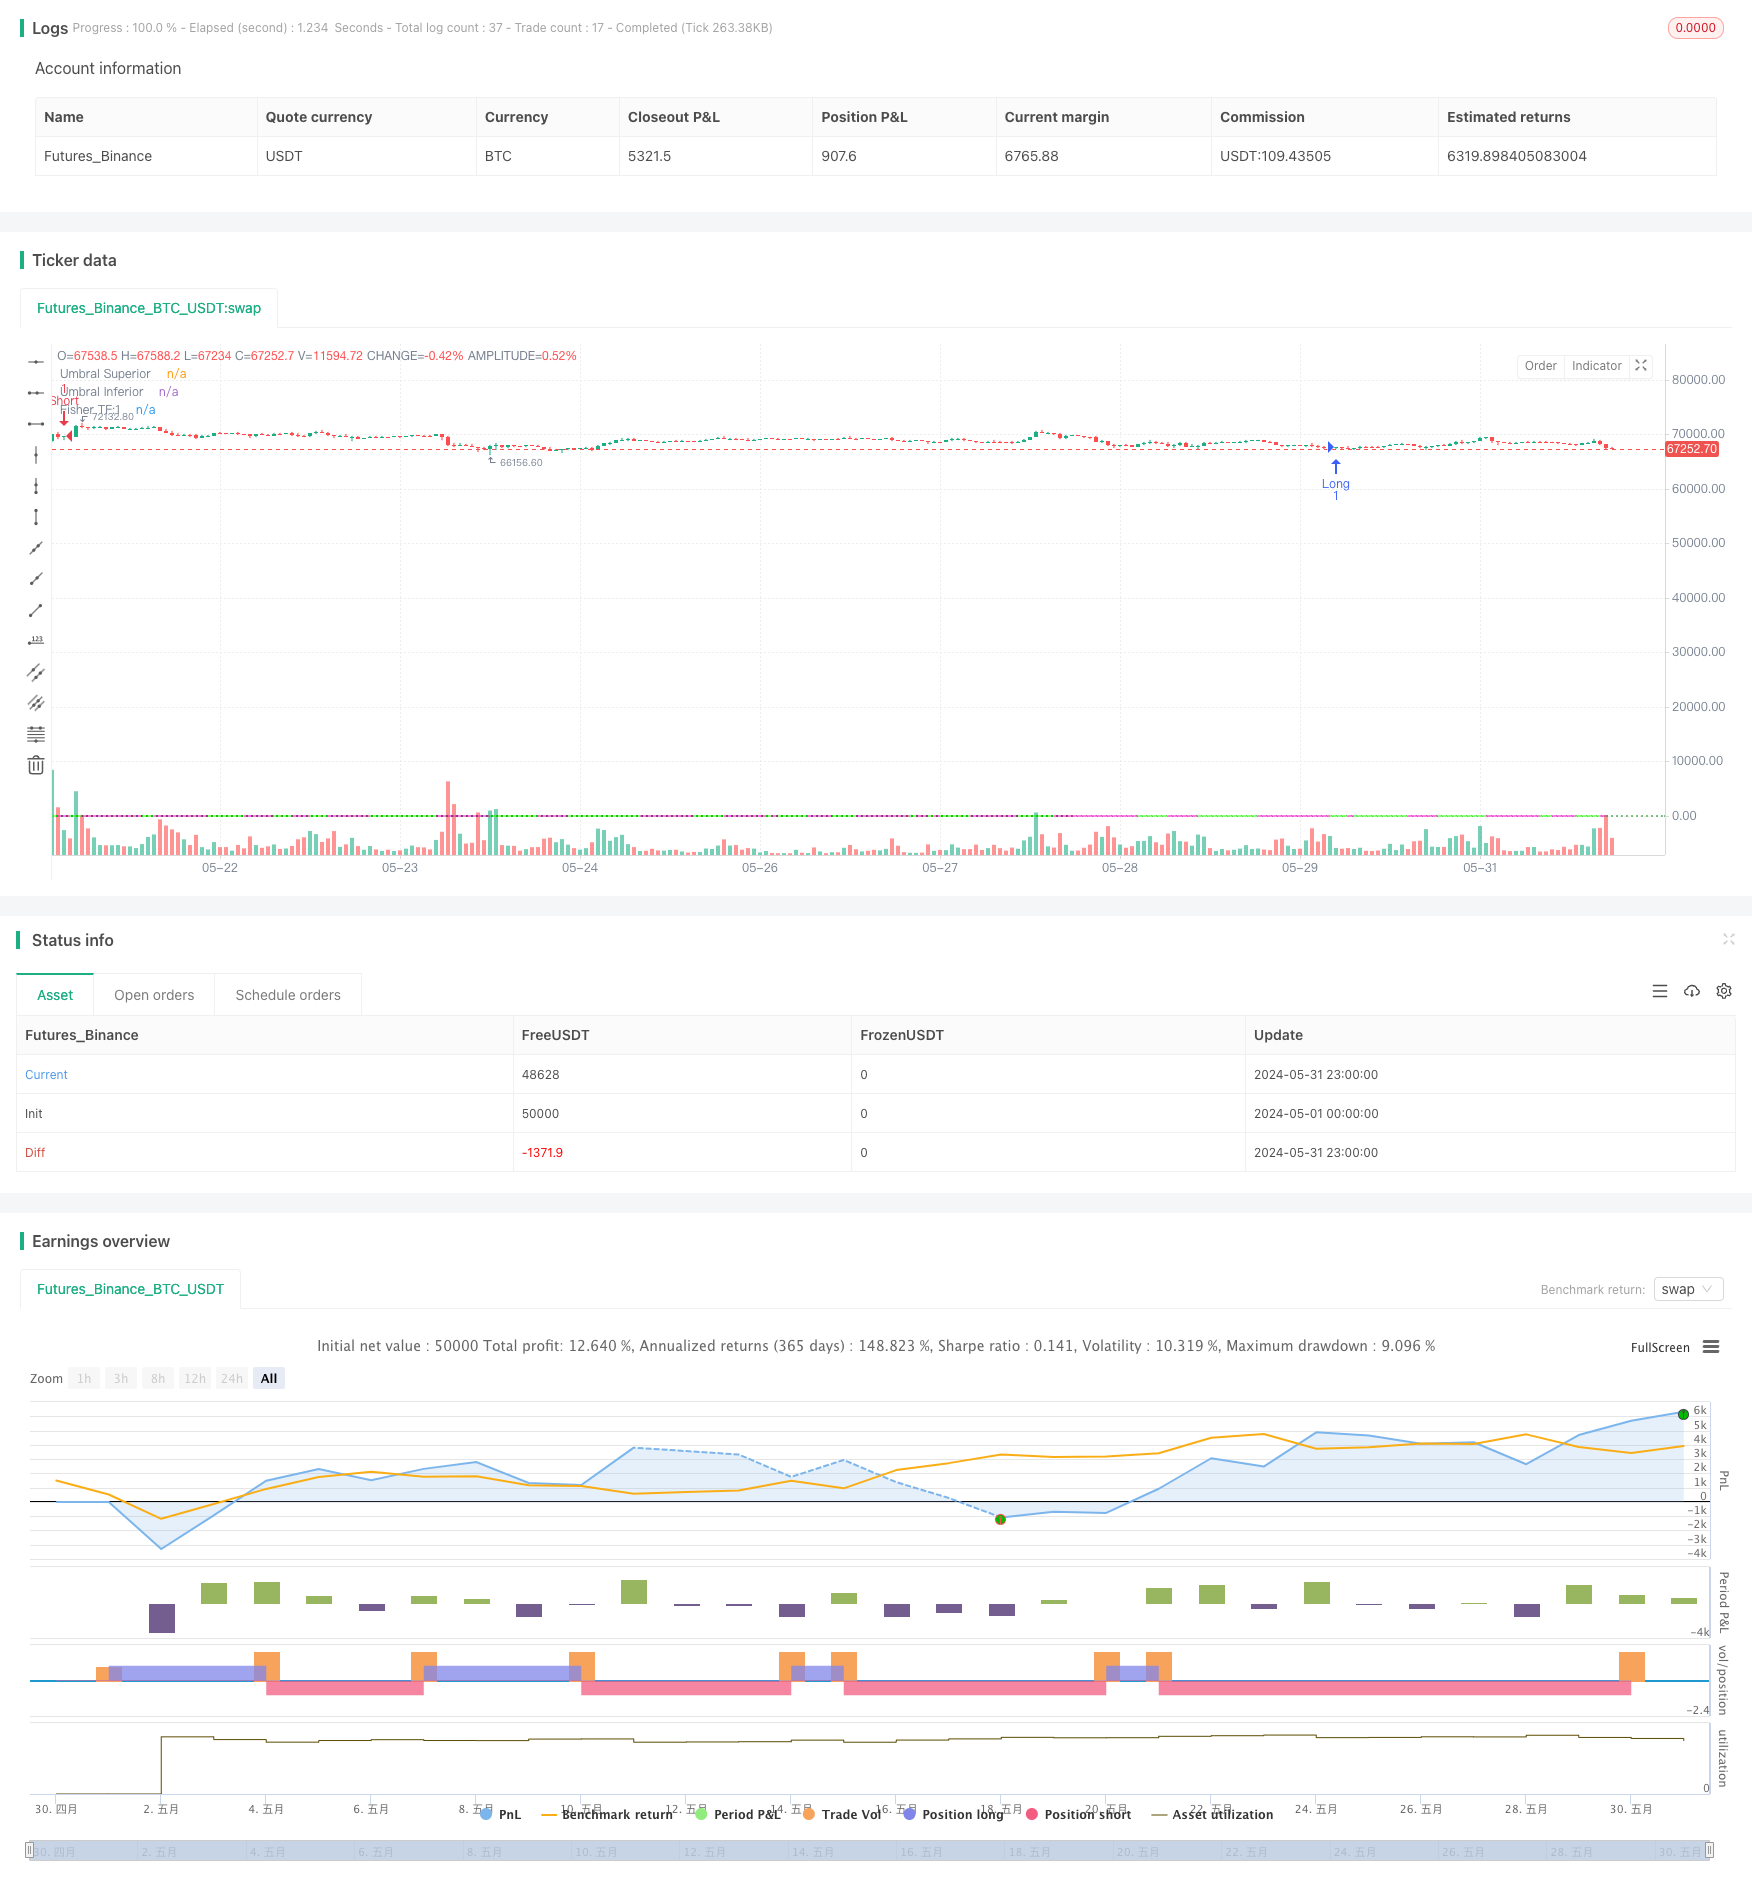
Fisher变换动态阈值趋势跟踪策略基于Fisher变换指标来识别价格趋势的变化。该策略使用Fisher变换将价格归一化到一个标准尺度,以便更容易地检测潜在的趋势反转点。通过动态调整阈值,该策略能够适应不同的市场条件,提高趋势识别的准确性。当Fisher变换值越过正负阈值时,策略会产生买卖信号,以跟踪市场趋势。
|
|
|
|
#### 策略原理
|
|
1. 计算Fisher变换值:根据历史最高价和最低价,对当前价格进行归一化处理,得到介于-0.999到0.999之间的Fisher变换值。
|
|
2. 动态阈值:根据Fisher变换值的历史波动情况,动态调整买卖信号的阈值,以适应不同的市场状态。
|
|
3. 趋势判断:通过比较当前Fisher变换值与前两个周期的值,判断价格趋势的变化。
|
|
4. 买卖信号:当Fisher变换值由下往上穿越负阈值时,产生买入信号;当Fisher变换值由上往下穿越正阈值时,产生卖出信号。
|
|
|
|
#### 优势分析
|
|
1. 动态阈值调整:根据市场波动情况自适应调整买卖阈值,提高趋势判断的准确性。
|
|
2. 趋势跟踪:通过Fisher变换指标的趋势判断,可以较好地捕捉市场趋势,实现趋势跟踪交易。
|
|
3. 减少价格噪音:Fisher变换将价格归一化处理,有助于减少价格噪音对趋势判断的影响。
|
|
4. 直观的图表展示:策略在图表上绘制Fisher变换曲线和阈值线,方便交易者直观地观察市场趋势和买卖信号。
|
|
|
|
#### 风险分析
|
|
1. 参数优化风险:策略的表现依赖于Fisher变换周期、动态阈值计算方式等参数的选择,不同参数可能导致不同的交易结果。
|
|
2. 趋势识别滞后:Fisher变换指标对价格趋势的判断存在一定的滞后性,可能错过部分趋势行情。
|
|
3. 震荡市中表现欠佳:在震荡市场环境下,频繁的趋势变化可能导致该策略产生较多的虚假信号,交易表现可能欠佳。
|
|
4. 极端行情风险:在极端行情下(如快速大幅变化),Fisher变换指标可能失效,导致策略作出错误的交易决策。
|
|
|
|
#### 优化方向
|
|
1. 参数优化:对Fisher变换周期、动态阈值计算方式等关键参数进行优化,提高策略在不同市场状态下的适应性。
|
|
2. 信号过滤:在趋势识别的基础上,引入其他技术指标或市场情绪指标,对交易信号进行二次确认,提高信号可靠性。
|
|
3. 止损止盈:设置合理的止损止盈规则,控制单次交易风险,提高策略的风险收益比。
|
|
4. 仓位管理:根据市场趋势强度、价格波动率等因素,动态调整仓位大小,降低持仓风险。
|
|
|
|
#### 总结
|
|
Fisher变换动态阈值趋势跟踪策略通过Fisher变换指标和动态阈值,识别价格趋势的变化,自适应不同的市场状态。该策略能够较好地捕捉市场趋势,实现趋势跟踪交易。策略的优势在于动态阈值调整、减少价格噪音干扰以及直观的图表展示。但同时也存在参数优化风险、趋势识别滞后、震荡市表现欠佳、极端行情风险等问题。通过参数优化、信号过滤、止损止盈、仓位管理等措施,可以进一步提升该策略的稳健性和盈利能力。
|
|
|
|
||
|
|
|
|
#### Overview
|
|
The Fisher Transform Dynamic Threshold Trend Following Strategy utilizes the Fisher Transform indicator to identify changes in price trends. The strategy uses the Fisher Transform to normalize prices to a standard scale, making it easier to detect potential trend reversal points. By dynamically adjusting thresholds, the strategy adapts to different market conditions and improves the accuracy of trend recognition. When the Fisher Transform value crosses positive or negative thresholds, the strategy generates buy or sell signals to follow market trends.
|
|
|
|
#### Strategy Principle
|
|
1. Calculate Fisher Transform value: Based on historical high and low prices, normalize the current price to obtain a Fisher Transform value between -0.999 and 0.999.
|
|
2. Dynamic threshold: Dynamically adjust the threshold for buy and sell signals based on the historical volatility of the Fisher Transform value to adapt to different market states.
|
|
3. Trend determination: Determine changes in price trends by comparing the current Fisher Transform value with the values from the previous two periods.
|
|
4. Buy and sell signals: Generate a buy signal when the Fisher Transform value crosses the negative threshold from below, and generate a sell signal when the Fisher Transform value crosses the positive threshold from above.
|
|
|
|
#### Advantage Analysis
|
|
1. Dynamic threshold adjustment: Adaptively adjust buy and sell thresholds based on market volatility to improve the accuracy of trend judgment.
|
|
2. Trend tracking: The Fisher Transform indicator's trend judgment enables effective capture of market trends and trend-following trading.
|
|
3. Reduced price noise: The Fisher Transform normalizes prices, helping to reduce the impact of price noise on trend judgment.
|
|
4. Intuitive chart display: The strategy plots the Fisher Transform curve and threshold lines on the chart, allowing traders to visually observe market trends and buy/sell signals.
|
|
|
|
#### Risk Analysis
|
|
1. Parameter optimization risk: The strategy's performance depends on the selection of parameters such as the Fisher Transform period and the dynamic threshold calculation method. Different parameters may lead to different trading results.
|
|
2. Trend recognition lag: The Fisher Transform indicator has a certain lag in judging price trends, which may miss some trend movements.
|
|
3. Poor performance in choppy markets: In choppy market conditions, frequent trend changes may cause the strategy to generate more false signals, leading to suboptimal trading performance.
|
|
4. Extreme market risk: In extreme market conditions (such as rapid and substantial changes), the Fisher Transform indicator may fail, causing the strategy to make incorrect trading decisions.
|
|
|
|
#### Optimization Direction
|
|
1. Parameter optimization: Optimize key parameters such as the Fisher Transform period and dynamic threshold calculation method to improve the strategy's adaptability to different market states.
|
|
2. Signal filtering: In addition to trend recognition, introduce other technical indicators or market sentiment indicators to confirm trading signals and improve signal reliability.
|
|
3. Stop-loss and take-profit: Set reasonable stop-loss and take-profit rules to control single-trade risk and improve the strategy's risk-reward ratio.
|
|
4. Position management: Dynamically adjust position sizes based on factors such as market trend strength and price volatility to reduce holding risk.
|
|
|
|
#### Summary
|
|
The Fisher Transform Dynamic Threshold Trend Following Strategy identifies changes in price trends using the Fisher Transform indicator and dynamic thresholds, adapting to different market states. The strategy effectively captures market trends and enables trend-following trading. Its advantages include dynamic threshold adjustment, reduced price noise interference, and intuitive chart display. However, it also faces challenges such as parameter optimization risk, trend recognition lag, poor performance in choppy markets, and extreme market risk. Through measures like parameter optimization, signal filtering, stop-loss and take-profit, and position management, the strategy's robustness and profitability can be further enhanced.
|
|
[/trans]
|
|
|
|
|
|
|
|
> Source (PineScript)
|
|
|
|
``` pinescript
|
|
/*backtest
|
|
start: 2024-05-01 00:00:00
|
|
end: 2024-05-31 23:59:59
|
|
period: 1h
|
|
basePeriod: 15m
|
|
exchanges: [{"eid":"Futures_Binance","currency":"BTC_USDT"}]
|
|
*/
|
|
|
|
//@version=5
|
|
strategy("Qiuboneminer - Fisher Transform", overlay=true)
|
|
|
|
// Parámetros
|
|
Len = input.int(10, minval=1)
|
|
mult1 = input.int(1, minval=1)
|
|
threshold = 2.6
|
|
|
|
// Función Fisher Transform
|
|
fish(Length, timeMultiplier) =>
|
|
var float nValue1 = na
|
|
var float nFish = na
|
|
xHL2 = hl2
|
|
xMaxH = ta.highest(xHL2, Length * timeMultiplier)
|
|
xMinL = ta.lowest(xHL2, Length * timeMultiplier)
|
|
nValue1 := 0.33 * 2 * ((xHL2 - xMinL) / (xMaxH - xMinL) - 0.5) + 0.67 * nz(nValue1[1])
|
|
nValue2 = if nValue1 > 0.99
|
|
0.999
|
|
else if nValue1 < -0.99
|
|
-0.999
|
|
else
|
|
nValue1
|
|
nFish := 0.5 * math.log((1 + nValue2) / (1 - nValue2)) + 0.5 * nz(nFish[1])
|
|
nFish
|
|
|
|
// Cálculo del Fisher Transform para mult1
|
|
Fisher1 = fish(Len, mult1)
|
|
|
|
// Condiciones de entrada y salida
|
|
longCondition = Fisher1 > nz(Fisher1[1]) and nz(Fisher1[1]) <= nz(Fisher1[2]) and Fisher1 < -threshold
|
|
shortCondition = Fisher1 < nz(Fisher1[1]) and nz(Fisher1[1]) >= nz(Fisher1[2]) and Fisher1 > threshold
|
|
|
|
// Estrategia de entrada
|
|
if (longCondition)
|
|
strategy.entry("Long", strategy.long)
|
|
if (shortCondition)
|
|
strategy.entry("Short", strategy.short)
|
|
|
|
// Ploteo del Fisher Transform
|
|
plot(Fisher1, color=(Fisher1 > nz(Fisher1[1]) ? color.rgb(34, 255, 0) : color.rgb(255, 0, 212)), title="Fisher TF:1")
|
|
|
|
// Ploteo de líneas de umbral
|
|
hline(threshold, "Umbral Superior", color=color.rgb(255, 0, 0), linestyle=hline.style_dotted)
|
|
hline(-threshold, "Umbral Inferior", color=#008704, linestyle=hline.style_dotted)
|
|
|
|
```
|
|
|
|
> Detail
|
|
|
|
https://www.fmz.com/strategy/454341
|
|
|
|
> Last Modified
|
|
|
|
2024-06-17 15:01:19
|