
148 lines
8.3 KiB
Markdown
148 lines
8.3 KiB
Markdown
|
|
> Name
|
|
|
|
EMA100与NUPL相对未实现利润量化交易策略-EMA100-and-NUPL-Relative-Unrealized-Profit-Quantitative-Trading-Strategy
|
|
|
|
> Author
|
|
|
|
ChaoZhang
|
|
|
|
> Strategy Description
|
|
|
|
|
|
[trans]
|
|
#### 概述
|
|
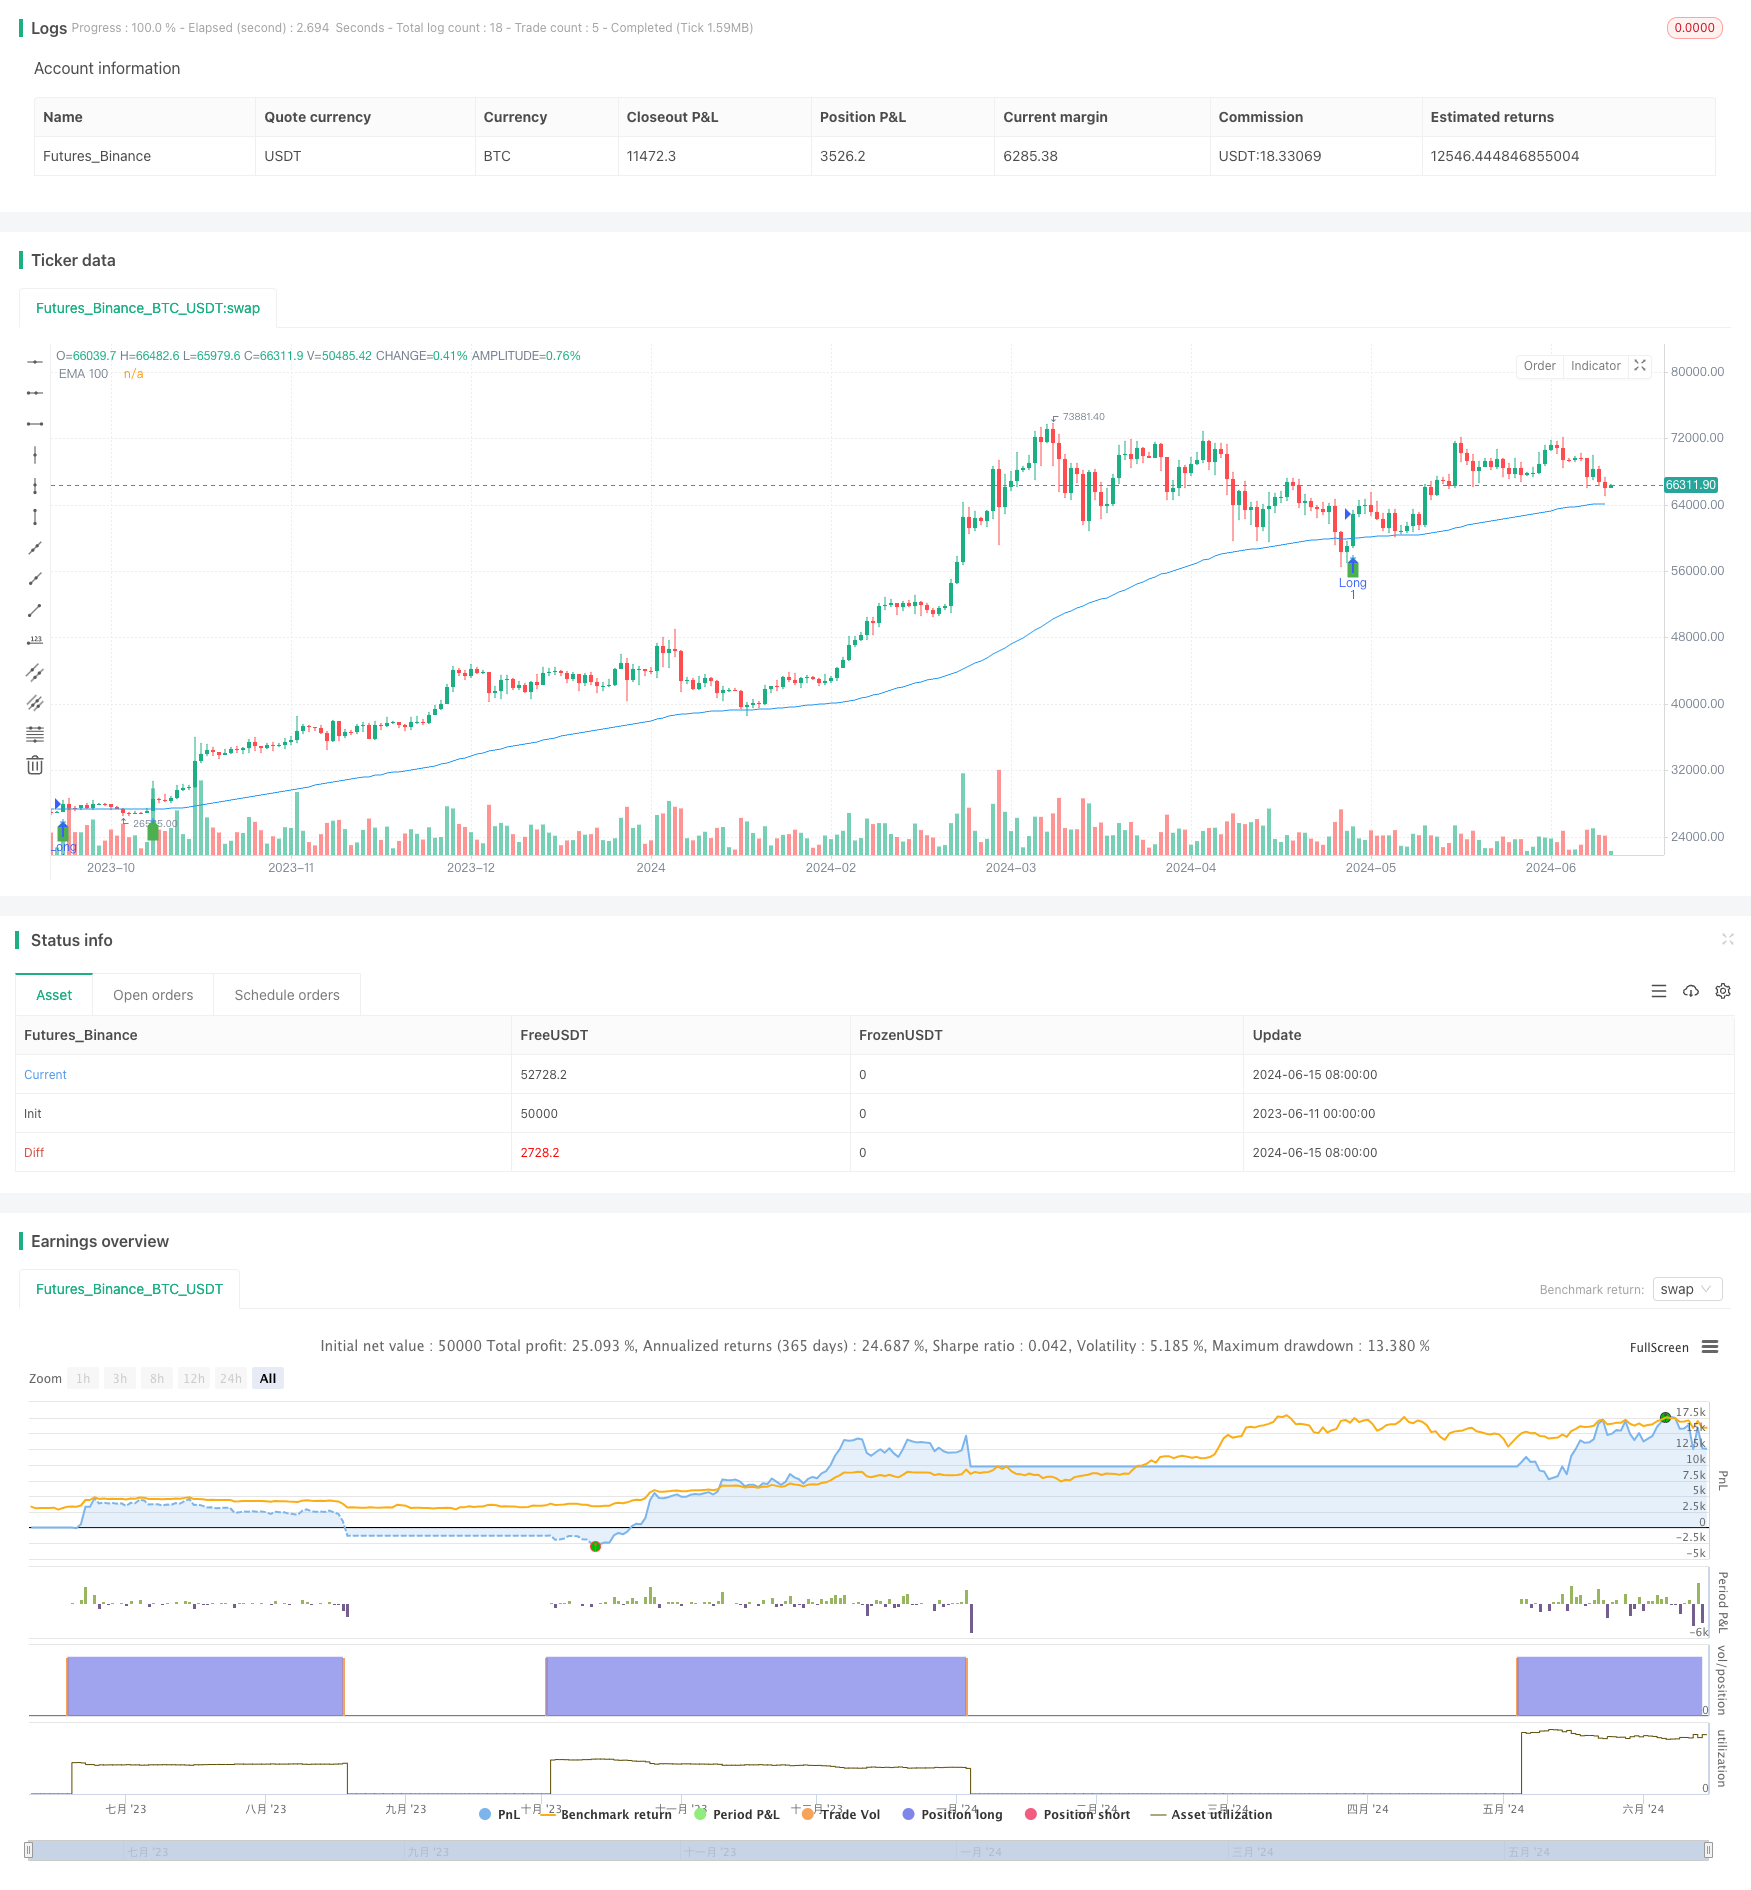
该交易策略基于100周期指数移动平均线(EMA100)、净未实现利润/亏损(NUPL)和相对未实现利润三个指标,通过判断价格与EMA100的交叉以及NUPL和相对未实现利润的正负来产生交易信号。当价格上穿EMA100且NUPL和相对未实现利润均为正时触发做多信号;当价格下穿EMA100且NUPL和相对未实现利润均为负时触发做空信号。该策略采用10%的固定仓位,并设置10%的止损。
|
|
|
|
#### 策略原理
|
|
1. 计算100周期EMA作为主要的趋势判断指标
|
|
2. 使用NUPL和相对未实现利润作为辅助指标,用于确认趋势的强度和可持续性
|
|
3. 在价格上穿/下穿EMA100的同时,NUPL和相对未实现利润同时为正/负时产生做多/做空信号
|
|
4. 采用10%的固定仓位,并设置10%的止损,控制风险
|
|
5. 当持有多头仓位时,如果价格跌破止损价格,则平掉多头仓位;当持有空头仓位时,如果价格涨破止损价格,则平掉空头仓位
|
|
|
|
#### 优势分析
|
|
1. 简单易懂:该策略逻辑清晰,使用了常见的技术指标,易于理解和实现
|
|
2. 趋势跟踪:通过EMA100捕捉主要趋势,适合在趋势市场中使用
|
|
3. 风险控制:设置固定仓位和止损,可以有效控制风险
|
|
4. 适应性强:该策略可以适用于不同的市场和交易标的
|
|
|
|
#### 风险分析
|
|
1. 假信号:在震荡市场中,价格与EMA100频繁交叉可能产生较多假信号,导致亏损
|
|
2. 滞后性:EMA作为滞后指标,可能在趋势转折时反应较慢,错失最佳入场时机
|
|
3. 参数优化:策略参数(如EMA周期、仓位大小、止损比例)需要根据不同市场进行优化,不恰当的参数可能导致策略效果不佳
|
|
|
|
#### 优化方向
|
|
1. 参数优化:对EMA周期、仓位大小、止损比例等参数进行优化,提高策略表现
|
|
2. 过滤信号:加入其他技术指标或市场情绪指标,过滤假信号
|
|
3. 动态仓位管理:根据市场波动率、账户盈亏等因素动态调整仓位,提高收益并控制风险
|
|
4. 多空组合:同时持有多头和空头仓位,对冲市场风险,提高策略稳定性
|
|
|
|
#### 总结
|
|
该交易策略通过EMA100、NUPL和相对未实现利润三个指标产生交易信号,具有逻辑清晰、风险可控、适应性强等优点。同时也存在假信号、滞后性和参数优化等风险。未来可以通过参数优化、信号过滤、动态仓位管理和多空组合等方式对策略进行优化和提升。
|
|
|
|
||
|
|
|
|
#### Overview
|
|
This trading strategy is based on three indicators: the 100-period Exponential Moving Average (EMA100), Net Unrealized Profit/Loss (NUPL), and Relative Unrealized Profit. It generates trading signals by determining the crossover of price with EMA100 and the positivity or negativity of NUPL and Relative Unrealized Profit. A long signal is triggered when the price crosses above EMA100 and both NUPL and Relative Unrealized Profit are positive. A short signal is triggered when the price crosses below EMA100 and both NUPL and Relative Unrealized Profit are negative. The strategy uses a fixed position size of 10% and sets a stop loss of 10%.
|
|
|
|
#### Strategy Principles
|
|
1. Calculate the 100-period EMA as the main trend indicator
|
|
2. Use NUPL and Relative Unrealized Profit as auxiliary indicators to confirm trend strength and sustainability
|
|
3. Generate long/short signals when the price crosses above/below EMA100 while NUPL and Relative Unrealized Profit are simultaneously positive/negative
|
|
4. Adopt a fixed position size of 10% and set a stop loss of 10% to control risk
|
|
5. When holding a long position, if the price falls below the stop loss price, close the long position; when holding a short position, if the price rises above the stop loss price, close the short position
|
|
|
|
#### Advantage Analysis
|
|
1. Simple and easy to understand: The strategy logic is clear and uses common technical indicators, making it easy to understand and implement
|
|
2. Trend following: By capturing the main trend using EMA100, it is suitable for use in trending markets
|
|
3. Risk control: Setting fixed position sizes and stop losses can effectively control risk
|
|
4. Adaptability: The strategy can be applied to various markets and trading instruments
|
|
|
|
#### Risk Analysis
|
|
1. False signals: In choppy markets, frequent crossovers between price and EMA100 may generate more false signals, leading to losses
|
|
2. Lag: As a lagging indicator, EMA may react slowly at trend reversals, missing the best entry opportunities
|
|
3. Parameter optimization: Strategy parameters (such as EMA period, position size, stop loss ratio) need to be optimized for different markets, and inappropriate parameters may result in poor strategy performance
|
|
|
|
#### Optimization Directions
|
|
1. Parameter optimization: Optimize parameters such as EMA period, position size, and stop loss ratio to improve strategy performance
|
|
2. Signal filtering: Add other technical indicators or market sentiment indicators to filter false signals
|
|
3. Dynamic position management: Dynamically adjust positions based on market volatility, account profit/loss, and other factors to increase returns and control risk
|
|
4. Long-short combination: Hold both long and short positions simultaneously to hedge market risk and improve strategy stability
|
|
|
|
#### Summary
|
|
This trading strategy generates trading signals through three indicators: EMA100, NUPL, and Relative Unrealized Profit. It has advantages such as clear logic, controllable risk, and strong adaptability. At the same time, it also has risks such as false signals, lag, and parameter optimization. In the future, the strategy can be optimized and improved through parameter optimization, signal filtering, dynamic position management, and long-short combinations.
|
|
[/trans]
|
|
|
|
|
|
|
|
> Source (PineScript)
|
|
|
|
``` pinescript
|
|
/*backtest
|
|
start: 2023-06-11 00:00:00
|
|
end: 2024-06-16 00:00:00
|
|
period: 1d
|
|
basePeriod: 1h
|
|
exchanges: [{"eid":"Futures_Binance","currency":"BTC_USDT"}]
|
|
*/
|
|
|
|
//@version=5
|
|
strategy("Scalping Strategy with EMA 100, NUPL, and Relative Unrealized Profit", overlay=true)
|
|
|
|
// Input for EMA period
|
|
emaPeriod = input.int(100, title="EMA Period", minval=1)
|
|
ema100 = ta.ema(close, emaPeriod)
|
|
plot(ema100, color=color.blue, title="EMA 100")
|
|
|
|
// Placeholder function for NUPL (Net Unrealized Profit/Loss)
|
|
// Replace this with actual NUPL data or calculation
|
|
NUPL = close * 0.0001 // Dummy calculation
|
|
|
|
// Placeholder function for relative unrealized profit
|
|
// Replace this with actual relative unrealized profit data or calculation
|
|
relativeUnrealizedProfit = close * 0.0001 // Dummy calculation
|
|
|
|
// Define conditions for long and short entries
|
|
longCondition = ta.crossover(close, ema100) and NUPL > 0 and relativeUnrealizedProfit > 0
|
|
shortCondition = ta.crossunder(close, ema100) and NUPL < 0 and relativeUnrealizedProfit < 0
|
|
|
|
// Plot buy and sell signals on the chart
|
|
plotshape(series=longCondition, location=location.belowbar, color=color.green, style=shape.labelup, title="Buy Signal")
|
|
plotshape(series=shortCondition, location=location.abovebar, color=color.red, style=shape.labeldown, title="Sell Signal")
|
|
|
|
// Calculate stop loss levels
|
|
longStopLoss = close * 0.90
|
|
shortStopLoss = close * 1.10
|
|
|
|
// Strategy entry and exit rules
|
|
if (longCondition)
|
|
strategy.entry("Long", strategy.long, stop=longStopLoss)
|
|
|
|
if (shortCondition)
|
|
strategy.entry("Short", strategy.short, stop=shortStopLoss)
|
|
|
|
// Set stop loss levels for active positions
|
|
if (strategy.position_size > 0)
|
|
strategy.exit("Exit Long", "Long", stop=longStopLoss)
|
|
if (strategy.position_size < 0)
|
|
strategy.exit("Exit Short", "Short", stop=shortStopLoss)
|
|
|
|
// Alerts for long and short entries
|
|
alertcondition(longCondition, title="Long Entry Alert", message="Long entry signal based on EMA 100, NUPL, and relative unrealized profit")
|
|
alertcondition(shortCondition, title="Short Entry Alert", message="Short entry signal based on EMA 100, NUPL, and relative unrealized profit")
|
|
|
|
// Visualize the entry conditions
|
|
plotshape(series=longCondition, location=location.belowbar, color=color.blue, style=shape.cross, title="Long Condition")
|
|
plotshape(series=shortCondition, location=location.abovebar, color=color.red, style=shape.cross, title="Short Condition")
|
|
|
|
```
|
|
|
|
> Detail
|
|
|
|
https://www.fmz.com/strategy/454336
|
|
|
|
> Last Modified
|
|
|
|
2024-06-17 14:55:13
|