
296 lines
16 KiB
Markdown
296 lines
16 KiB
Markdown
|
|
> Name
|
|
|
|
EMA-SMA多指标综合趋势跟踪策略-EMA-SMA-Multi-Indicator-Comprehensive-Trend-Following-Strategy
|
|
|
|
> Author
|
|
|
|
ChaoZhang
|
|
|
|
> Strategy Description
|
|
|
|
|
|
|
|
[trans]
|
|
|
|
#### 概述
|
|
|
|
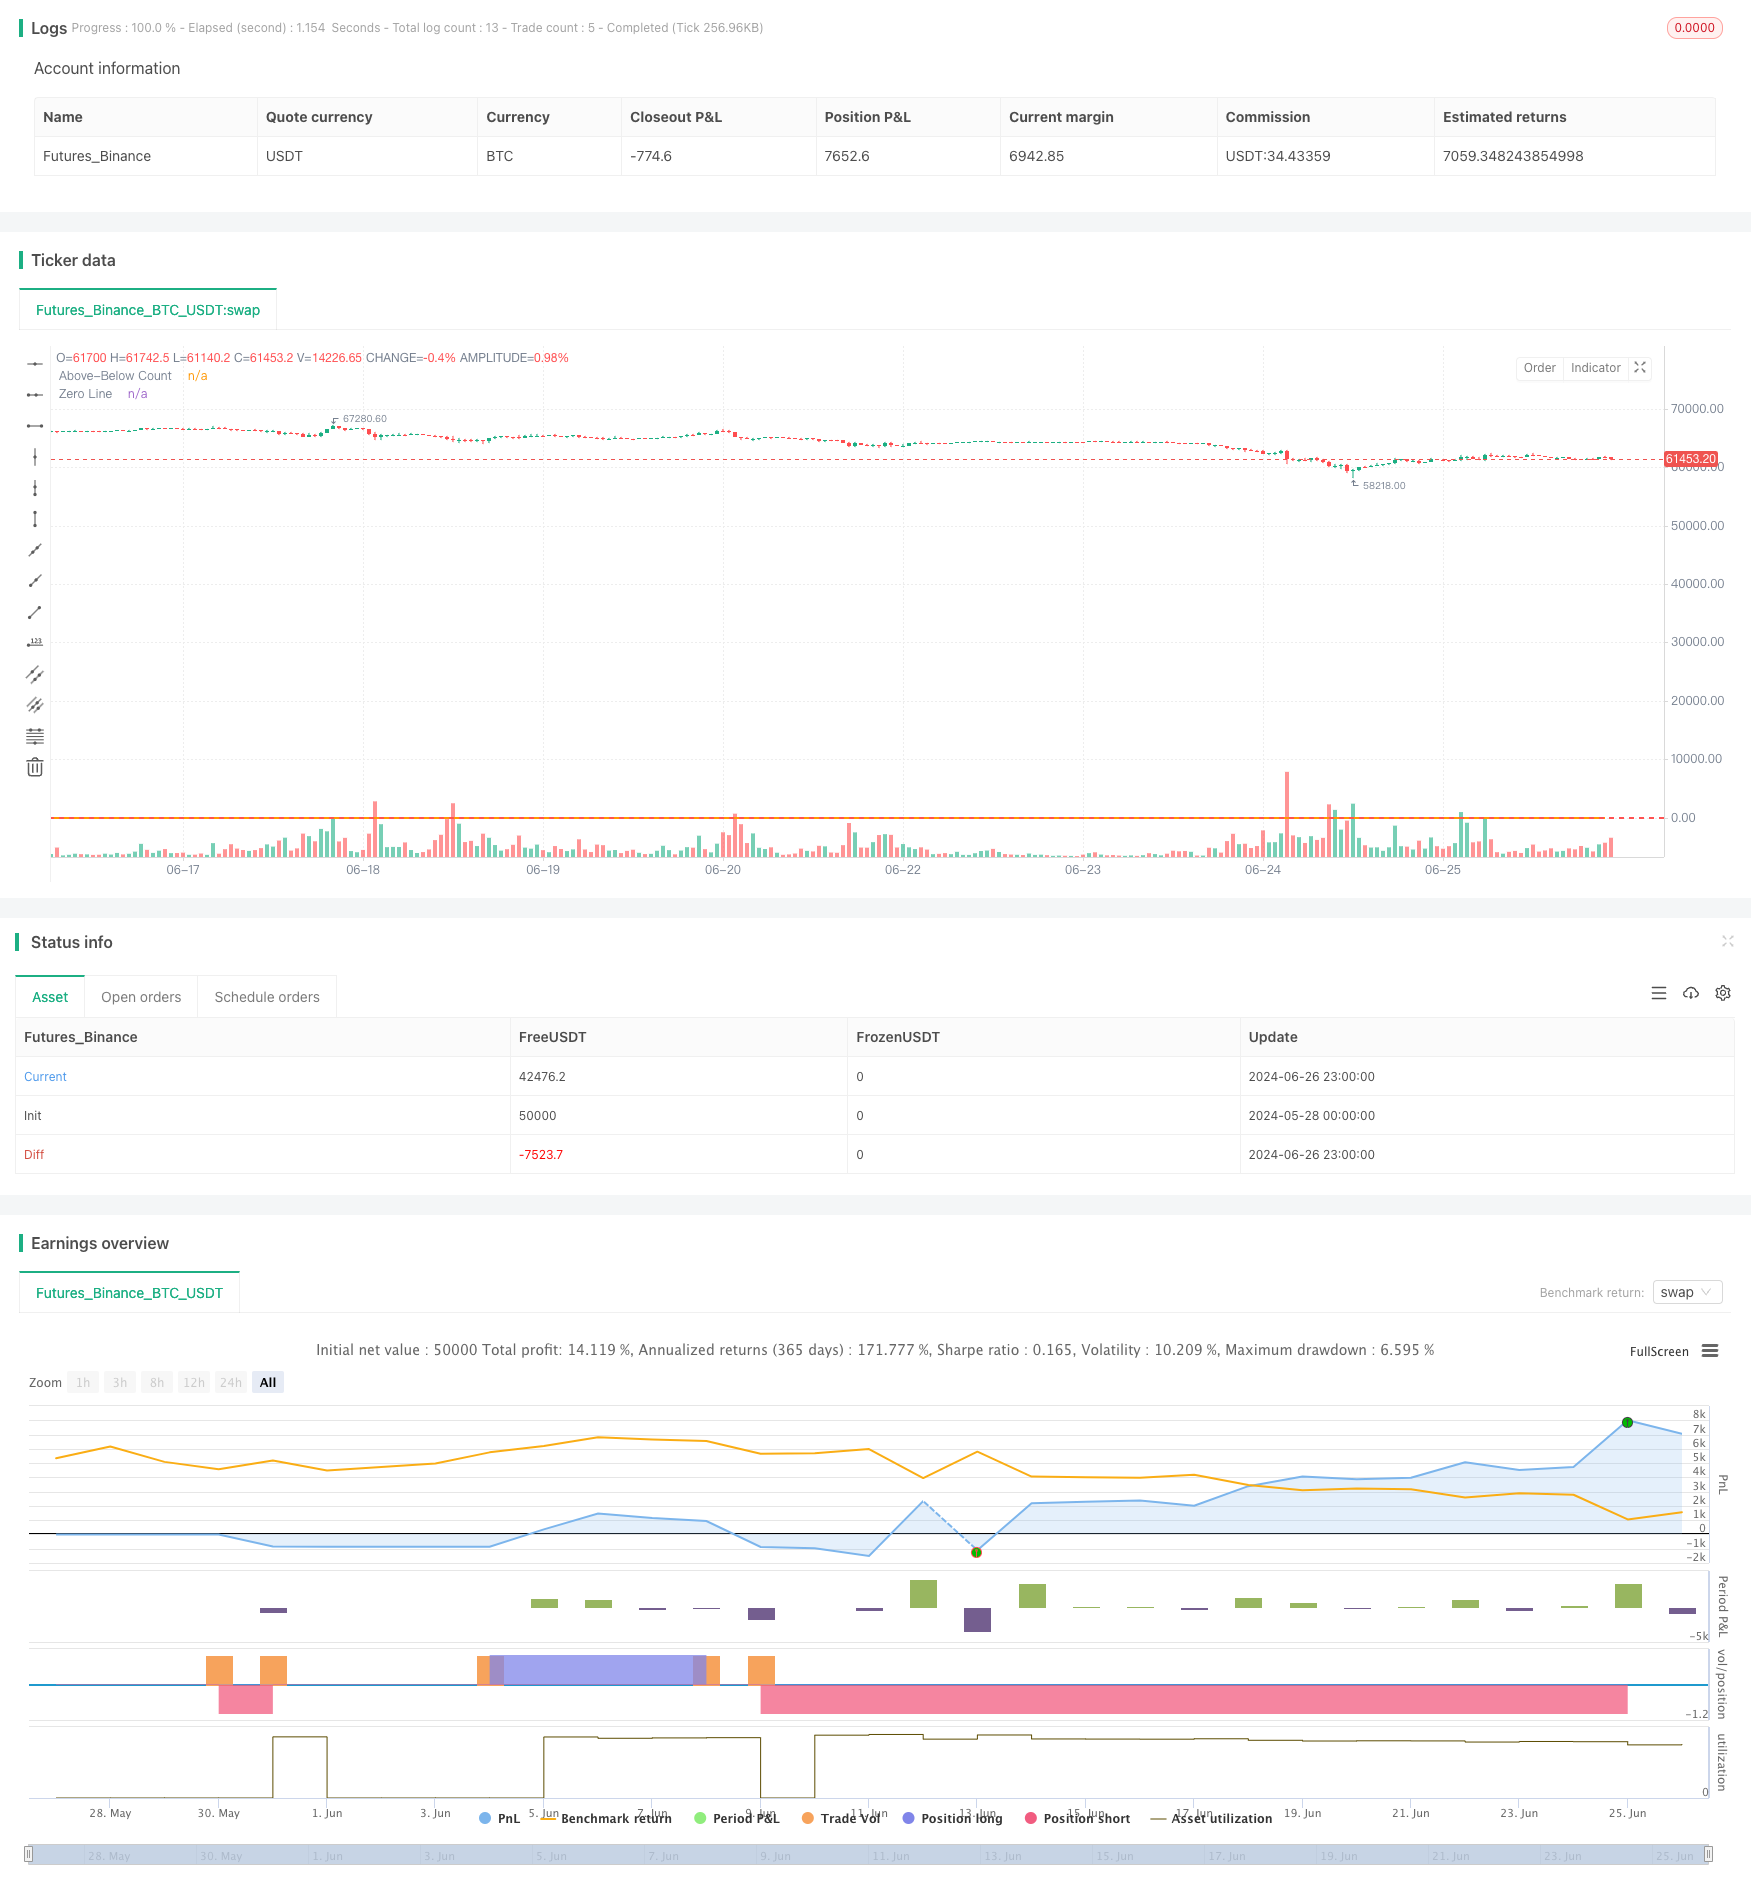
这个策略是一个基于多个技术指标的综合趋势跟踪系统,主要用于1小时时间周期。它结合了移动平均线、动量指标和震荡指标,通过计算多个指标相对于当前价格的位置来判断市场趋势。策略的核心思想是,当大多数指标显示看涨信号时进行买入,当大多数指标显示看跌信号时进行卖出。这种方法旨在捕捉强劲的市场趋势,同时通过多指标综合来降低假信号的风险。
|
|
|
|
#### 策略原理
|
|
|
|
该策略的核心是计算多个技术指标相对于当前价格的位置,并根据这些指标的综合信号来做出交易决策。具体来说:
|
|
|
|
1. 移动平均线:计算了6个不同周期(10、20、30、50、100、200)的EMA和SMA,判断它们是否位于收盘价之上或之下。
|
|
|
|
2. RSI:使用14周期RSI,当RSI大于50视为看涨信号,小于50视为看跌信号。
|
|
|
|
3. 随机指标:使用14周期随机指标,K线大于80视为看涨信号,小于20视为看跌信号。
|
|
|
|
4. CCI:使用20周期CCI,大于100视为看涨信号,小于-100视为看跌信号。
|
|
|
|
5. 动量指标:计算10周期动量,正值视为看涨信号,负值视为看跌信号。
|
|
|
|
6. MACD:使用12-26-9参数的MACD,柱状图为正视为看涨信号,为负视为看跌信号。
|
|
|
|
策略计算了所有看涨信号的数量(above_count)和所有看跌信号的数量(below_count),然后计算它们的差值(below_count - above_count)。这个差值被用作主要的交易信号:
|
|
|
|
- 当差值大于设定的entry_long阈值时,开仓做多。
|
|
- 当差值小于设定的entry_short阈值时,开仓做空。
|
|
- 当差值小于close_long阈值时,平掉多头仓位。
|
|
- 当差值大于close_short阈值时,平掉空头仓位。
|
|
|
|
这种方法允许策略根据多个指标的综合信号来判断市场趋势的强度和方向,从而做出更加稳健的交易决策。
|
|
|
|
#### 策略优势
|
|
|
|
1. 多指标综合分析:通过结合多个技术指标,策略能够更全面地评估市场趋势,减少单一指标可能带来的假信号风险。
|
|
|
|
2. 适应性强:策略使用了不同类型的指标(趋势跟踪、动量和震荡指标),使其能够在不同的市场环境中保持有效性。
|
|
|
|
3. 灵活的参数设置:用户可以根据自己的风险偏好和市场观点调整入场和出场阈值,使策略更加个性化。
|
|
|
|
4. 趋势跟踪能力:通过综合多个指标的信号,策略有潜力捕捉到强劲的市场趋势,从而获得可观的收益。
|
|
|
|
5. 风险管理:策略包含了平仓逻辑,可以在市场趋势反转时及时退出,有助于控制风险。
|
|
|
|
6. 可视化:策略将above_count和below_count的差值绘制在图表上,使交易者能够直观地看到市场趋势的强度变化。
|
|
|
|
#### 策略风险
|
|
|
|
1. 滞后性:由于使用了多个移动平均线和其他lagging指标,策略可能在趋势反转时反应较慢,导致入场或出场延迟。
|
|
|
|
2. 过度交易:在震荡市场中,指标可能频繁给出相互矛盾的信号,导致过度交易和增加交易成本。
|
|
|
|
3. 假突破风险:在横盘市场中,指标可能误判小幅波动为趋势开始,导致错误的交易信号。
|
|
|
|
4. 参数敏感性:策略的性能可能对入场和出场阈值的设置非常敏感,不当的参数设置可能导致策略表现不佳。
|
|
|
|
5. 缺乏止损机制:当前策略没有明确的止损机制,在极端市场条件下可能面临较大损失。
|
|
|
|
6. 忽视基本面因素:策略完全基于技术指标,没有考虑可能影响市场的基本面因素。
|
|
|
|
#### 策略优化方向
|
|
|
|
1. 引入自适应参数:可以考虑使用自适应机制来动态调整入场和出场阈值,以适应不同的市场环境。这可以通过分析历史波动率或者使用机器学习算法来实现。
|
|
|
|
2. 加入止损机制:引入基于ATR或固定百分比的止损机制,以限制单次交易的最大损失,提高风险管理能力。
|
|
|
|
3. 优化指标组合:可以尝试使用特征选择算法来确定最有效的指标组合,去除冗余或效果不佳的指标,提高策略的效率。
|
|
|
|
4. 引入时间过滤:考虑加入时间过滤器,避免在市场波动较小的时间段进行交易,如可以只在市场开盘后的前几个小时内交易。
|
|
|
|
5. 整合市场情绪指标:引入如VIX指数或交易量等市场情绪指标,以更好地判断市场环境,提高策略的适应性。
|
|
|
|
6. 优化移动平均线周期:可以尝试使用不同的移动平均线周期组合,或者使用自适应移动平均线,以提高策略对不同时间框架的适应能力。
|
|
|
|
7. 加入趋势强度过滤:引入ADX等趋势强度指标,只在趋势足够强时才进行交易,以减少震荡市场中的假信号。
|
|
|
|
8. 实现部分仓位管理:可以根据信号强度来调整仓位大小,而不是简单的全仓进出,这样可以更好地管理风险并优化资金利用。
|
|
|
|
#### 总结
|
|
|
|
EMA/SMA多指标综合趋势跟踪策略是一个基于多个技术指标的综合交易系统,旨在通过分析多个指标的综合信号来捕捉市场趋势。该策略的主要优势在于其全面的市场分析能力和灵活的参数设置,使其能够适应不同的市场环境。然而,策略也存在一些潜在的风险,如滞后性和过度交易的可能性。
|
|
|
|
通过实施建议的优化方向,如引入自适应参数、加强风险管理机制、优化指标组合等,可以进一步提高策略的稳健性和盈利能力。最终,这个策略为交易者提供了一个全面的市场分析工具,但其成功应用仍然需要交易者的经验和持续的优化努力。
|
|
|
|
||
|
|
|
|
#### Overview
|
|
|
|
This strategy is a comprehensive trend following system based on multiple technical indicators, primarily designed for the 1-hour timeframe. It combines moving averages, momentum indicators, and oscillators to assess market trends by calculating the position of multiple indicators relative to the current price. The core idea of the strategy is to buy when most indicators show bullish signals and sell when most indicators show bearish signals. This approach aims to capture strong market trends while reducing the risk of false signals through the integration of multiple indicators.
|
|
|
|
#### Strategy Principles
|
|
|
|
The core of this strategy is to calculate the position of multiple technical indicators relative to the current price and make trading decisions based on the combined signals of these indicators. Specifically:
|
|
|
|
1. Moving Averages: Calculates 6 different periods (10, 20, 30, 50, 100, 200) of EMA and SMA, determining whether they are above or below the closing price.
|
|
|
|
2. RSI: Uses 14-period RSI, considering RSI > 50 as a bullish signal and RSI < 50 as a bearish signal.
|
|
|
|
3. Stochastic Oscillator: Uses 14-period stochastic, with K line > 80 considered bullish and < 20 considered bearish.
|
|
|
|
4. CCI: Uses 20-period CCI, with values > 100 considered bullish and < -100 considered bearish.
|
|
|
|
5. Momentum: Calculates 10-period momentum, with positive values considered bullish and negative values bearish.
|
|
|
|
6. MACD: Uses 12-26-9 parameter MACD, with positive histogram considered bullish and negative histogram bearish.
|
|
|
|
The strategy calculates the number of all bullish signals (above_count) and all bearish signals (below_count), then computes their difference (below_count - above_count). This difference is used as the main trading signal:
|
|
|
|
- When the difference is greater than the set entry_long threshold, open a long position.
|
|
- When the difference is less than the set entry_short threshold, open a short position.
|
|
- When the difference is less than the close_long threshold, close the long position.
|
|
- When the difference is greater than the close_short threshold, close the short position.
|
|
|
|
This method allows the strategy to judge the strength and direction of market trends based on the combined signals of multiple indicators, thus making more robust trading decisions.
|
|
|
|
#### Strategy Advantages
|
|
|
|
1. Multi-indicator comprehensive analysis: By combining multiple technical indicators, the strategy can more comprehensively evaluate market trends, reducing the risk of false signals that might come from a single indicator.
|
|
|
|
2. High adaptability: The strategy uses different types of indicators (trend following, momentum, and oscillators), enabling it to maintain effectiveness in various market environments.
|
|
|
|
3. Flexible parameter settings: Users can adjust entry and exit thresholds according to their risk preferences and market views, making the strategy more personalized.
|
|
|
|
4. Trend following capability: By synthesizing signals from multiple indicators, the strategy has the potential to capture strong market trends, thus obtaining considerable profits.
|
|
|
|
5. Risk management: The strategy includes logic for closing positions, which can help exit trades in a timely manner when market trends reverse, aiding in risk control.
|
|
|
|
6. Visualization: The strategy plots the difference between above_count and below_count on the chart, allowing traders to visually observe changes in market trend strength.
|
|
|
|
#### Strategy Risks
|
|
|
|
1. Lag: Due to the use of multiple moving averages and other lagging indicators, the strategy may react slowly to trend reversals, leading to delayed entries or exits.
|
|
|
|
2. Overtrading: In oscillating markets, indicators may frequently give contradictory signals, leading to excessive trading and increased transaction costs.
|
|
|
|
3. False breakout risk: In sideways markets, indicators may misinterpret small fluctuations as the beginning of trends, resulting in incorrect trading signals.
|
|
|
|
4. Parameter sensitivity: The strategy's performance may be very sensitive to the setting of entry and exit thresholds. Improper parameter settings may lead to poor strategy performance.
|
|
|
|
5. Lack of stop-loss mechanism: The current strategy does not have a clear stop-loss mechanism, which may face significant losses under extreme market conditions.
|
|
|
|
6. Ignoring fundamental factors: The strategy is entirely based on technical indicators and does not consider fundamental factors that may affect the market.
|
|
|
|
#### Strategy Optimization Directions
|
|
|
|
1. Introduce adaptive parameters: Consider using adaptive mechanisms to dynamically adjust entry and exit thresholds to adapt to different market environments. This can be achieved by analyzing historical volatility or using machine learning algorithms.
|
|
|
|
2. Add stop-loss mechanism: Introduce stop-loss mechanisms based on ATR or fixed percentages to limit the maximum loss of a single trade and improve risk management capabilities.
|
|
|
|
3. Optimize indicator combination: Try using feature selection algorithms to determine the most effective combination of indicators, removing redundant or underperforming indicators to improve strategy efficiency.
|
|
|
|
4. Introduce time filters: Consider adding time filters to avoid trading during periods of low market volatility, such as only trading in the first few hours after market opening.
|
|
|
|
5. Integrate market sentiment indicators: Introduce market sentiment indicators such as the VIX index or trading volume to better judge market environments and improve strategy adaptability.
|
|
|
|
6. Optimize moving average periods: Experiment with different combinations of moving average periods or use adaptive moving averages to improve the strategy's adaptability to different time frames.
|
|
|
|
7. Add trend strength filtering: Introduce trend strength indicators like ADX, only trading when the trend is strong enough to reduce false signals in oscillating markets.
|
|
|
|
8. Implement partial position management: Adjust position size based on signal strength instead of simple all-in-all-out trading. This can better manage risk and optimize capital utilization.
|
|
|
|
#### Summary
|
|
|
|
The EMA/SMA Multi-Indicator Comprehensive Trend Following Strategy is an integrated trading system based on multiple technical indicators, aiming to capture market trends by analyzing combined signals from multiple indicators. The main advantages of this strategy lie in its comprehensive market analysis capability and flexible parameter settings, allowing it to adapt to different market environments. However, the strategy also has some potential risks, such as lag and the possibility of overtrading.
|
|
|
|
By implementing the suggested optimization directions, such as introducing adaptive parameters, strengthening risk management mechanisms, and optimizing indicator combinations, the robustness and profitability of the strategy can be further improved. Ultimately, this strategy provides traders with a comprehensive market analysis tool, but its successful application still requires the trader's experience and continuous optimization efforts.
|
|
|
|
[/trans]
|
|
|
|
|
|
|
|
> Source (PineScript)
|
|
|
|
``` pinescript
|
|
/*backtest
|
|
start: 2024-05-28 00:00:00
|
|
end: 2024-06-27 00:00:00
|
|
period: 1h
|
|
basePeriod: 15m
|
|
exchanges: [{"eid":"Futures_Binance","currency":"BTC_USDT"}]
|
|
*/
|
|
|
|
//@version=5
|
|
strategy("EMA/SMA Above-Below Close with Multiple Indicators", overlay=true)
|
|
|
|
// EMA and SMA calculations
|
|
ema10 = ta.ema(close, 10)
|
|
sma10 = ta.sma(close, 10)
|
|
|
|
ema20 = ta.ema(close, 20)
|
|
sma20 = ta.sma(close, 20)
|
|
|
|
ema30 = ta.ema(close, 30)
|
|
sma30 = ta.sma(close, 30)
|
|
|
|
ema50 = ta.ema(close, 50)
|
|
sma50 = ta.sma(close, 50)
|
|
|
|
ema100 = ta.ema(close, 100)
|
|
sma100 = ta.sma(close, 100)
|
|
|
|
ema200 = ta.ema(close, 200)
|
|
sma200 = ta.sma(close, 200)
|
|
|
|
|
|
|
|
|
|
|
|
// Indicators calculations
|
|
rsi = ta.rsi(close, 14)
|
|
stochK = ta.stoch(close, high, low, 14)
|
|
stochD = ta.sma(stochK, 3)
|
|
cci = ta.cci(close, 20)
|
|
momentum = ta.mom(close, 10)
|
|
[macdLine, signalLine, _] = ta.macd(close, 12, 26, 9)
|
|
macdHist = macdLine - signalLine
|
|
bullPower = high - ta.ema(close, 13)
|
|
bearPower = low - ta.ema(close, 13)
|
|
|
|
|
|
|
|
// Calculate the number of plots above and below close
|
|
above_count = (ema10 > close ? 1 : 0) + (sma10 > close ? 1 : 0) +
|
|
(ema20 > close ? 1 : 0) + (sma20 > close ? 1 : 0) +
|
|
(ema30 > close ? 1 : 0) + (sma30 > close ? 1 : 0) +
|
|
(ema50 > close ? 1 : 0) + (sma50 > close ? 1 : 0) +
|
|
(ema100 > close ? 1 : 0) + (sma100 > close ? 1 : 0) +
|
|
(ema200 > close ? 1 : 0) + (sma200 > close ? 1 : 0) +
|
|
(rsi > 50 ? 1 : 0) + (stochK > 80 ? 1 : 0) + (cci > 100 ? 1 : 0) +
|
|
// (adx > 25 and close > open ? 1 : 0) + (ao > 0 ? 1 : 0) +
|
|
(momentum > 0 ? 1 : 0) + (macdHist > 0 ? 1 : 0)
|
|
// (stochRsi > 0.8 ? 1 : 0) + (willr > -20 ? 1 : 0) +
|
|
// (bullPower > 0 ? 1 : 0) + (uo > 50 ? 1 : 0)
|
|
|
|
below_count = (ema10 < close ? 1 : 0) + (sma10 < close ? 1 : 0) +
|
|
(ema20 < close ? 1 : 0) + (sma20 < close ? 1 : 0) +
|
|
(ema30 < close ? 1 : 0) + (sma30 < close ? 1 : 0) +
|
|
(ema50 < close ? 1 : 0) + (sma50 < close ? 1 : 0) +
|
|
(ema100 < close ? 1 : 0) + (sma100 < close ? 1 : 0) +
|
|
(ema200 < close ? 1 : 0) + (sma200 < close ? 1 : 0) +
|
|
(rsi < 50 ? 1 : 0) + (stochK < 20 ? 1 : 0) + (cci < -100 ? 1 : 0) +
|
|
// (adx > 25 and close < open ? 1 : 0) + (ao < 0 ? 1 : 0) +
|
|
(momentum < 0 ? 1 : 0) + (macdHist < 0 ? 1 : 0)
|
|
// (stochRsi < 0.2 ? 1 : 0) + (willr < -80 ? 1 : 0) +
|
|
// (bearPower < 0 ? 1 : 0) + (uo < 50 ? 1 : 0)
|
|
|
|
// Plot the difference between above_count and below_count
|
|
plot(below_count - above_count, title="Above-Below Count", color=color.orange, linewidth=2)
|
|
|
|
// Zero line
|
|
hline(0, "Zero Line", color=color.red, linewidth=2)
|
|
|
|
// Strategy
|
|
entry_long = input(12, title="entry long")
|
|
entry_short = input(-12, title="entry short")
|
|
|
|
close_long = input(-9, title="close long")
|
|
close_short = input(9, title="close short")
|
|
|
|
if (below_count - above_count > close_short)
|
|
strategy.close("Sell")
|
|
|
|
if (below_count - above_count < close_long)
|
|
strategy.close("Buy")
|
|
// Buy signal
|
|
if (below_count - above_count > entry_long)
|
|
// strategy.close("Sell")
|
|
strategy.entry("Buy", strategy.long)
|
|
|
|
// Sell (or close short) signal
|
|
if (below_count - above_count < entry_short)
|
|
// strategy.close("Buy")
|
|
strategy.entry("Sell", strategy.short)
|
|
|
|
```
|
|
|
|
> Detail
|
|
|
|
https://www.fmz.com/strategy/455353
|
|
|
|
> Last Modified
|
|
|
|
2024-06-28 15:00:20
|